Climate
Verified dataThe Arctic has lost a third of its summer sea ice
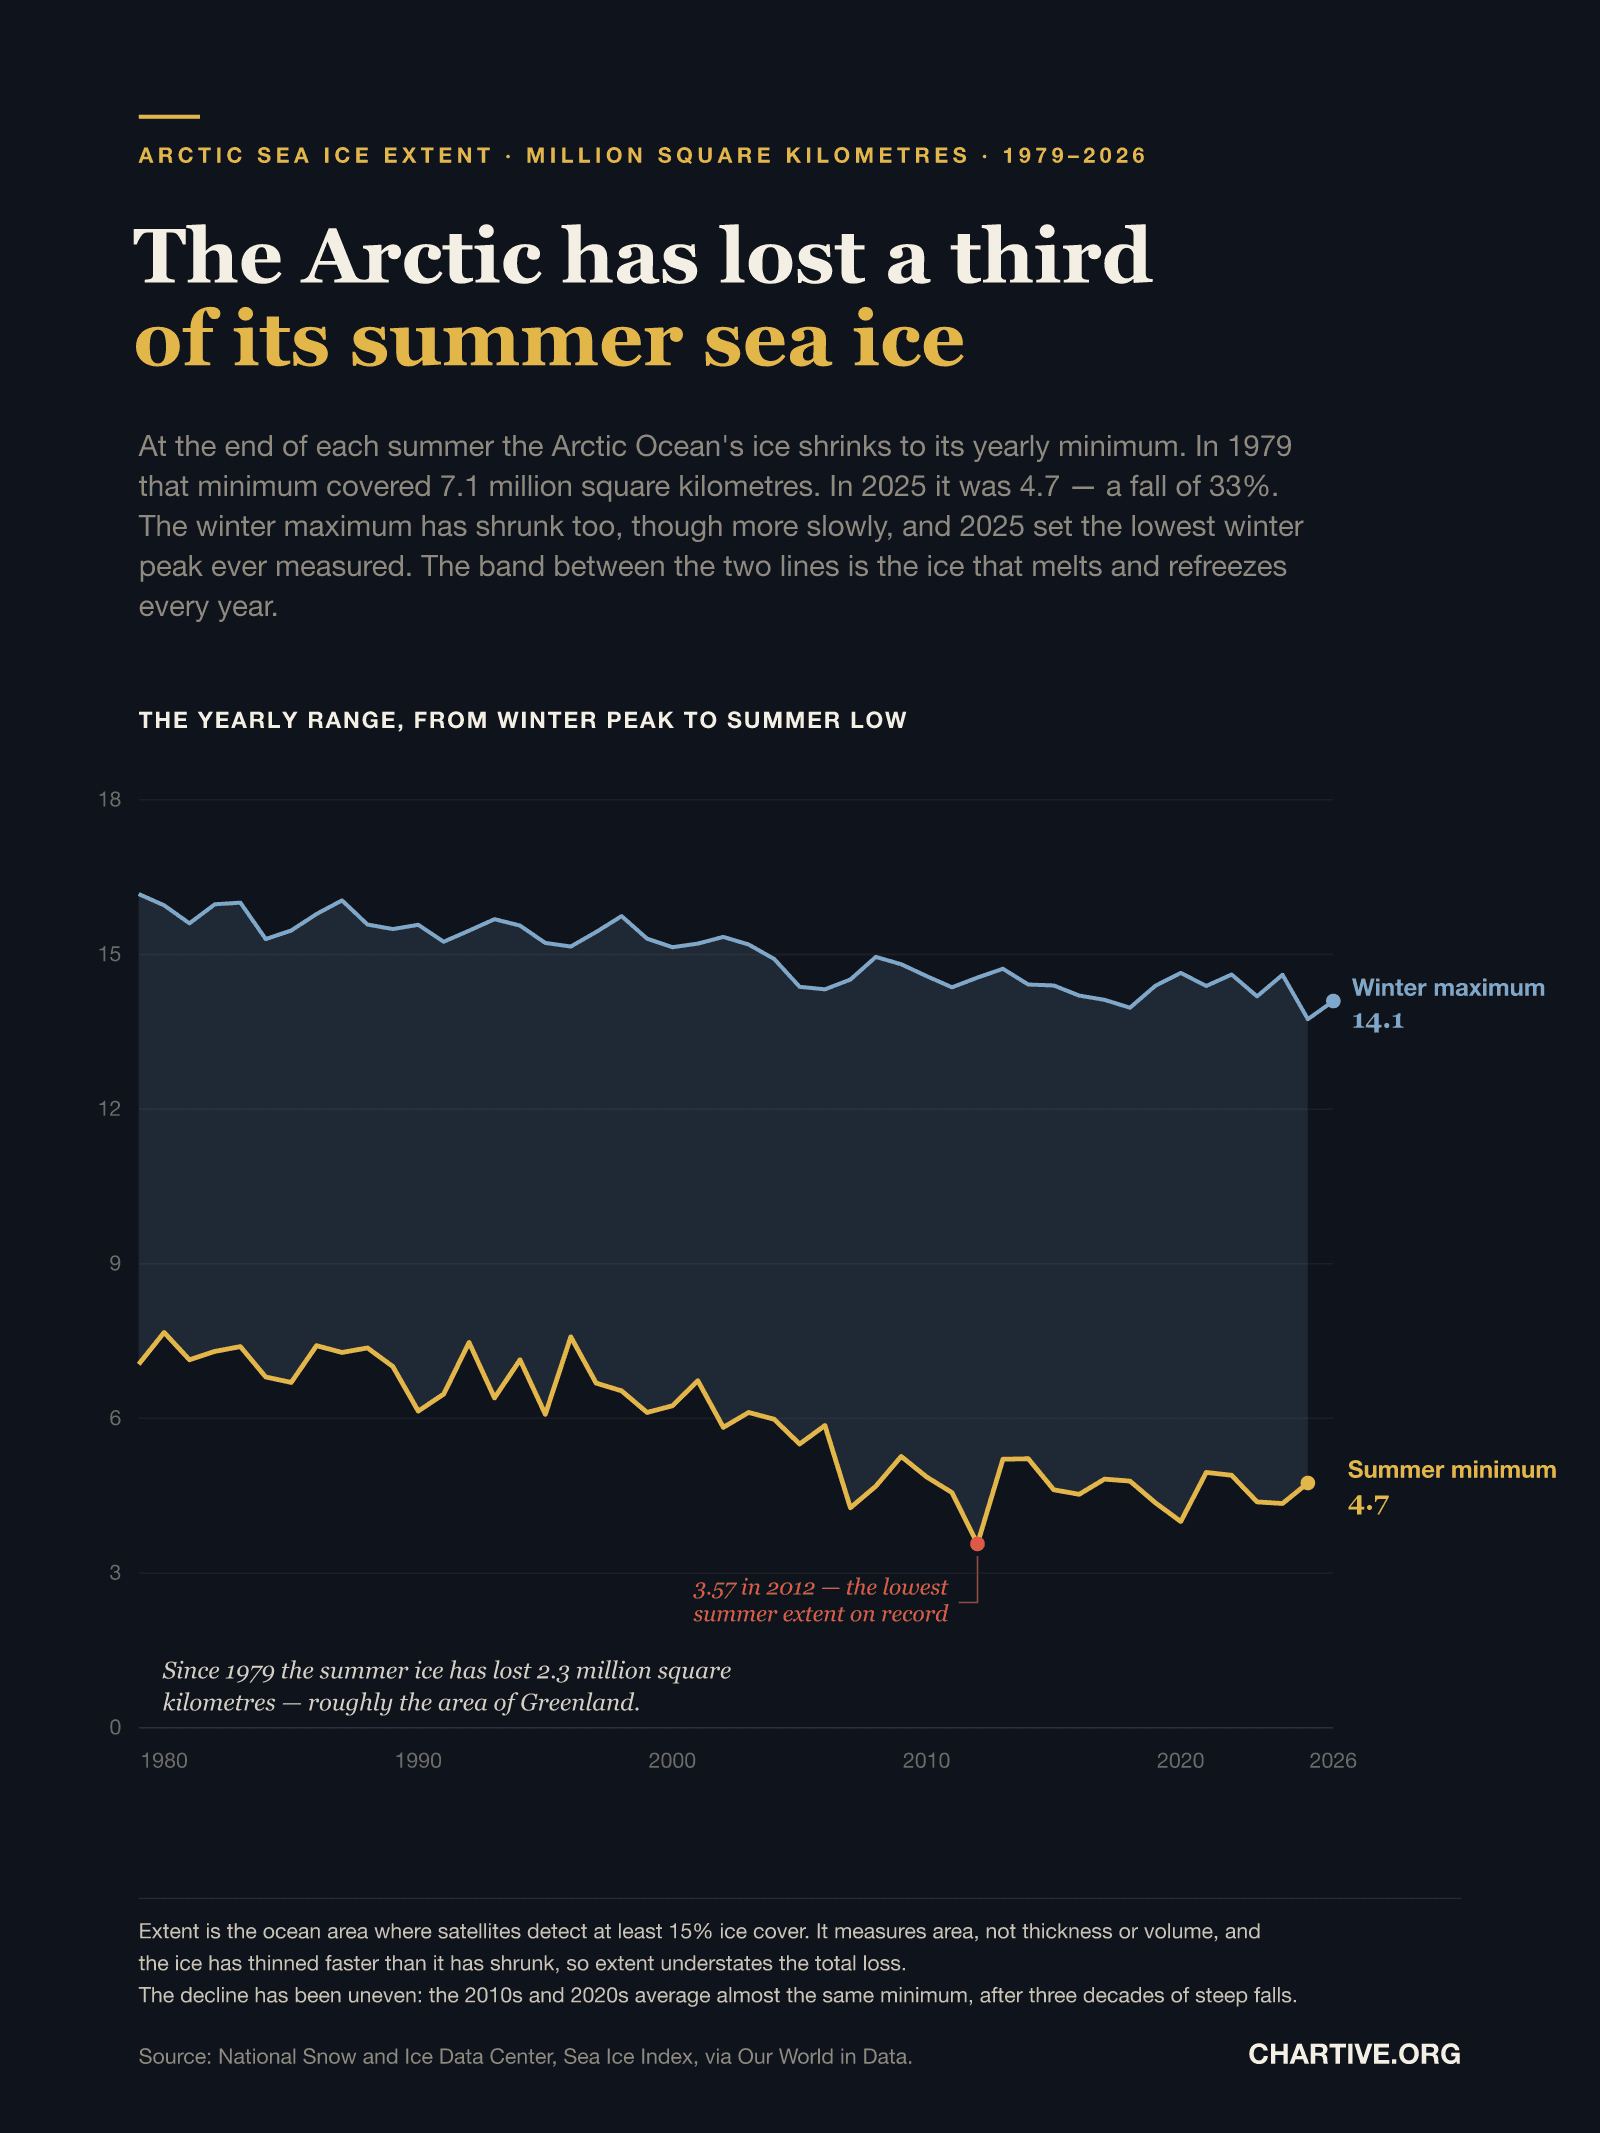
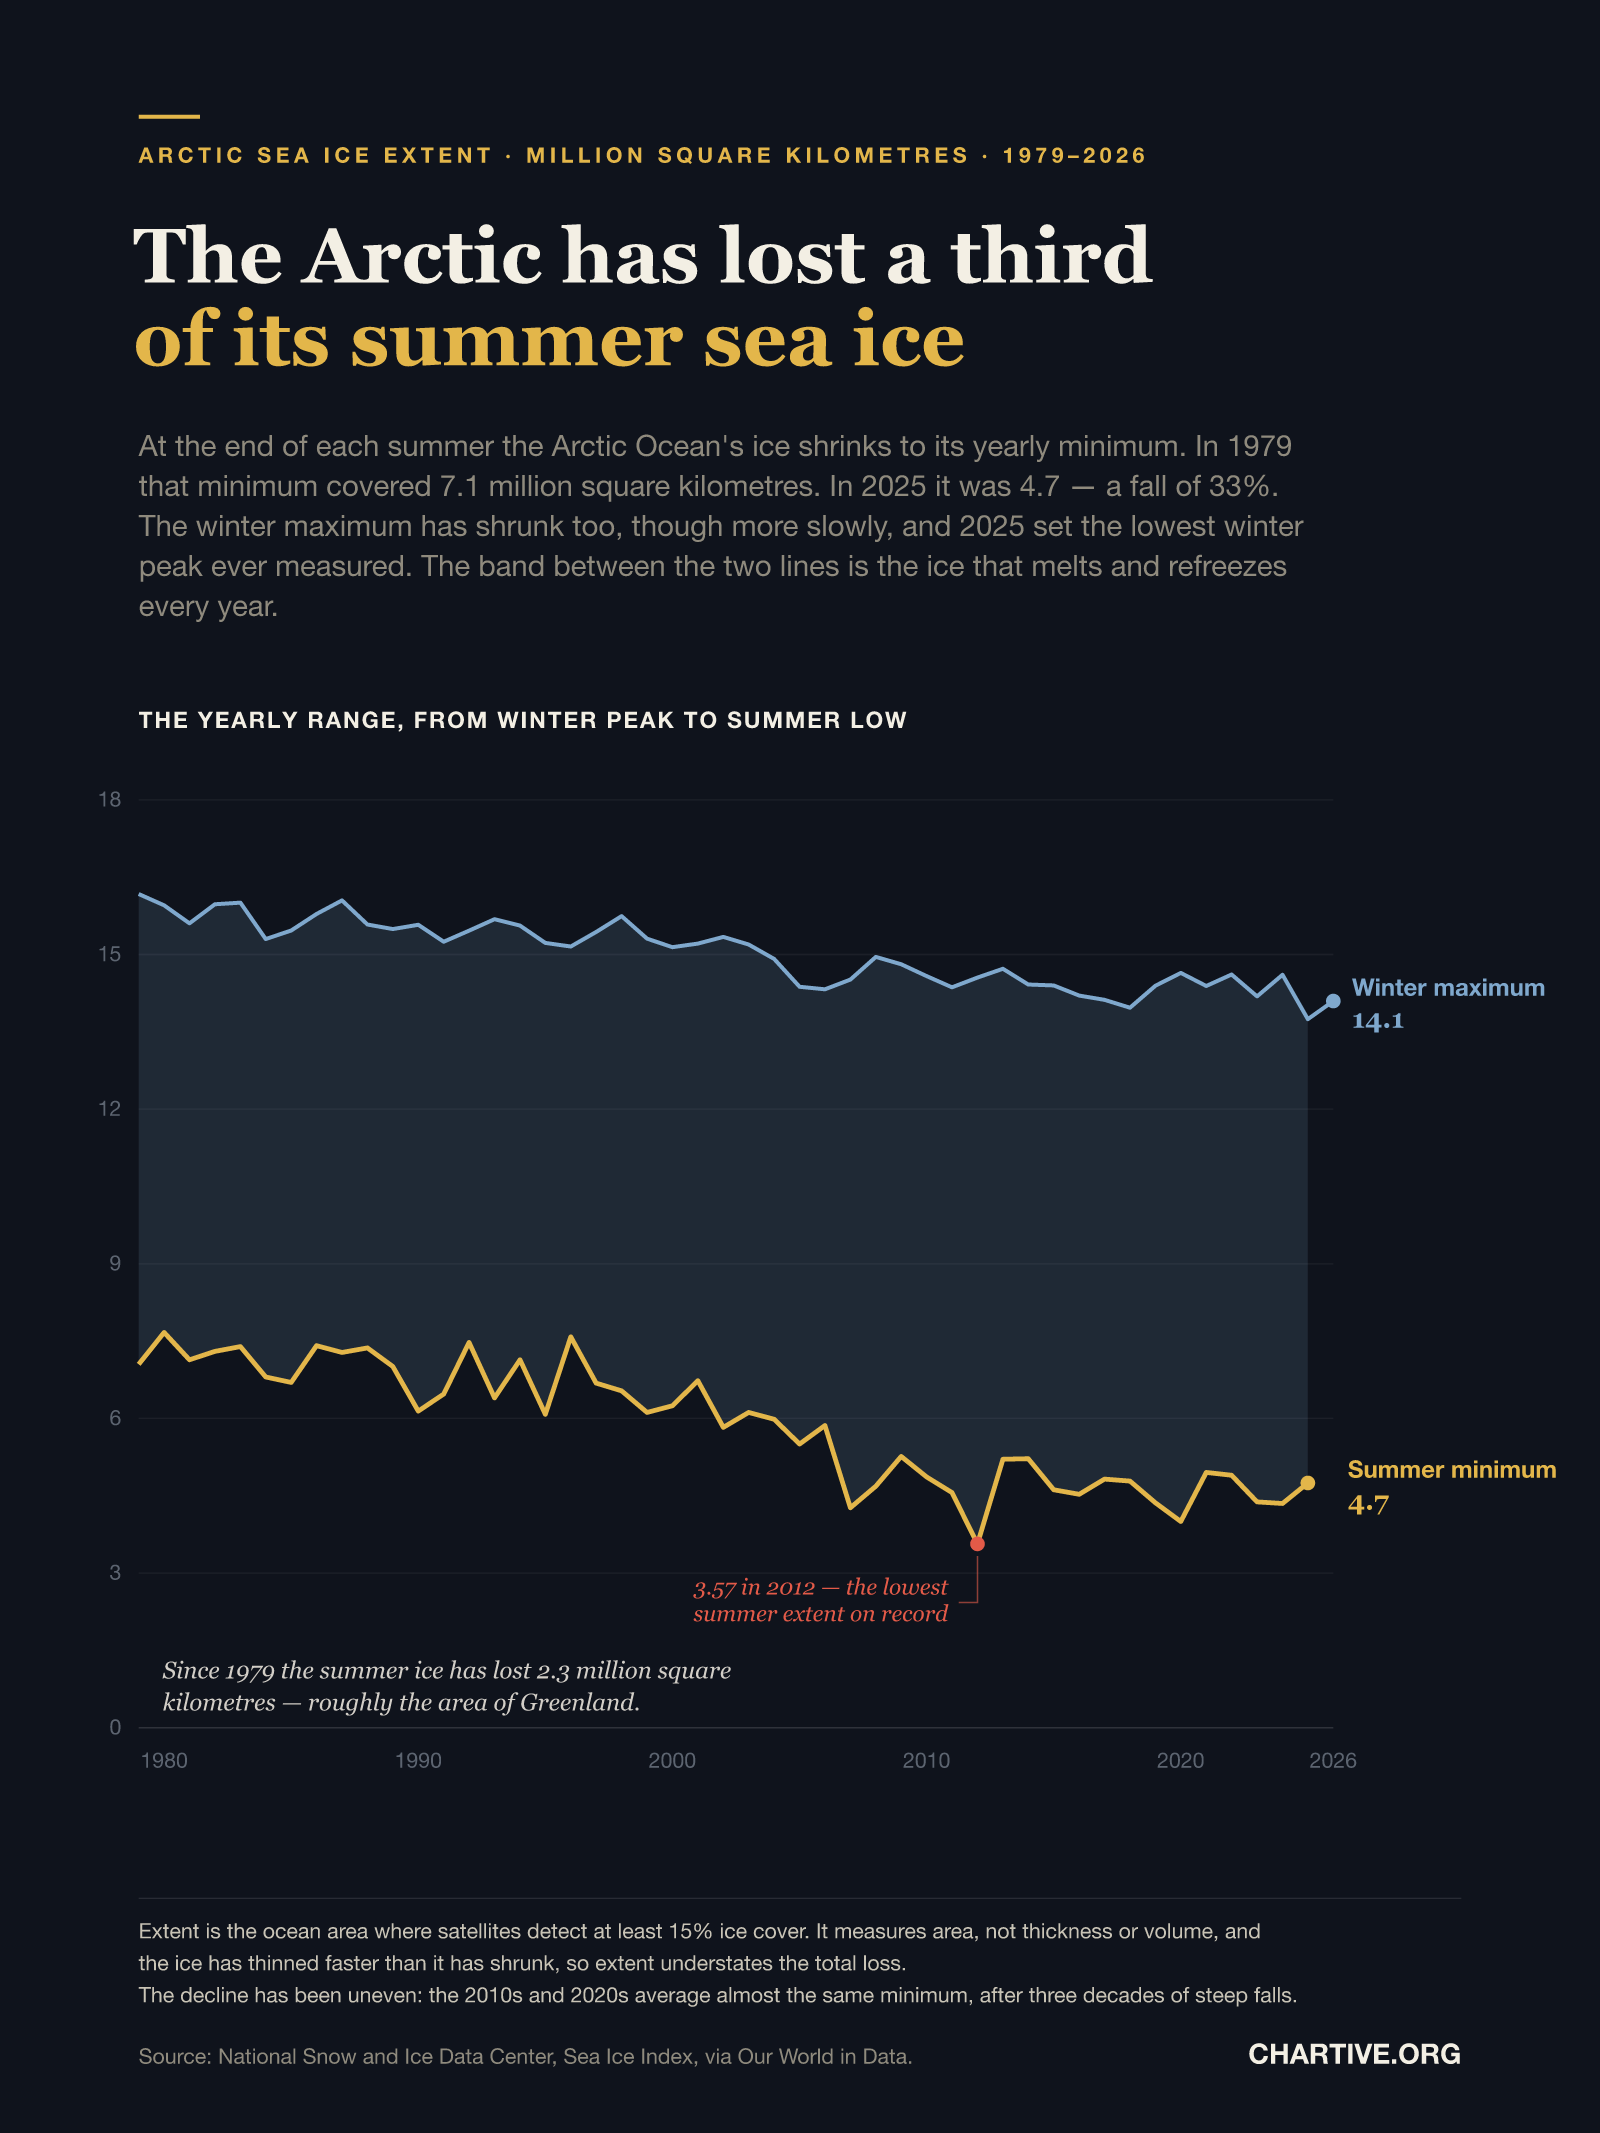
At its yearly minimum in 1979, Arctic sea ice covered 7.1 million square kilometres. In 2025 it was 4.7 — a fall of 33%, and a loss roughly the area of Greenland.
CSV · 48 rows · 1979–2026
Arctic sea ice shrinks each summer to a yearly minimum, and that minimum has fallen from 7.1 million square kilometres in 1979 to 4.7 in 2025 — a decline of 33%, or 2.3 million square kilometres, roughly the area of Greenland. The lowest summer extent on record was 3.57 million square kilometres in 2012. The winter maximum has fallen more slowly, by 13%, but 2025 set the lowest winter peak ever measured. Because satellites measure area rather than thickness, and the ice has thinned faster than it has shrunk, these figures understate the total loss.
Key findings
- The Arctic summer minimum fell from 7.1 million square kilometres in 1979 to 4.7 in 2025 — a drop of 33%.
- That is a loss of 2.3 million square kilometres, roughly the area of Greenland.
- The lowest summer extent on record was 3.57 million square kilometres, in 2012.
- The winter maximum has fallen more slowly, from 16.2 to 14.1 — about 13%.
- But 2025 set the lowest winter maximum ever measured, at 13.7 million square kilometres.
- The average summer minimum fell from 7.2 in the 1980s to 5.7 in the 2000s and 4.6 in the 2010s.
- It has since levelled off: the 2020s average 4.6, almost the same as the 2010s.
Explore the data
Coverage: Jan 1, 1979 – Dec 31, 2026 · Arctic Ocean
Free to download and reuse. Get the data behind every new chart →
Sources
Primary source
Sea Ice Index
National Snow and Ice Data Center
Arctic sea ice extent, yearly maximum and minimum
Accessed Aug 30, 2026
NSIDC Sea Ice Index, satellite passive-microwave record since 1979, with minor processing by Our World in Data. The 2026 summer minimum was not yet available.
Methodology
Extent is the total ocean area in which satellites detect at least 15% ice cover, measured continuously by passive-microwave sensors since 1979. Figures are the National Snow and Ice Data Center's Sea Ice Index, accessed through Our World in Data. Each year contributes two values: the maximum, which normally falls in February or March, and the minimum, normally in September. The shaded band between the two lines is the ice that melts and refreezes within a single year. The 2026 minimum is not yet available, since the melt season had not ended when this chart was made, so the summer line ends in 2025.
What this does not show
Extent measures area, not thickness or volume. Arctic ice has thinned considerably over the same period as old multi-year ice has been replaced by thinner seasonal ice, so a chart of extent understates how much ice has actually been lost. The decline has not been steady: the 2010s and 2020s have averaged almost the same summer minimum, after three decades of steep falls, and individual years swing widely with weather — 2012's record low owed much to a single August storm. The satellite record begins in 1979 because that is when continuous passive-microwave coverage started, not because the ice was stable before then.
Creator
Reuse this visualization
Cite this
License: CC BY 4.0
Embed code
<figure style="margin:0;max-width:1600px">
  <a href="https://chartive.org/visualizations/arctic-sea-ice-1979-2026" target="_blank" rel="noopener">
    <img src="https://chartive.org/infographics/arctic-sea-ice-1979-2026.png" alt="Band chart of Arctic sea ice extent from 1979 to 2026 in million square kilometres. An upper blue line traces the winter maximum, falling from 16.2 in 1979 to 14.1 in 2026, with the lowest winter peak on record, 13.7, in 2025. A lower gold line traces the summer minimum, falling from 7.1 in 1979 to 4.7 in 2025, with a record low of 3.57 in 2012 marked in red. The shaded band between the two lines is the ice that melts and refreezes each year." width="1600" height="2133" style="max-width:100%;height:auto" />
  </a>
  <figcaption style="font:14px/1.4 system-ui,sans-serif;color:#57534e;margin-top:8px">
    Graphic by Chartive Editorial, using data from Sea Ice Index — via <a href="https://chartive.org/visualizations/arctic-sea-ice-1979-2026" target="_blank" rel="noopener">Chartive</a>
  </figcaption>
</figure>
Reuse is welcome — the embed keeps a link back to the source.