Technology
Verified dataThe top of the market went all-in on tech
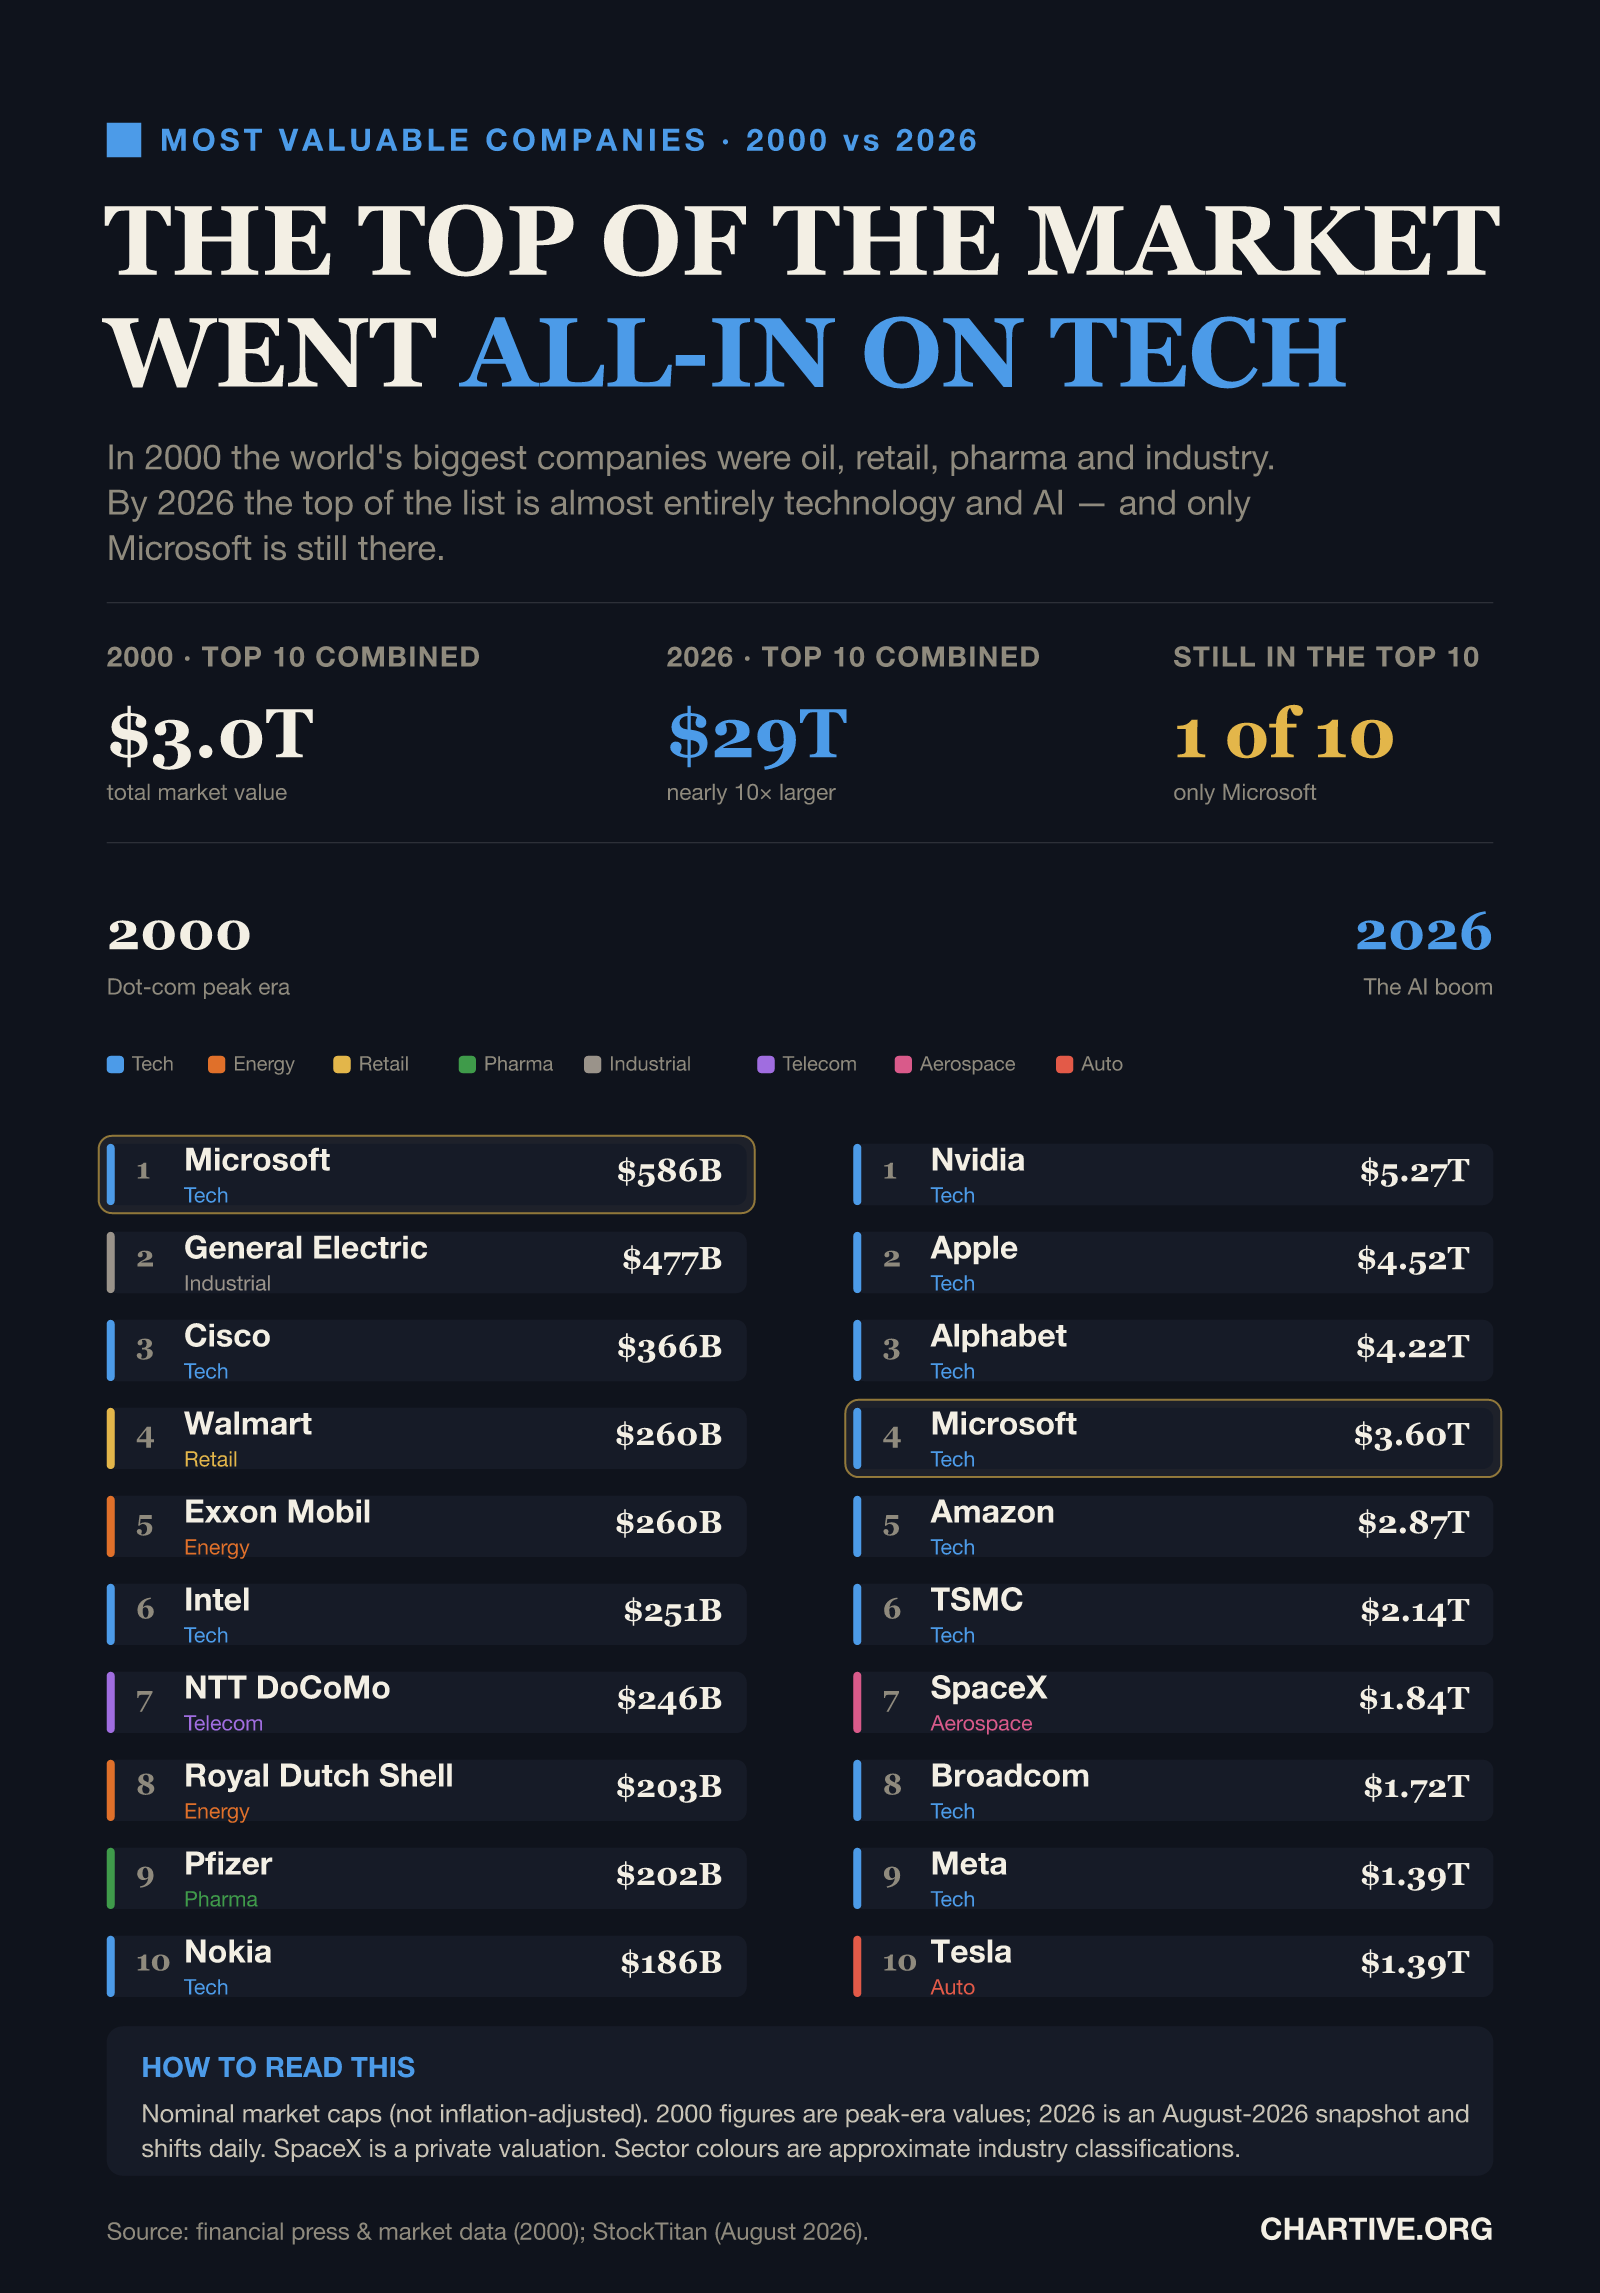
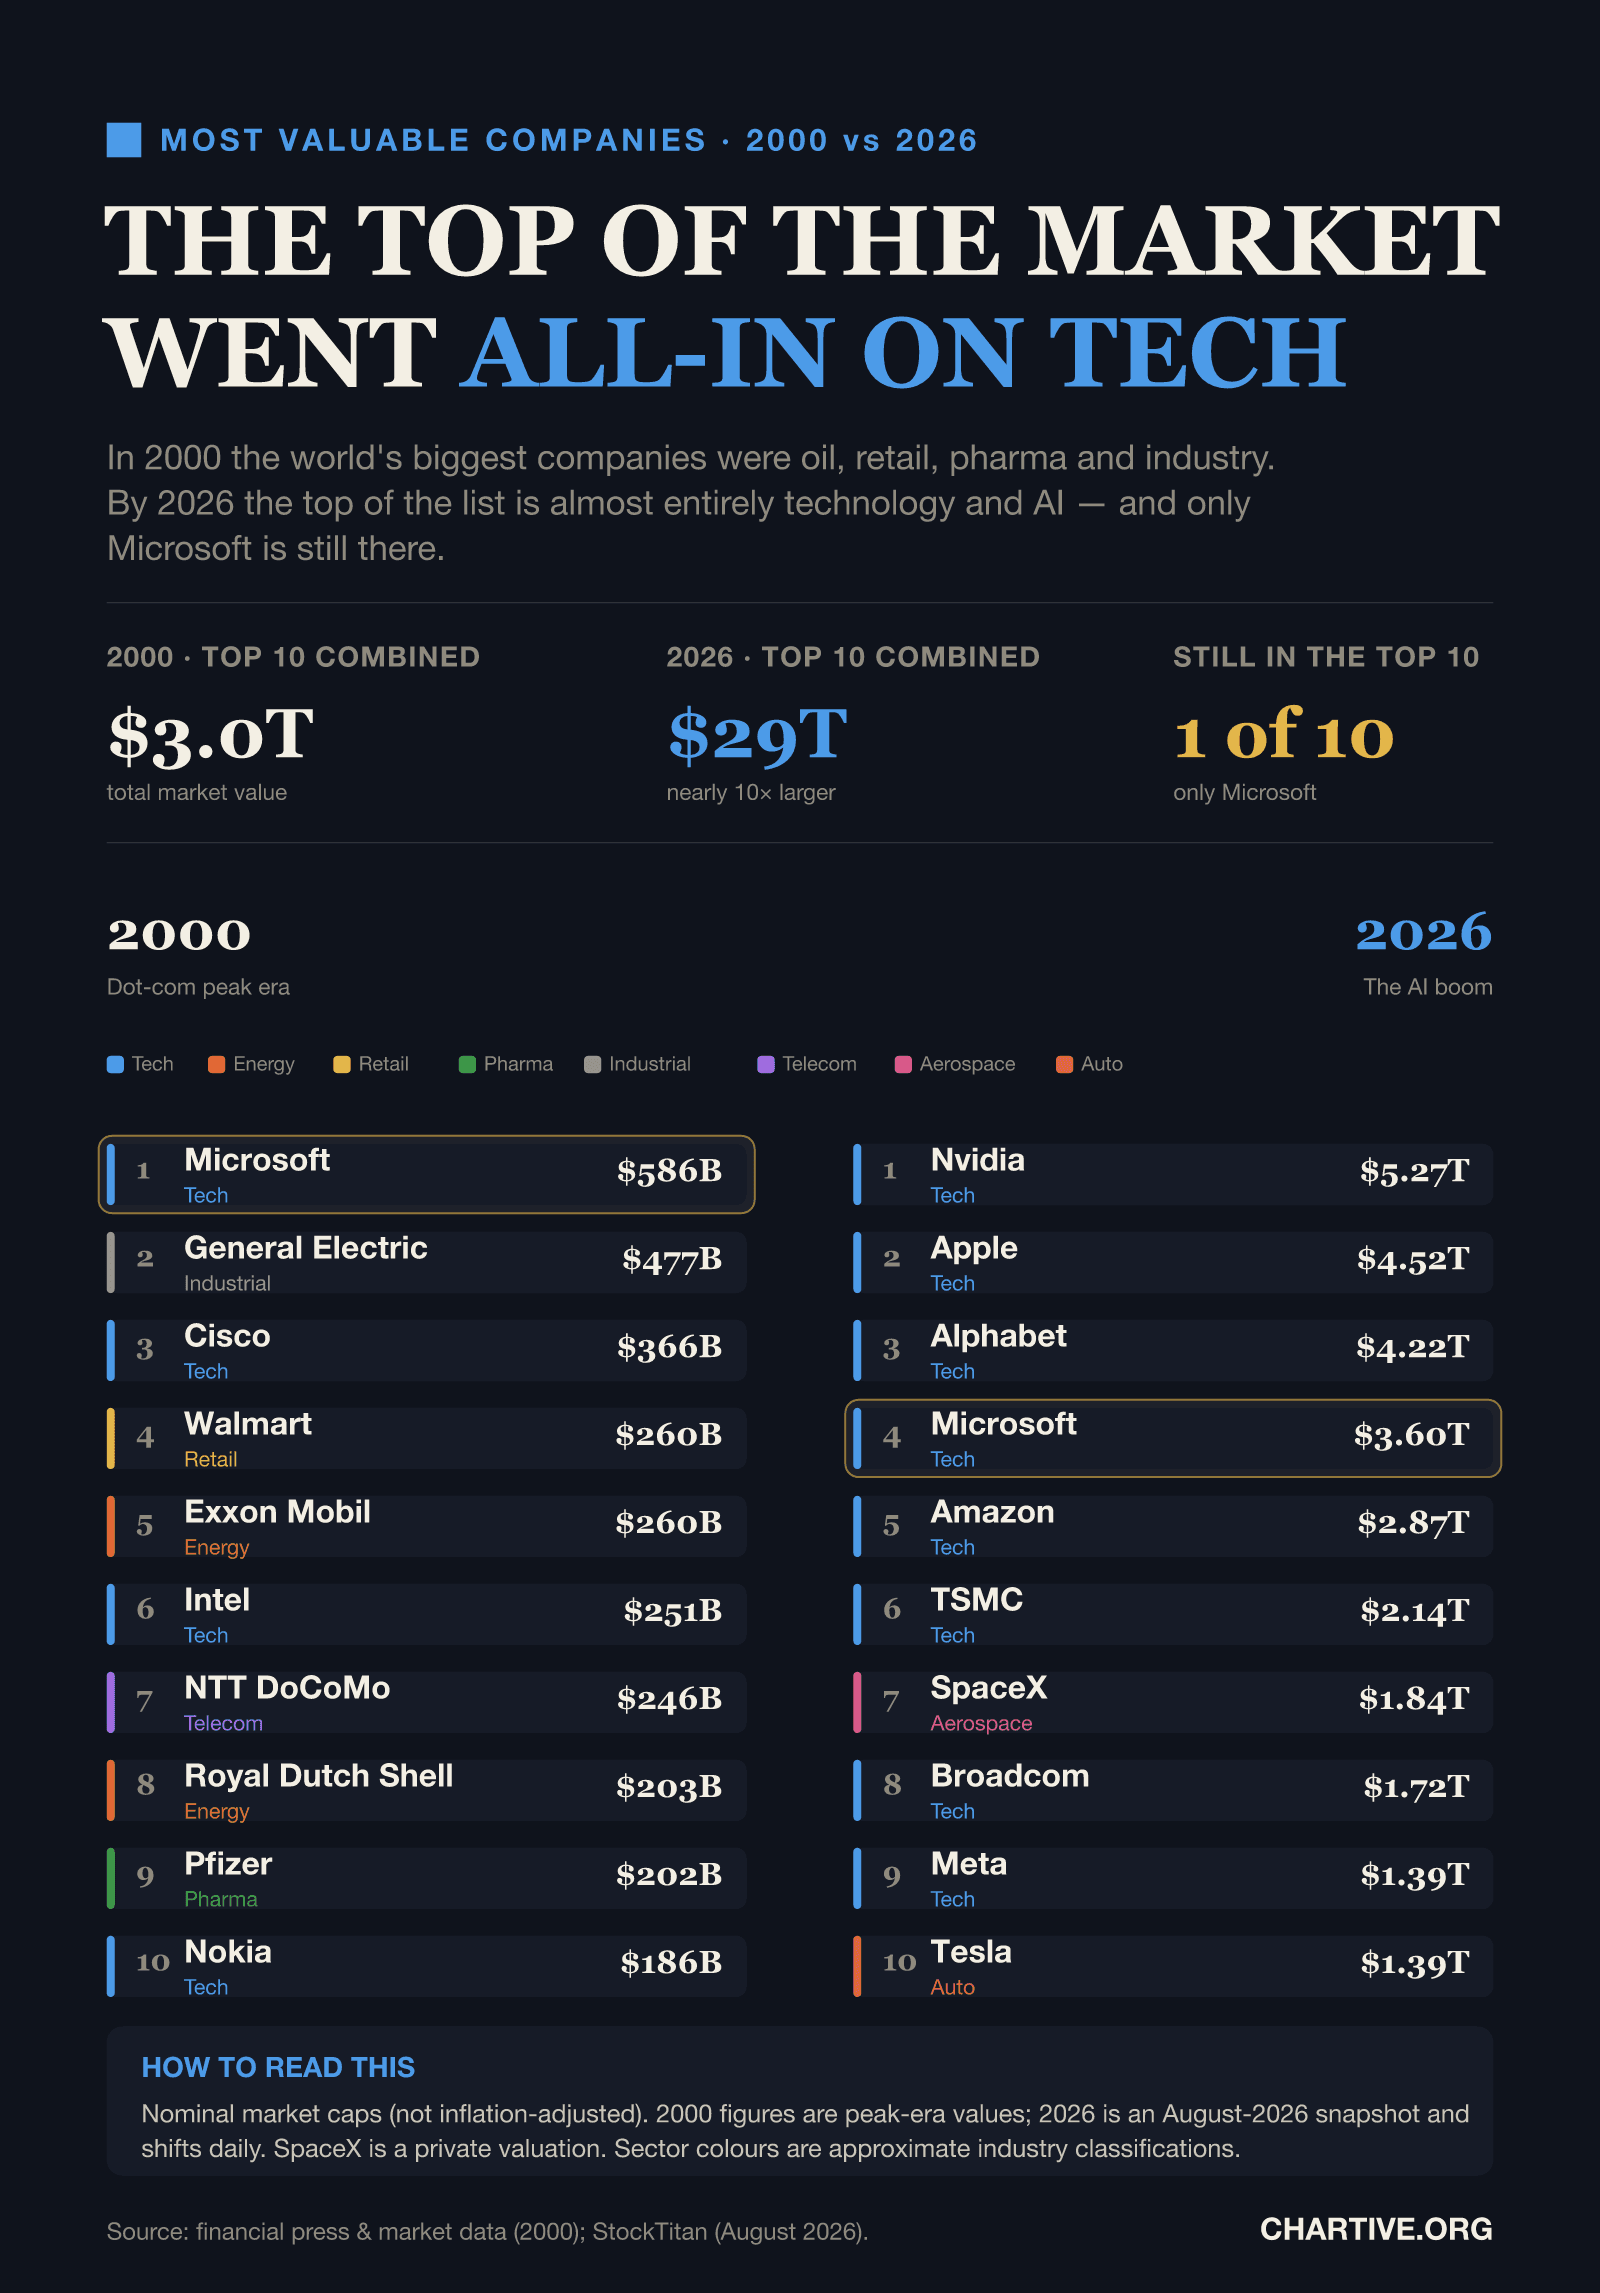
In 2000 the world's biggest companies were oil, retail, pharma and industry. By 2026 the top of the list is almost entirely technology and AI — and only Microsoft is still there.
CSV · 20 rows · 2000–2026
The 10 most valuable public companies were worth about $3 trillion combined in 2000 and nearly $29 trillion in 2026 — almost ten times more. In 2000 they spanned oil, retail, pharma and industry; by 2026 the list is dominated by technology and AI, and Microsoft is the only company in both top tens.
Key findings
- The 10 most valuable companies were worth about $3 trillion in 2000 and nearly $29 trillion in 2026 — almost ten times more.
- In 2000 the list spanned oil, retail, pharma, industry and telecom; by 2026 it is dominated by technology and AI.
- Microsoft is the only company in both top tens; giants like GE, Cisco, Exxon and Nokia have dropped out entirely.
Explore the data
Coverage: Jan 1, 2000 – Dec 31, 2026 · Global
Free to download and reuse. Get the data behind every new chart →
Sources
Primary source
StockTitan
Company market data
Largest companies by market cap (August 2026)
Accessed Aug 22, 2026
Public-company market-cap snapshot, August 2026 (nominal USD).
Financial press & market data
Largest companies by market capitalisation, 2000
Accessed Aug 22, 2026
Widely-cited nominal peak-era market caps for 2000.
Methodology
The ten most valuable public companies by market capitalisation, in nominal US dollars, for 2000 and August 2026. The 2000 figures are widely-cited peak-era values from the financial press; the 2026 snapshot is from StockTitan. Market capitalisations are not adjusted for inflation and fluctuate daily.
What this does not show
Values are nominal market capitalisations, not adjusted for inflation. The 2000 figures reflect the dot-com-peak era and the 2026 figures are an August-2026 snapshot that shifts daily. SpaceX is a private company, so its figure is a private-round valuation rather than a public market cap. Sector labels are approximate industry classifications.
Creator
Reuse this visualization
Cite this
License: CC BY 4.0
Embed code
<figure style="margin:0;max-width:1600px">
  <a href="https://chartive.org/visualizations/most-valuable-companies-2000-vs-2026" target="_blank" rel="noopener">
    <img src="https://chartive.org/infographics/most-valuable-companies-2000-vs-2026.png" alt="Two ranked lists of the 10 most valuable companies. In 2000: Microsoft, General Electric, Cisco, Walmart, Exxon Mobil, Intel, NTT DoCoMo, Royal Dutch Shell, Pfizer and Nokia — spanning many sectors. In 2026: Nvidia, Apple, Alphabet, Microsoft, Amazon, TSMC, SpaceX, Broadcom, Meta and Tesla — almost all technology." width="1600" height="2293" style="max-width:100%;height:auto" />
  </a>
  <figcaption style="font:14px/1.4 system-ui,sans-serif;color:#57534e;margin-top:8px">
    Graphic by Chartive Editorial, using data from StockTitan — via <a href="https://chartive.org/visualizations/most-valuable-companies-2000-vs-2026" target="_blank" rel="noopener">Chartive</a>
  </figcaption>
</figure>
Reuse is welcome — the embed keeps a link back to the source.