Economy
Verified dataExtreme poverty is retreating
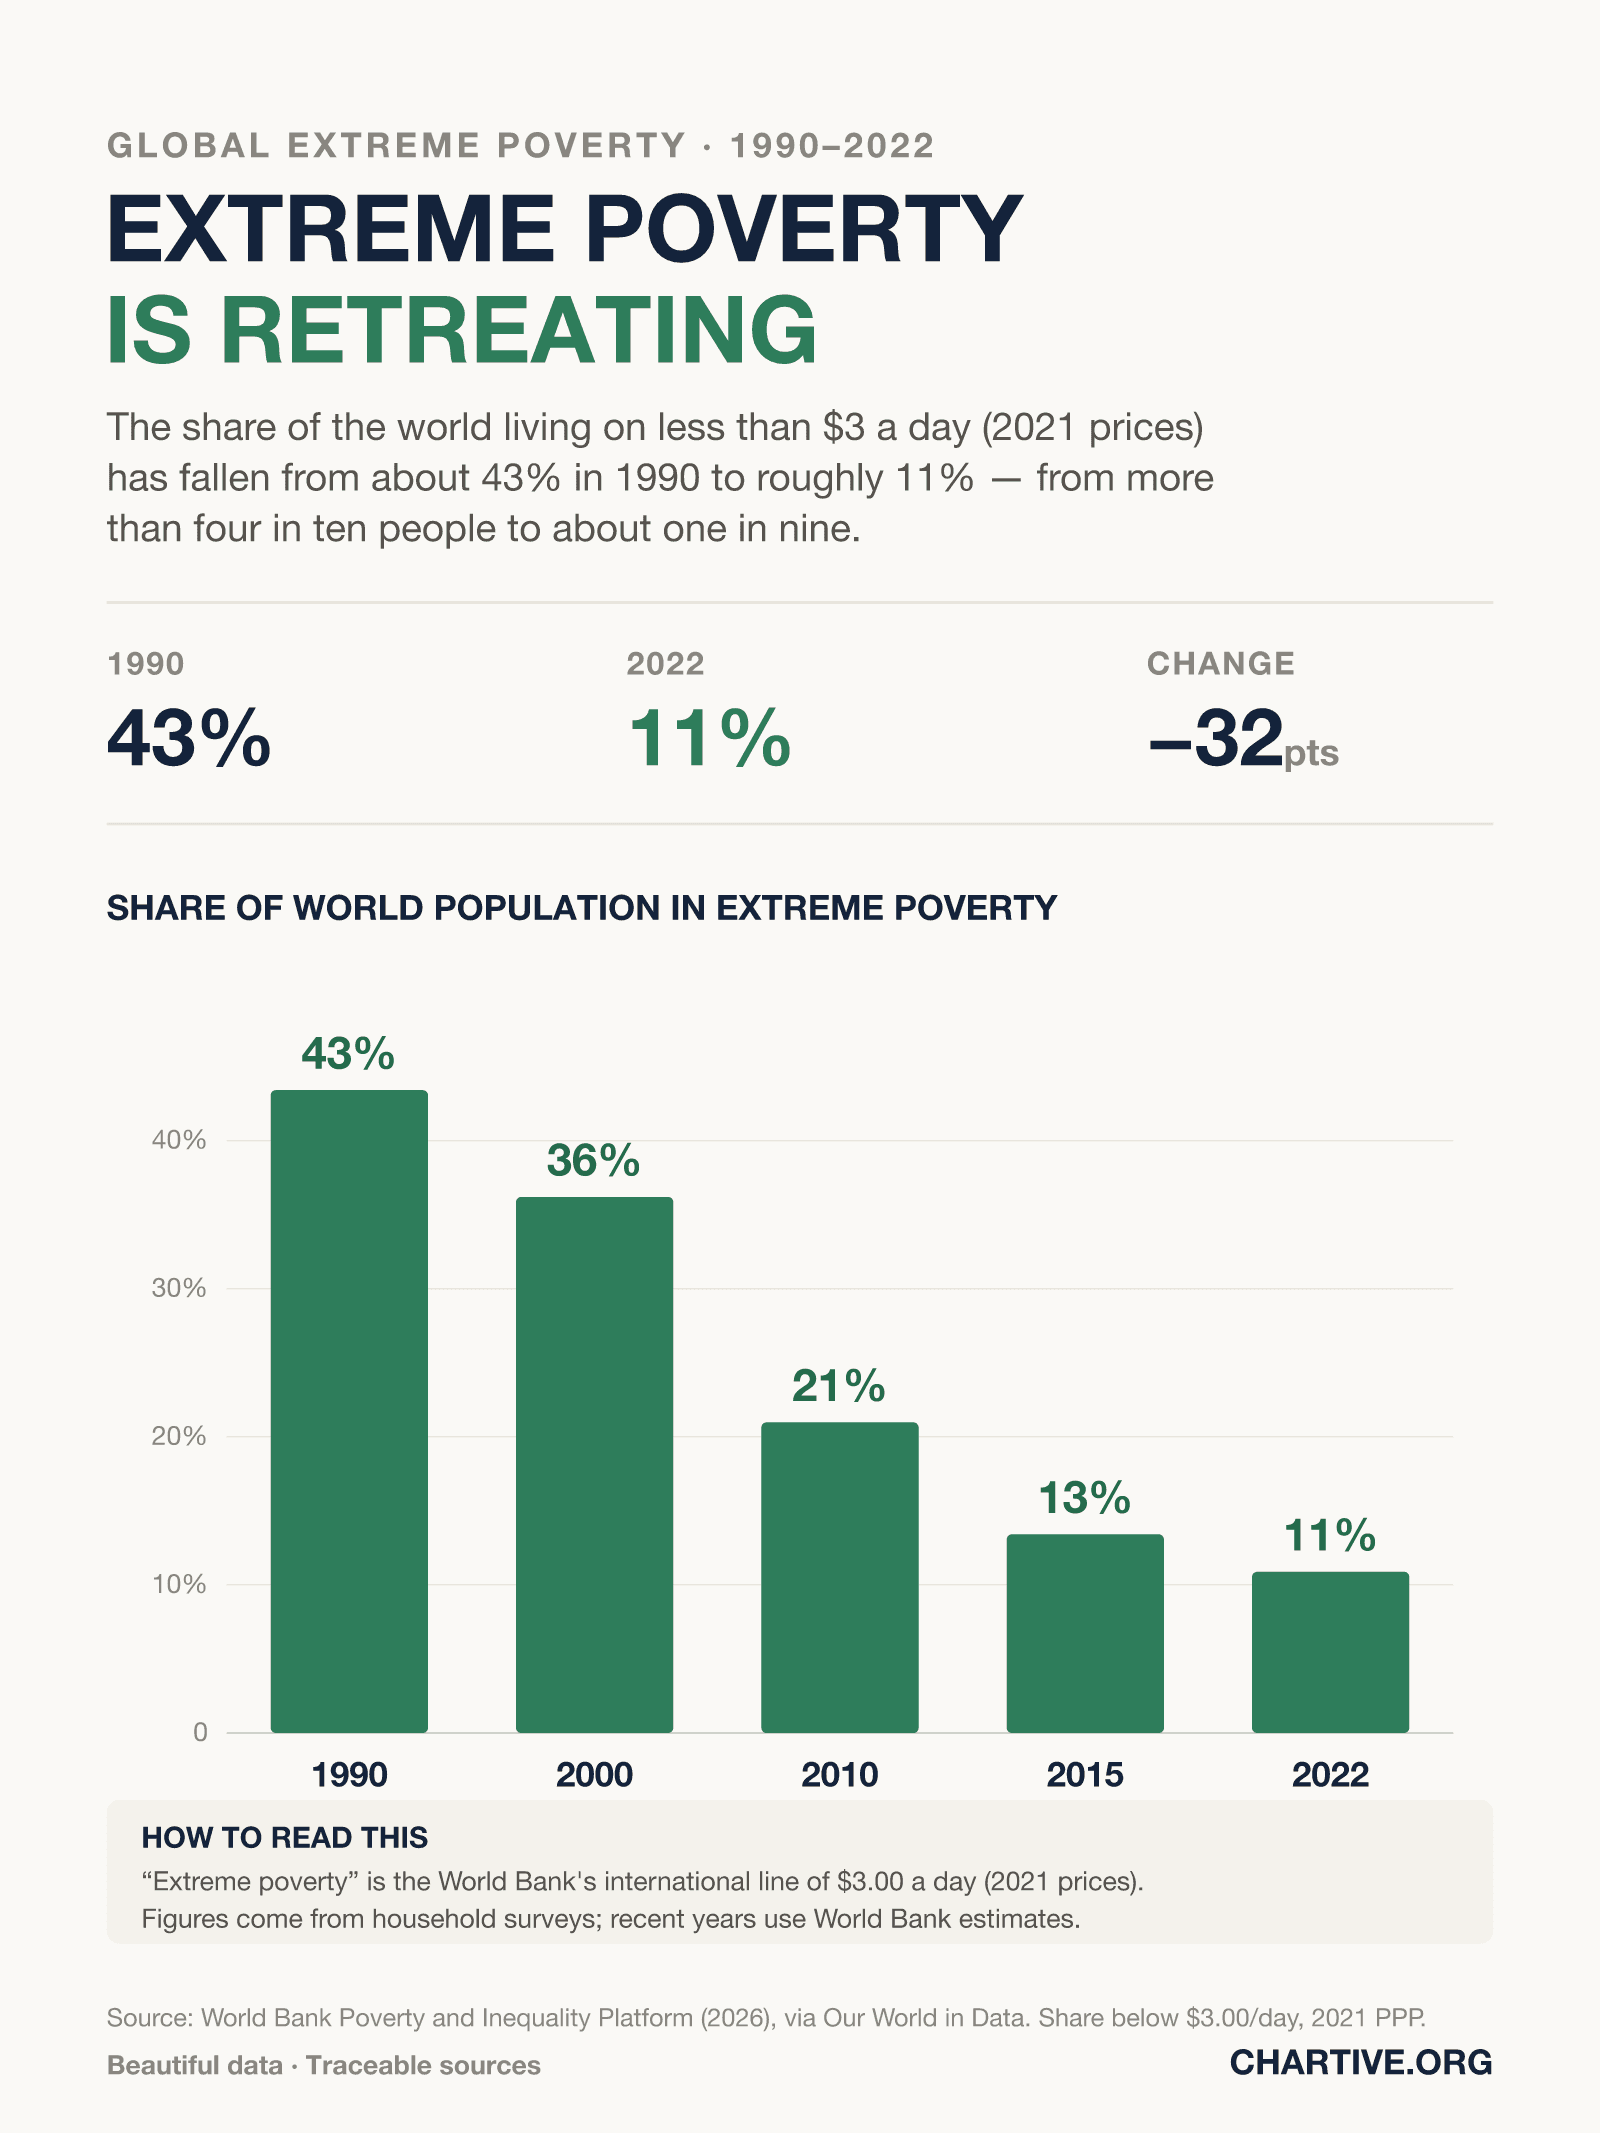
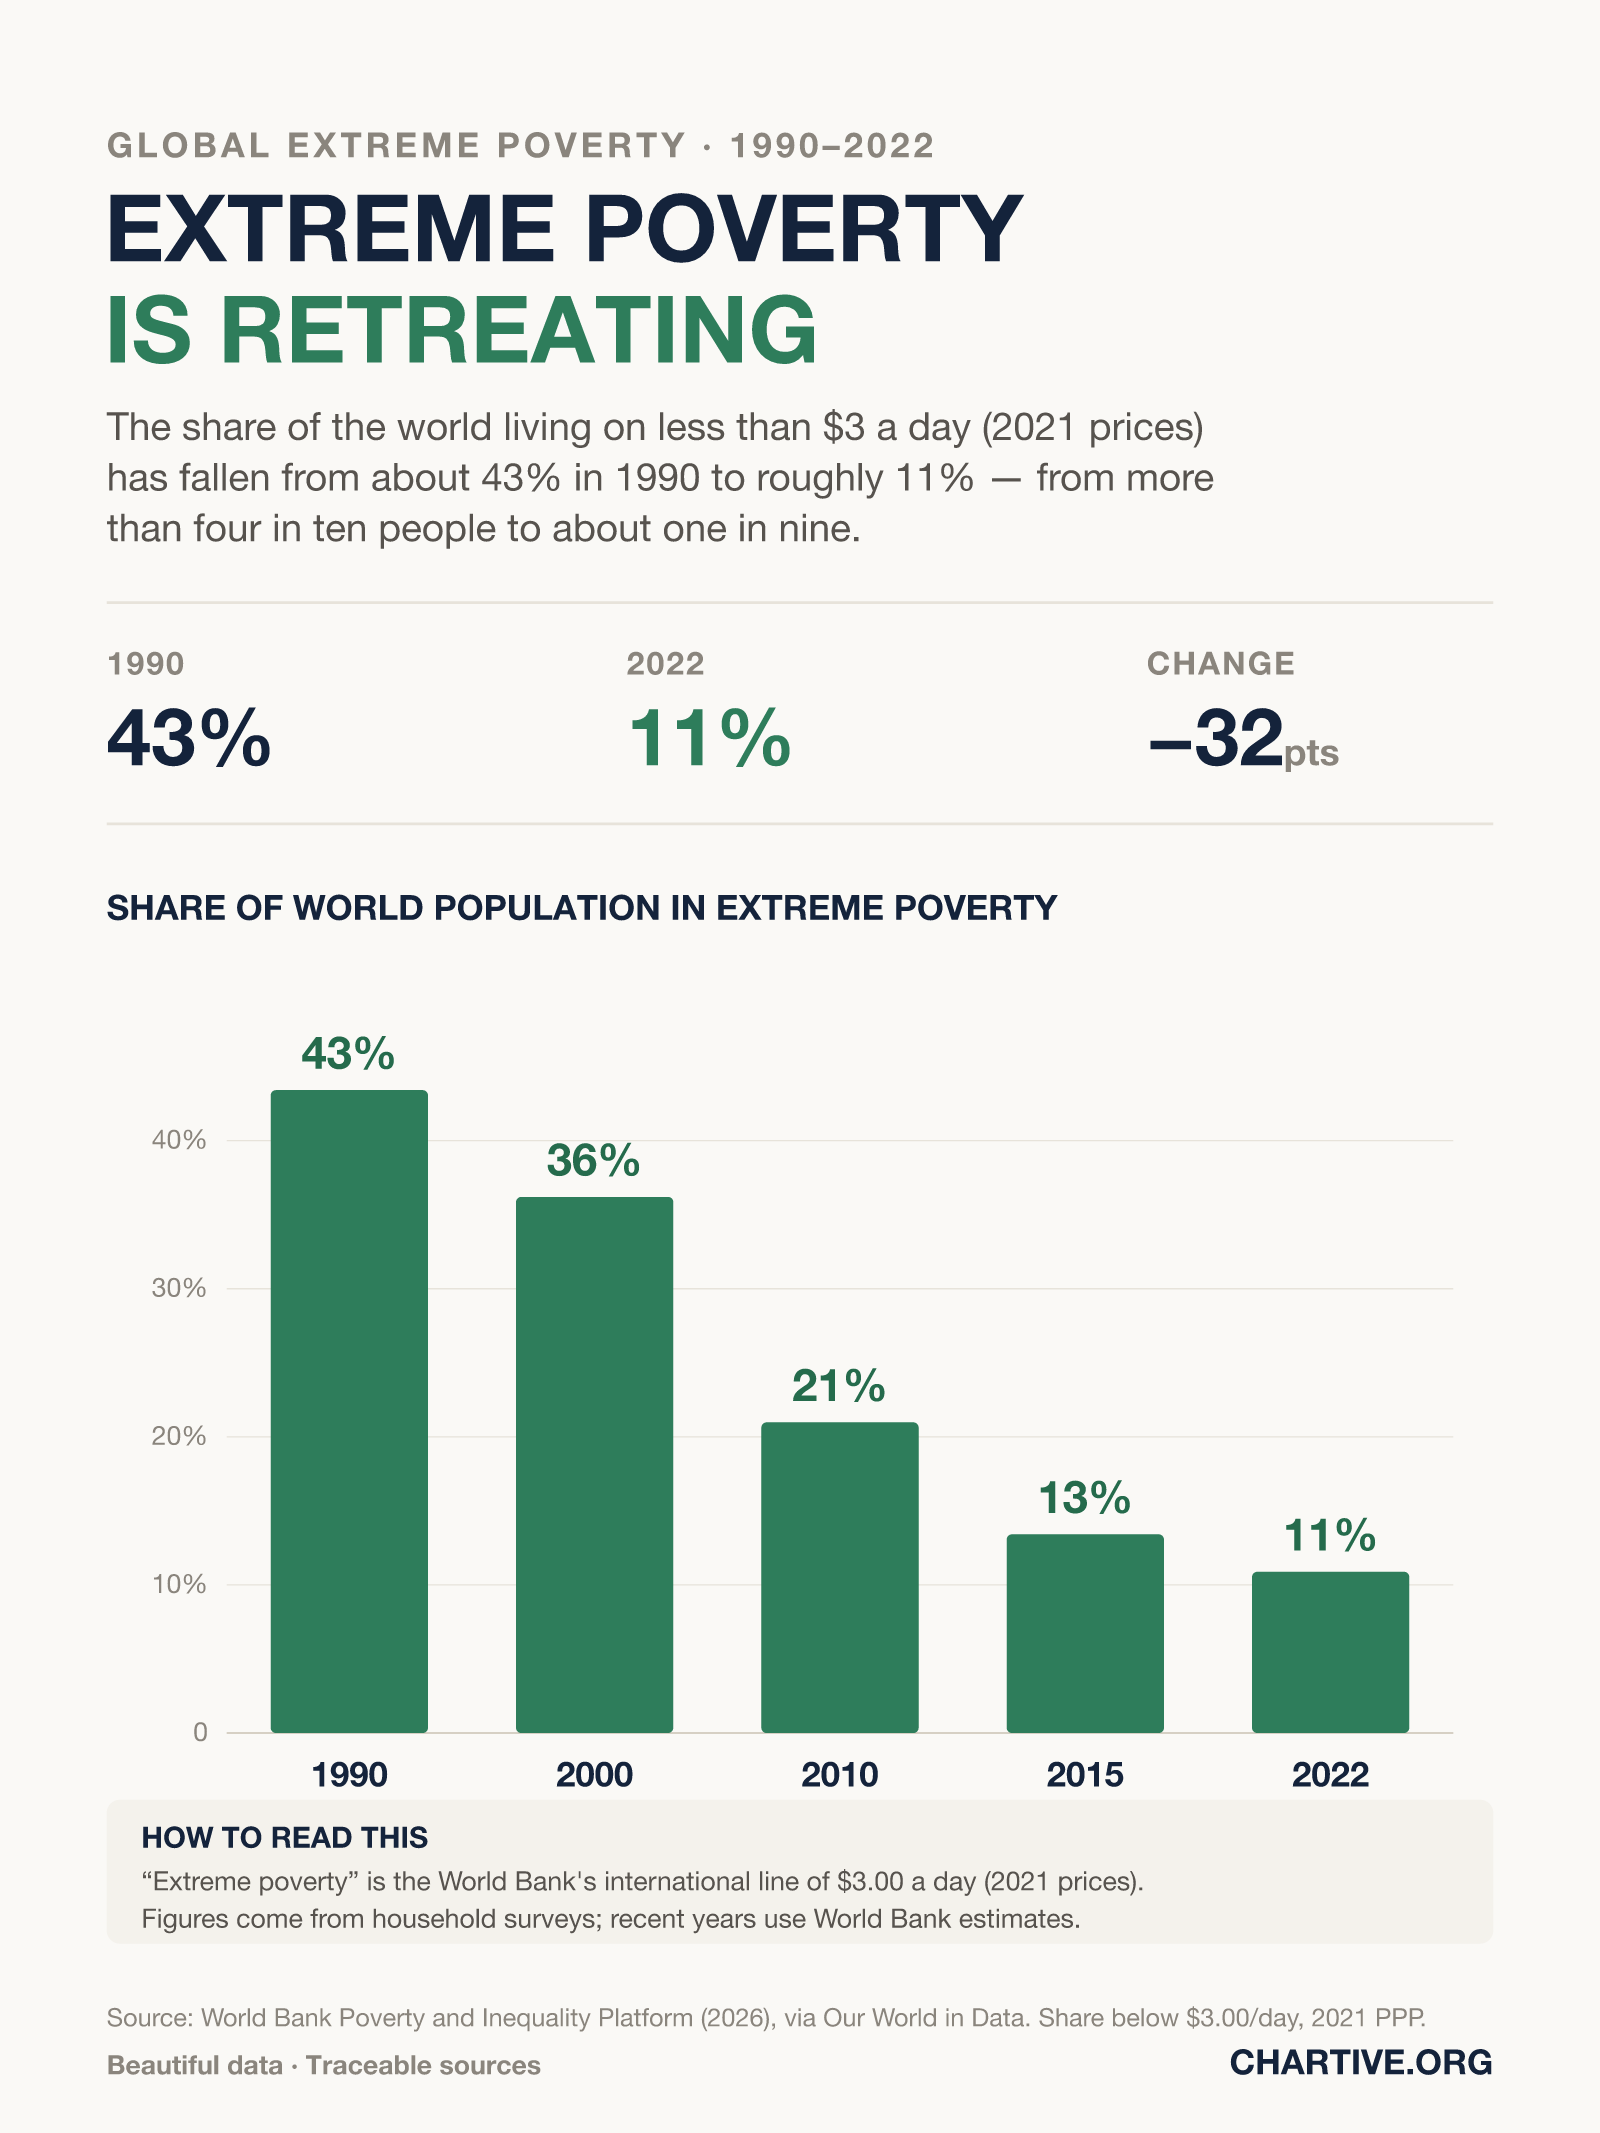
The share of the world living on less than $3 a day (2021 prices) has fallen from about 43% in 1990 to roughly 11% — from more than four in ten people to about one in nine.
CSV · 33 rows · 1990–2022
By the World Bank's updated $3.00-a-day line, the share of the world in extreme poverty fell from about 43% in 1990 to roughly 11% in 2022 — a drop of more than 30 percentage points, despite a setback during the pandemic.
Key findings
- At the World Bank's $3.00-a-day line, extreme poverty fell from about 43% of the world in 1990 to around 11% in 2022.
- The fastest declines came in the 2000s and 2010s, driven largely by rising incomes in Asia.
- Progress stalled around the pandemic — the rate ticked up in 2020 before resuming its fall.
Explore the data
Coverage: Jan 1, 1990 – Dec 31, 2022 · World
Free to download and reuse. Get the data behind every new chart →
Sources
Primary source
World Bank Poverty and Inequality Platform
via Our World in Data
Share of population in extreme poverty ($3.00 a day, 2021 PPP)
Accessed Aug 14, 2026
Updated $3.00/day international poverty line, 2021 PPP; based on household surveys.
Methodology
Share of the world's population living on less than $3.00 a day, measured in 2021 purchasing-power-parity (PPP) dollars — the World Bank's updated international poverty line. Estimates come from the World Bank's Poverty and Inequality Platform (2026), distributed via Our World in Data, and are based on household income and consumption surveys.
What this does not show
Poverty figures depend heavily on the chosen line; this uses the World Bank's updated $3.00-a-day (2021 PPP) threshold, which is higher than the previous $2.15 (2017 PPP) line and so shows larger shares. Estimates are based on household surveys, and figures for the most recent years rely on World Bank nowcasts rather than fresh survey data.
Creator
Reuse this visualization
Cite this
License: CC BY 4.0
Embed code
<figure style="margin:0;max-width:1600px">
  <a href="https://chartive.org/visualizations/extreme-poverty-1990-2022" target="_blank" rel="noopener">
    <img src="https://chartive.org/infographics/extreme-poverty-1990-2022.png" alt="Column chart of the share of the world's population in extreme poverty (below $3.00 a day, 2021 prices): 43% in 1990, 36% in 2000, 21% in 2010, 13% in 2015 and 11% in 2022." width="1600" height="2133" style="max-width:100%;height:auto" />
  </a>
  <figcaption style="font:14px/1.4 system-ui,sans-serif;color:#57534e;margin-top:8px">
    Graphic by Daniel Okafor, using data from World Bank Poverty and Inequality Platform — via <a href="https://chartive.org/visualizations/extreme-poverty-1990-2022" target="_blank" rel="noopener">Chartive</a>
  </figcaption>
</figure>
Reuse is welcome — the embed keeps a link back to the source.