Technology
Verified dataThe world came online
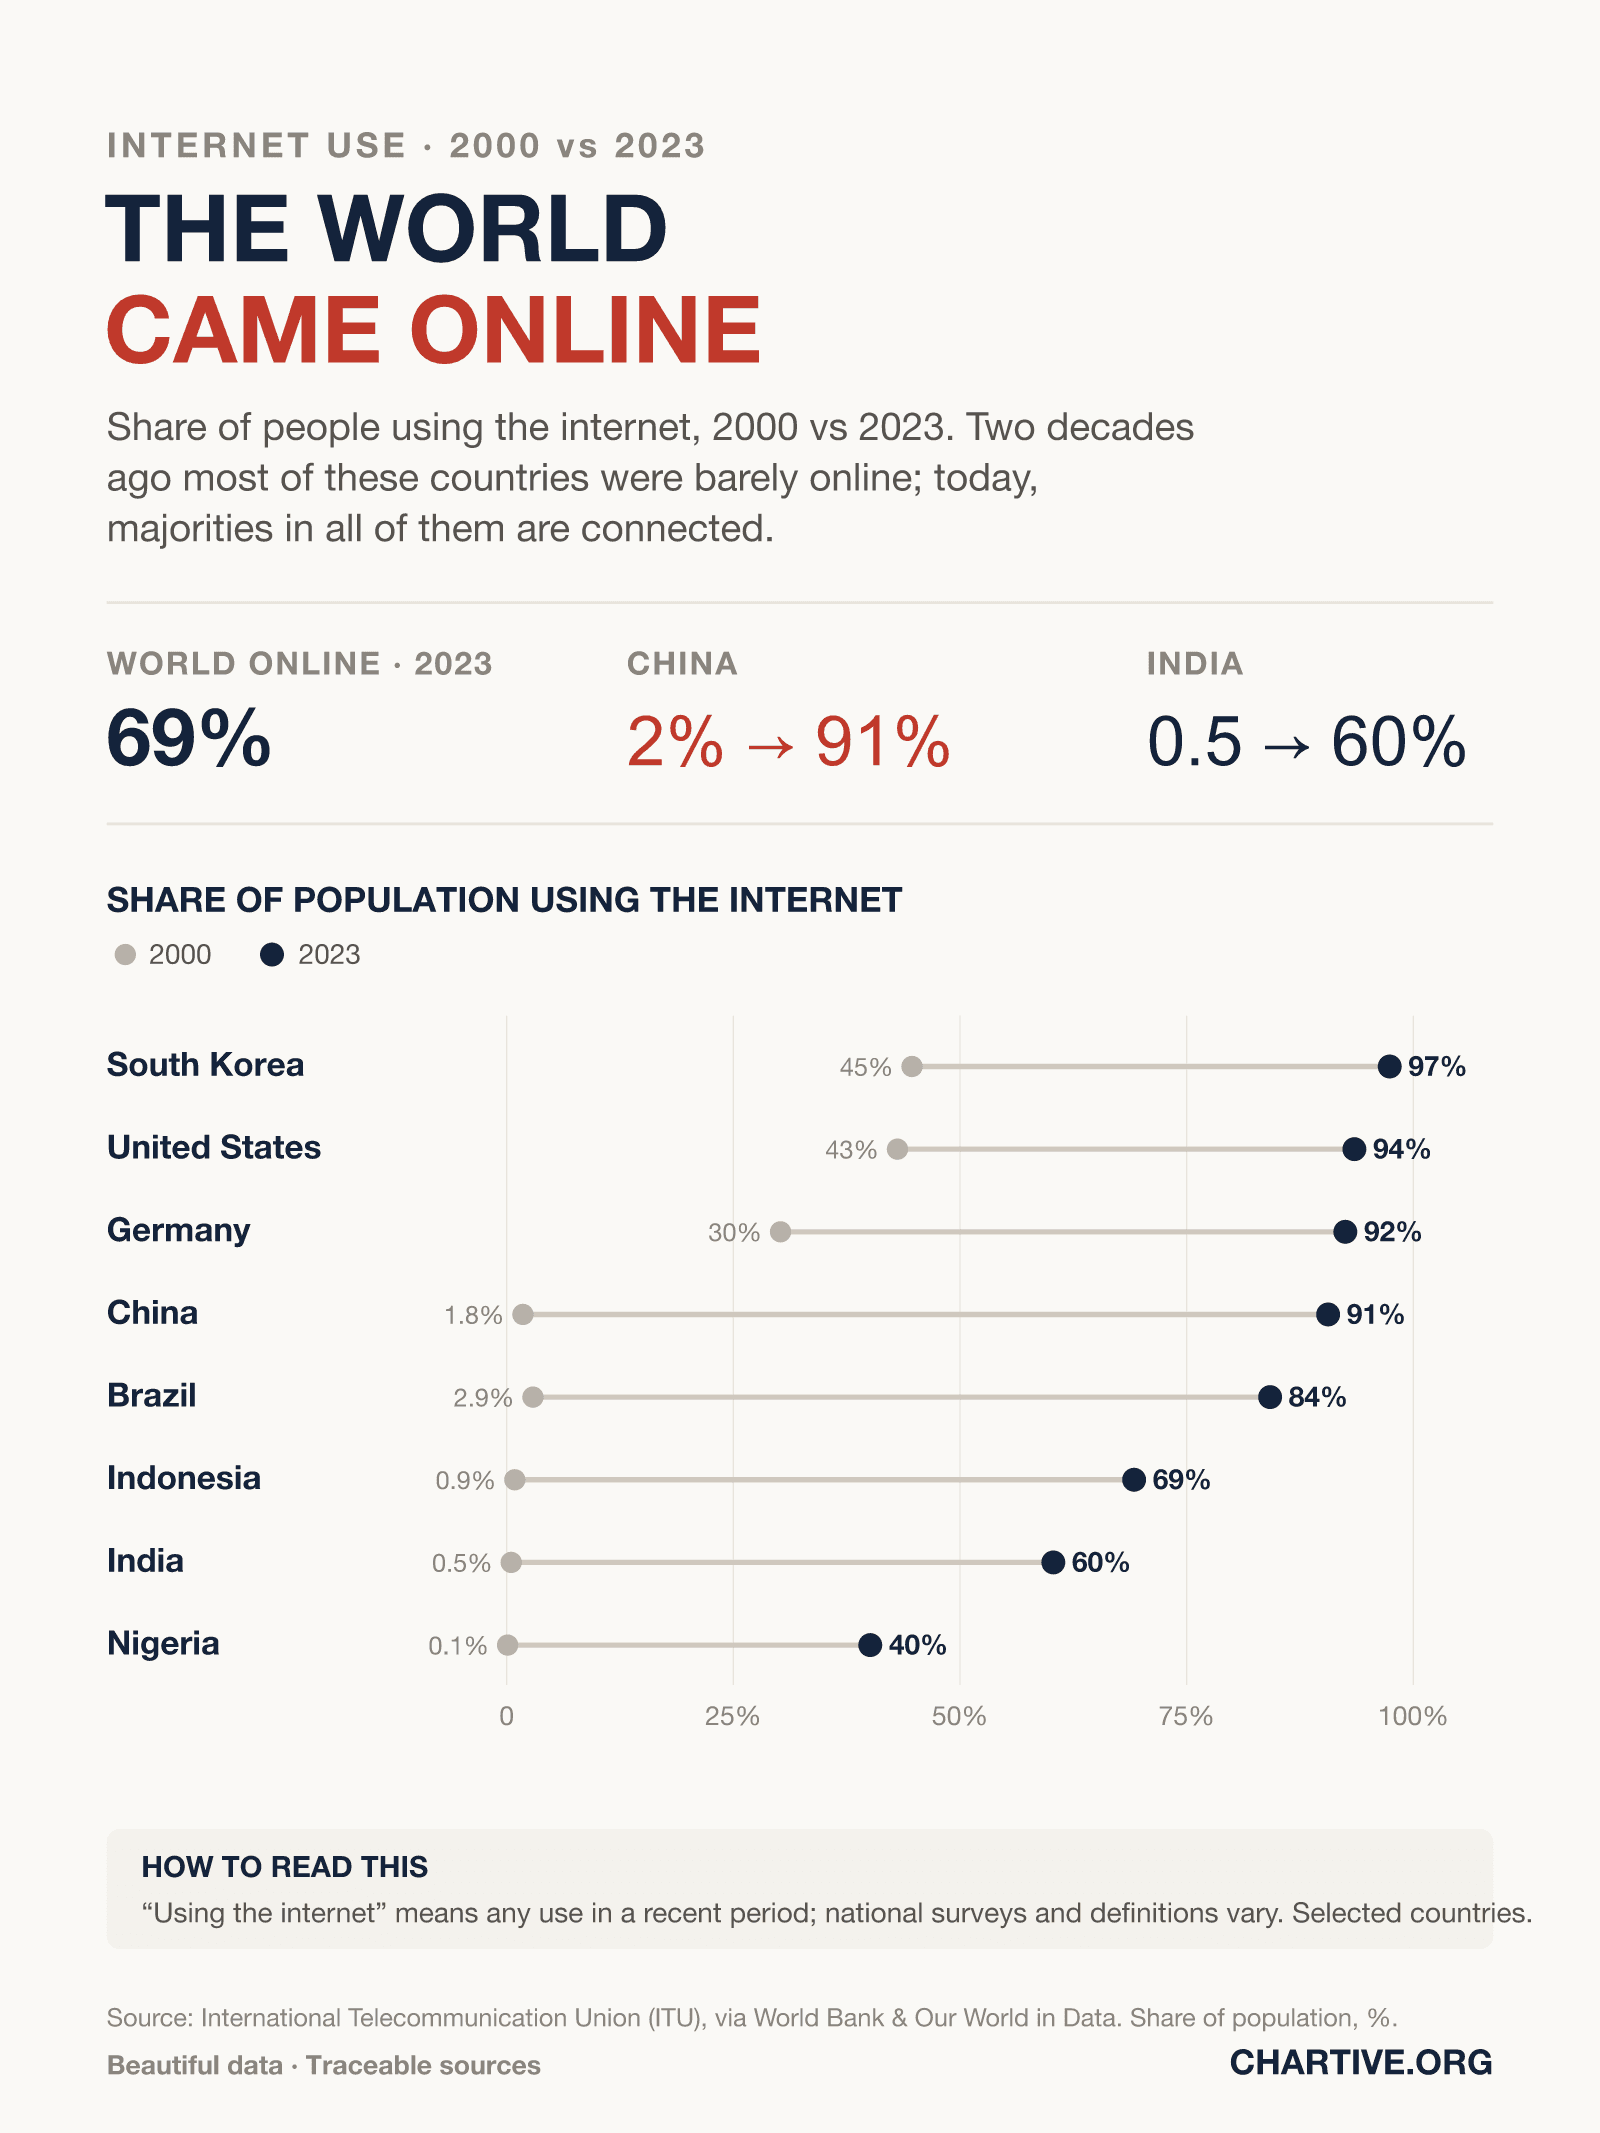
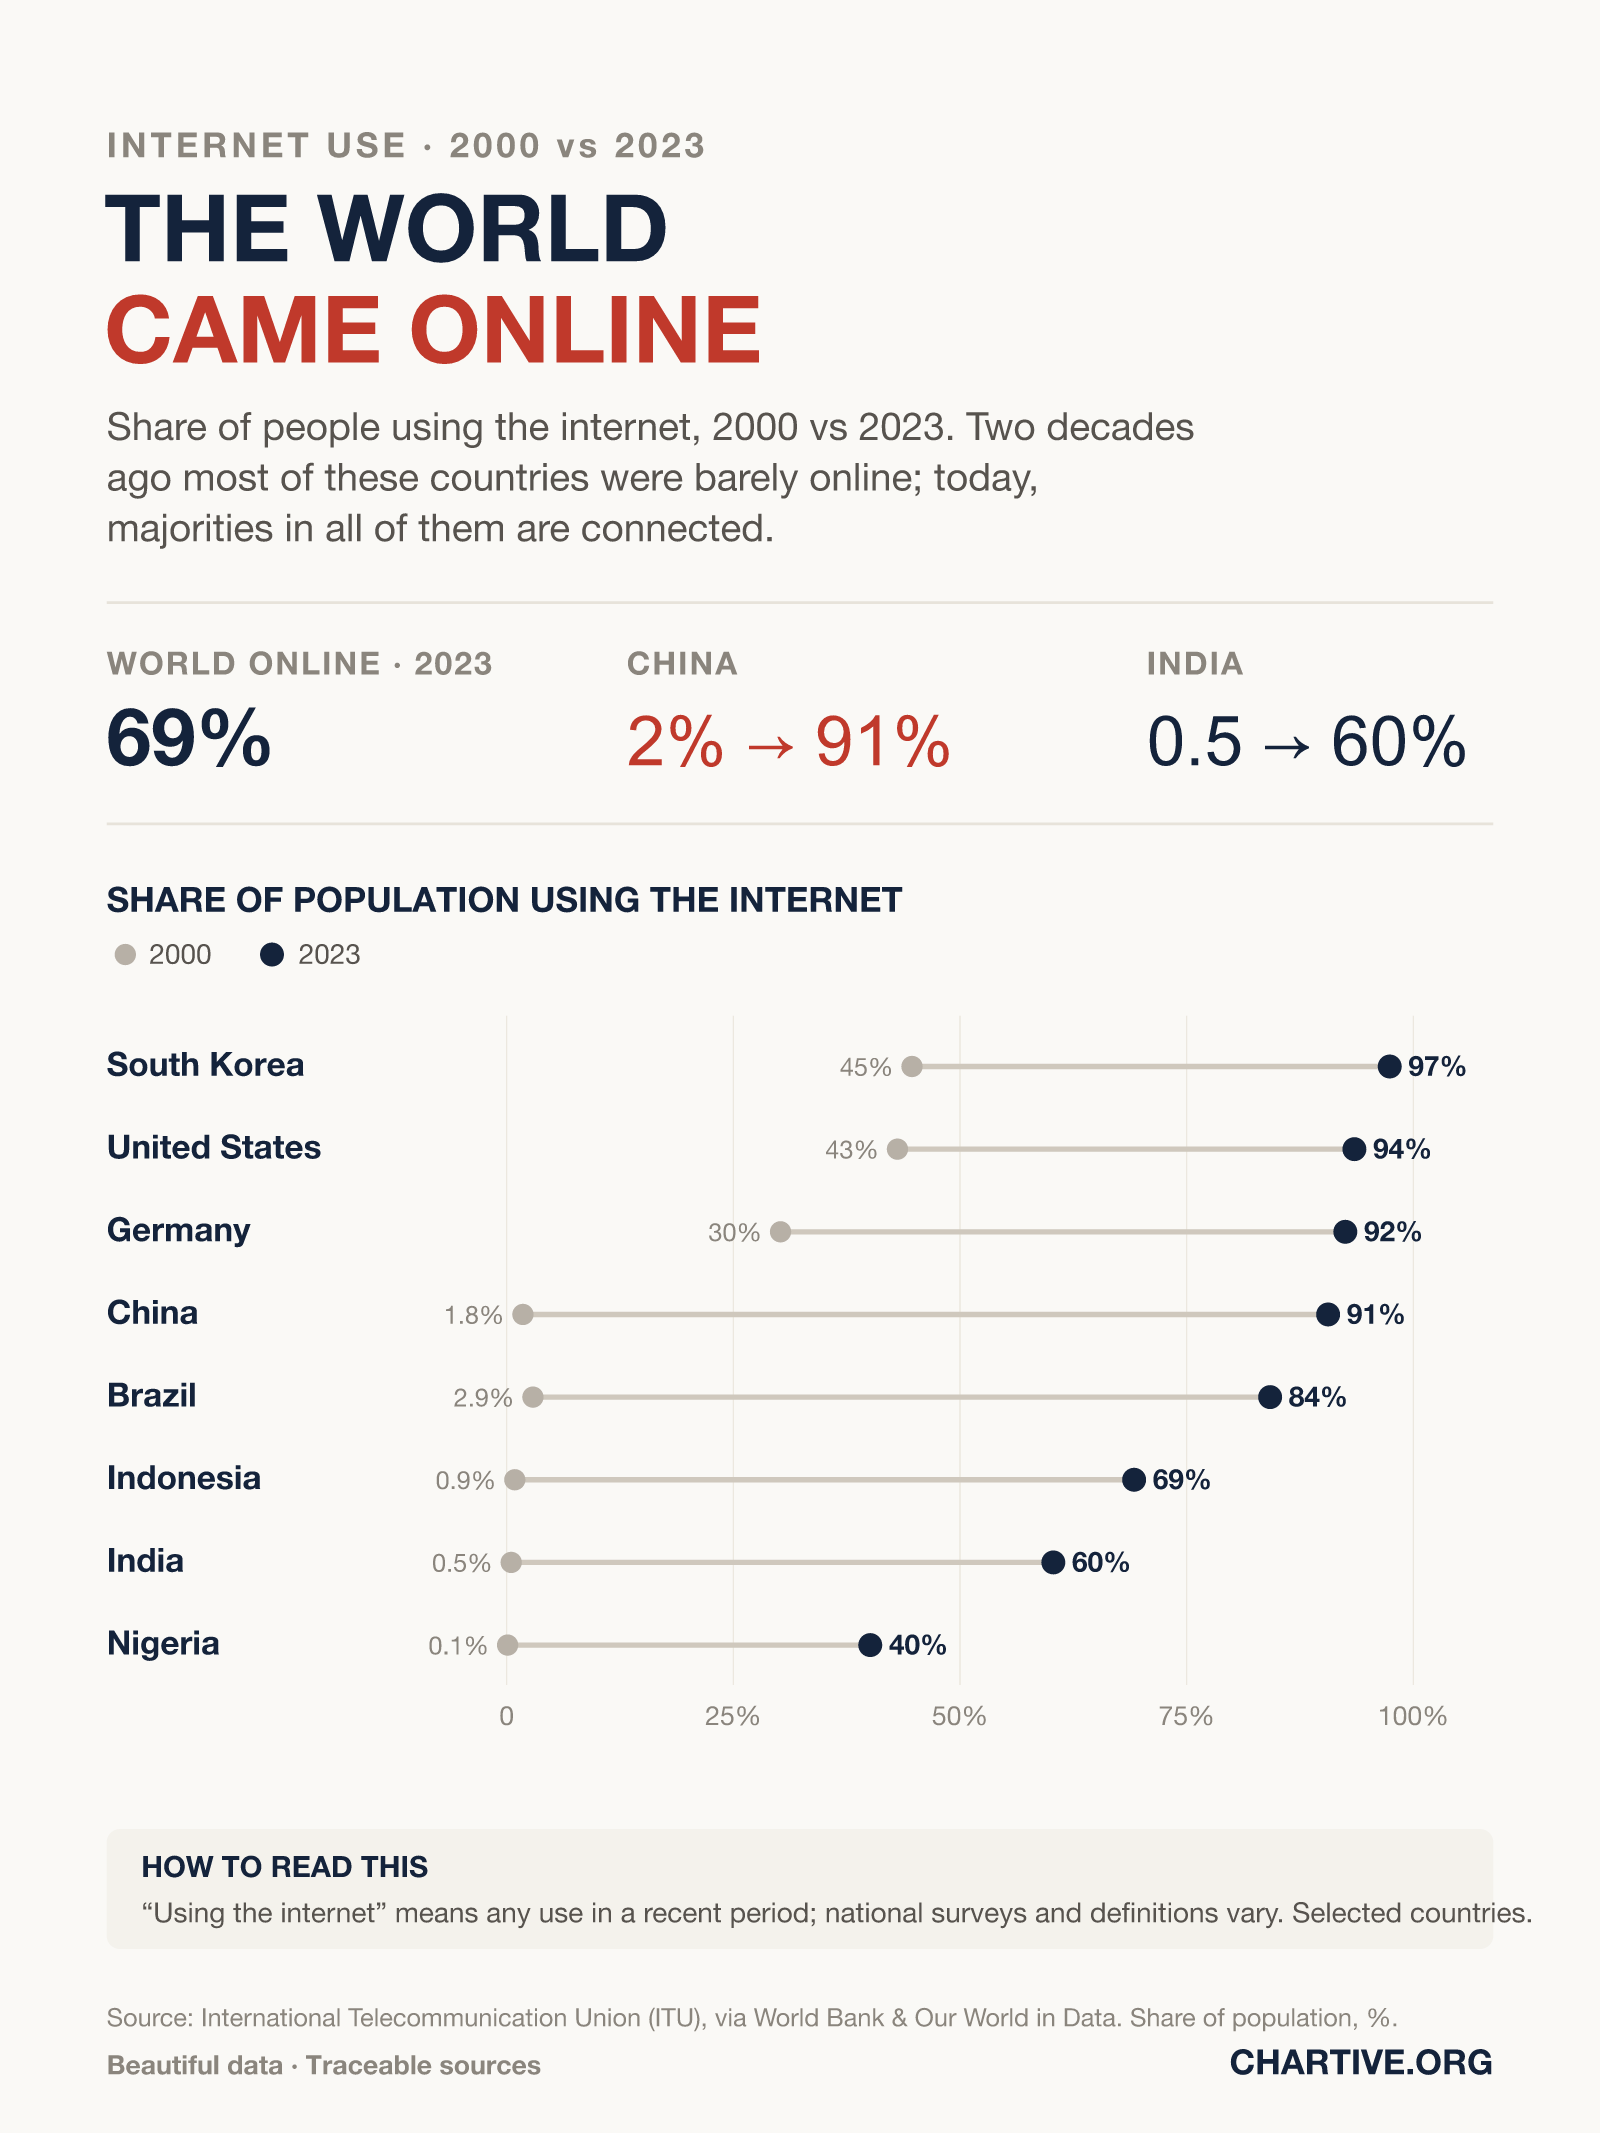
Share of people using the internet, 2000 vs 2023. Two decades ago most of these countries were barely online; today, majorities in all of them are connected.
CSV · 19 rows · 2000–2023
In 2000 only a rich-country minority was online — China 1.8%, India 0.5%, Nigeria 0.1%. By 2023 internet use had reached 60–97% in every one of these countries, and about 69% of the world.
Key findings
- In 2000, internet use was largely a rich-country phenomenon — 45% in South Korea and 43% in the U.S., versus under 3% in China, Brazil, India and Nigeria.
- By 2023, China had reached about 91% and Brazil 84%, while India (60%) and Nigeria (40%) had climbed from almost zero.
- About 69% of the world's population — more than two in three people — was online in 2023.
Explore the data
Coverage: Jan 1, 2000 – Dec 31, 2023 · Selected countries
Free to download and reuse. Get the data behind every new chart →
Sources
Primary source
International Telecommunication Union (ITU)
via World Bank & Our World in Data
Individuals using the Internet (% of population)
Accessed Aug 14, 2026
ITU World Telecommunication/ICT Indicators, distributed via the World Bank. Share of population, %.
Methodology
Share of the population using the internet, in percent, for 2000 and 2023 (the latest available year). Figures are from the International Telecommunication Union (ITU), distributed via the World Bank and Our World in Data. 'Using the internet' generally means any use over a recent period; national survey methods and definitions vary.
What this does not show
Internet-use figures are based on national surveys and estimates whose methods and definitions differ between countries and over time, so cross-country comparisons are approximate. The countries shown are a selection chosen to span income levels, not a comprehensive list.
Creator
Reuse this visualization
Cite this
License: CC BY 4.0
Embed code
<figure style="margin:0;max-width:1600px">
  <a href="https://chartive.org/visualizations/the-world-came-online-2000-2023" target="_blank" rel="noopener">
    <img src="https://chartive.org/infographics/world-internet-2000-2023.png" alt="Dumbbell chart comparing the share of people using the internet in 2000 and 2023 for eight countries: South Korea 45%→97%, United States 43%→94%, Germany 30%→92%, China 1.8%→91%, Brazil 2.9%→84%, Indonesia 0.9%→69%, India 0.5%→60%, Nigeria 0.1%→40%." width="1600" height="2133" style="max-width:100%;height:auto" />
  </a>
  <figcaption style="font:14px/1.4 system-ui,sans-serif;color:#57534e;margin-top:8px">
    Graphic by Daniel Okafor, using data from International Telecommunication Union (ITU) — via <a href="https://chartive.org/visualizations/the-world-came-online-2000-2023" target="_blank" rel="noopener">Chartive</a>
  </figcaption>
</figure>
Reuse is welcome — the embed keeps a link back to the source.