Economy
Verified dataYour great-great-great-grandparents worked twice the hours you do
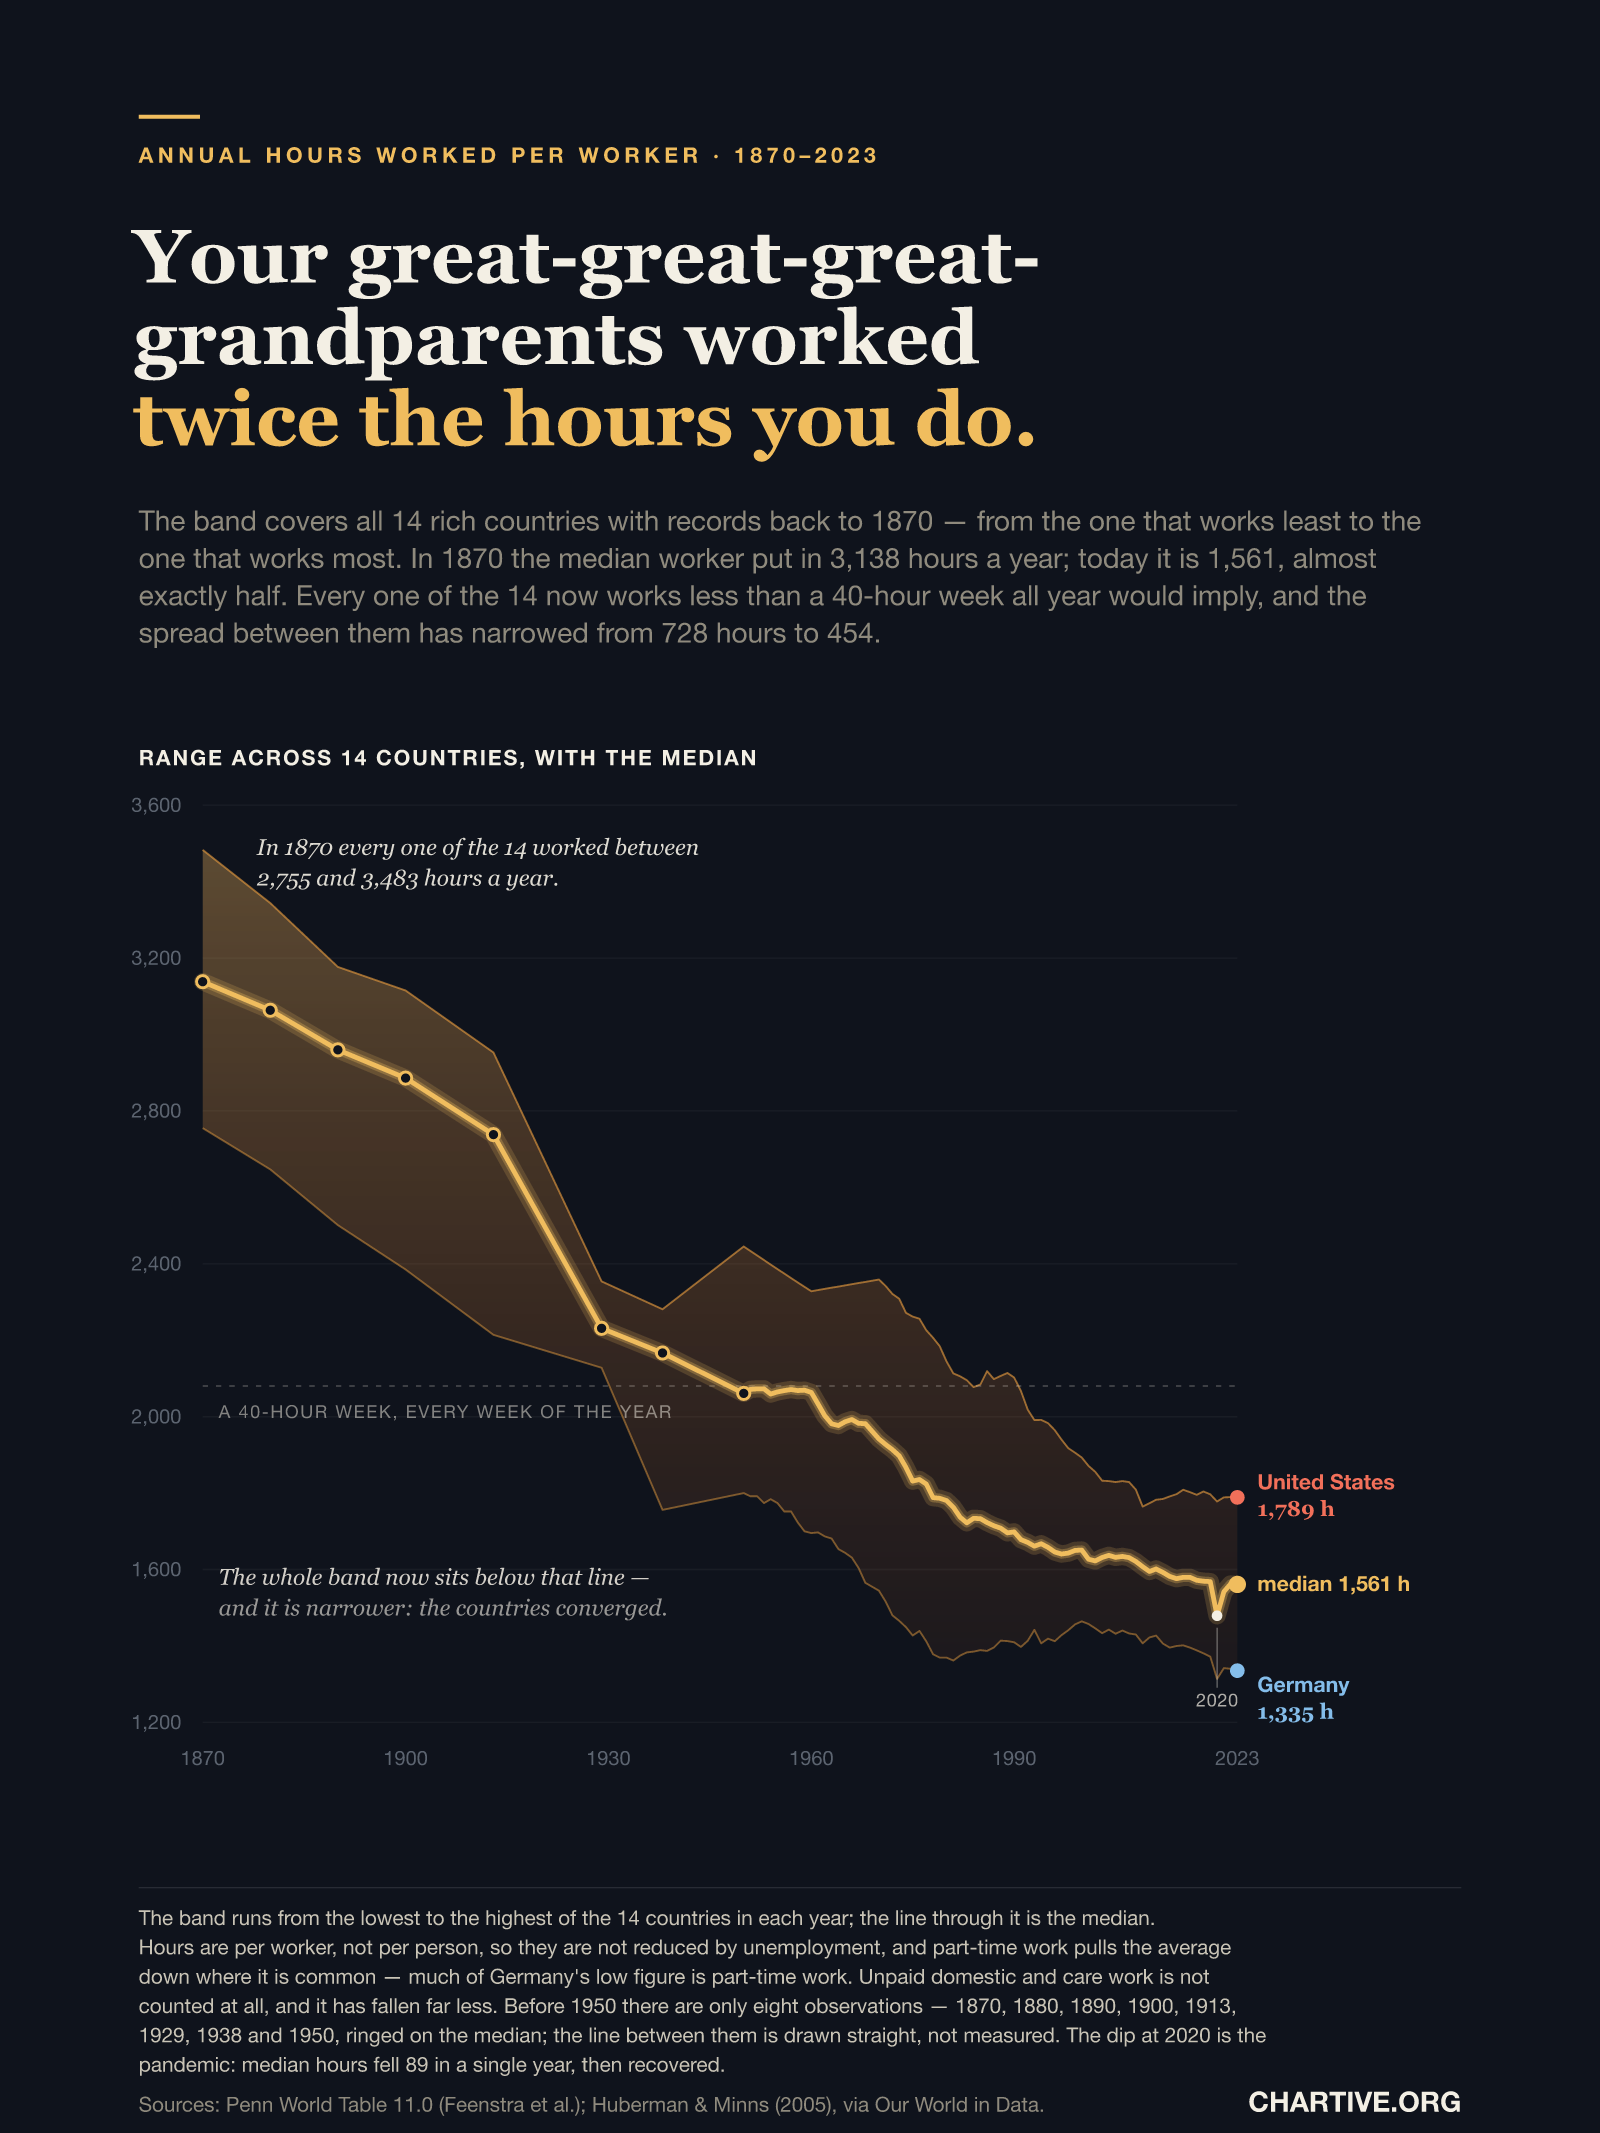
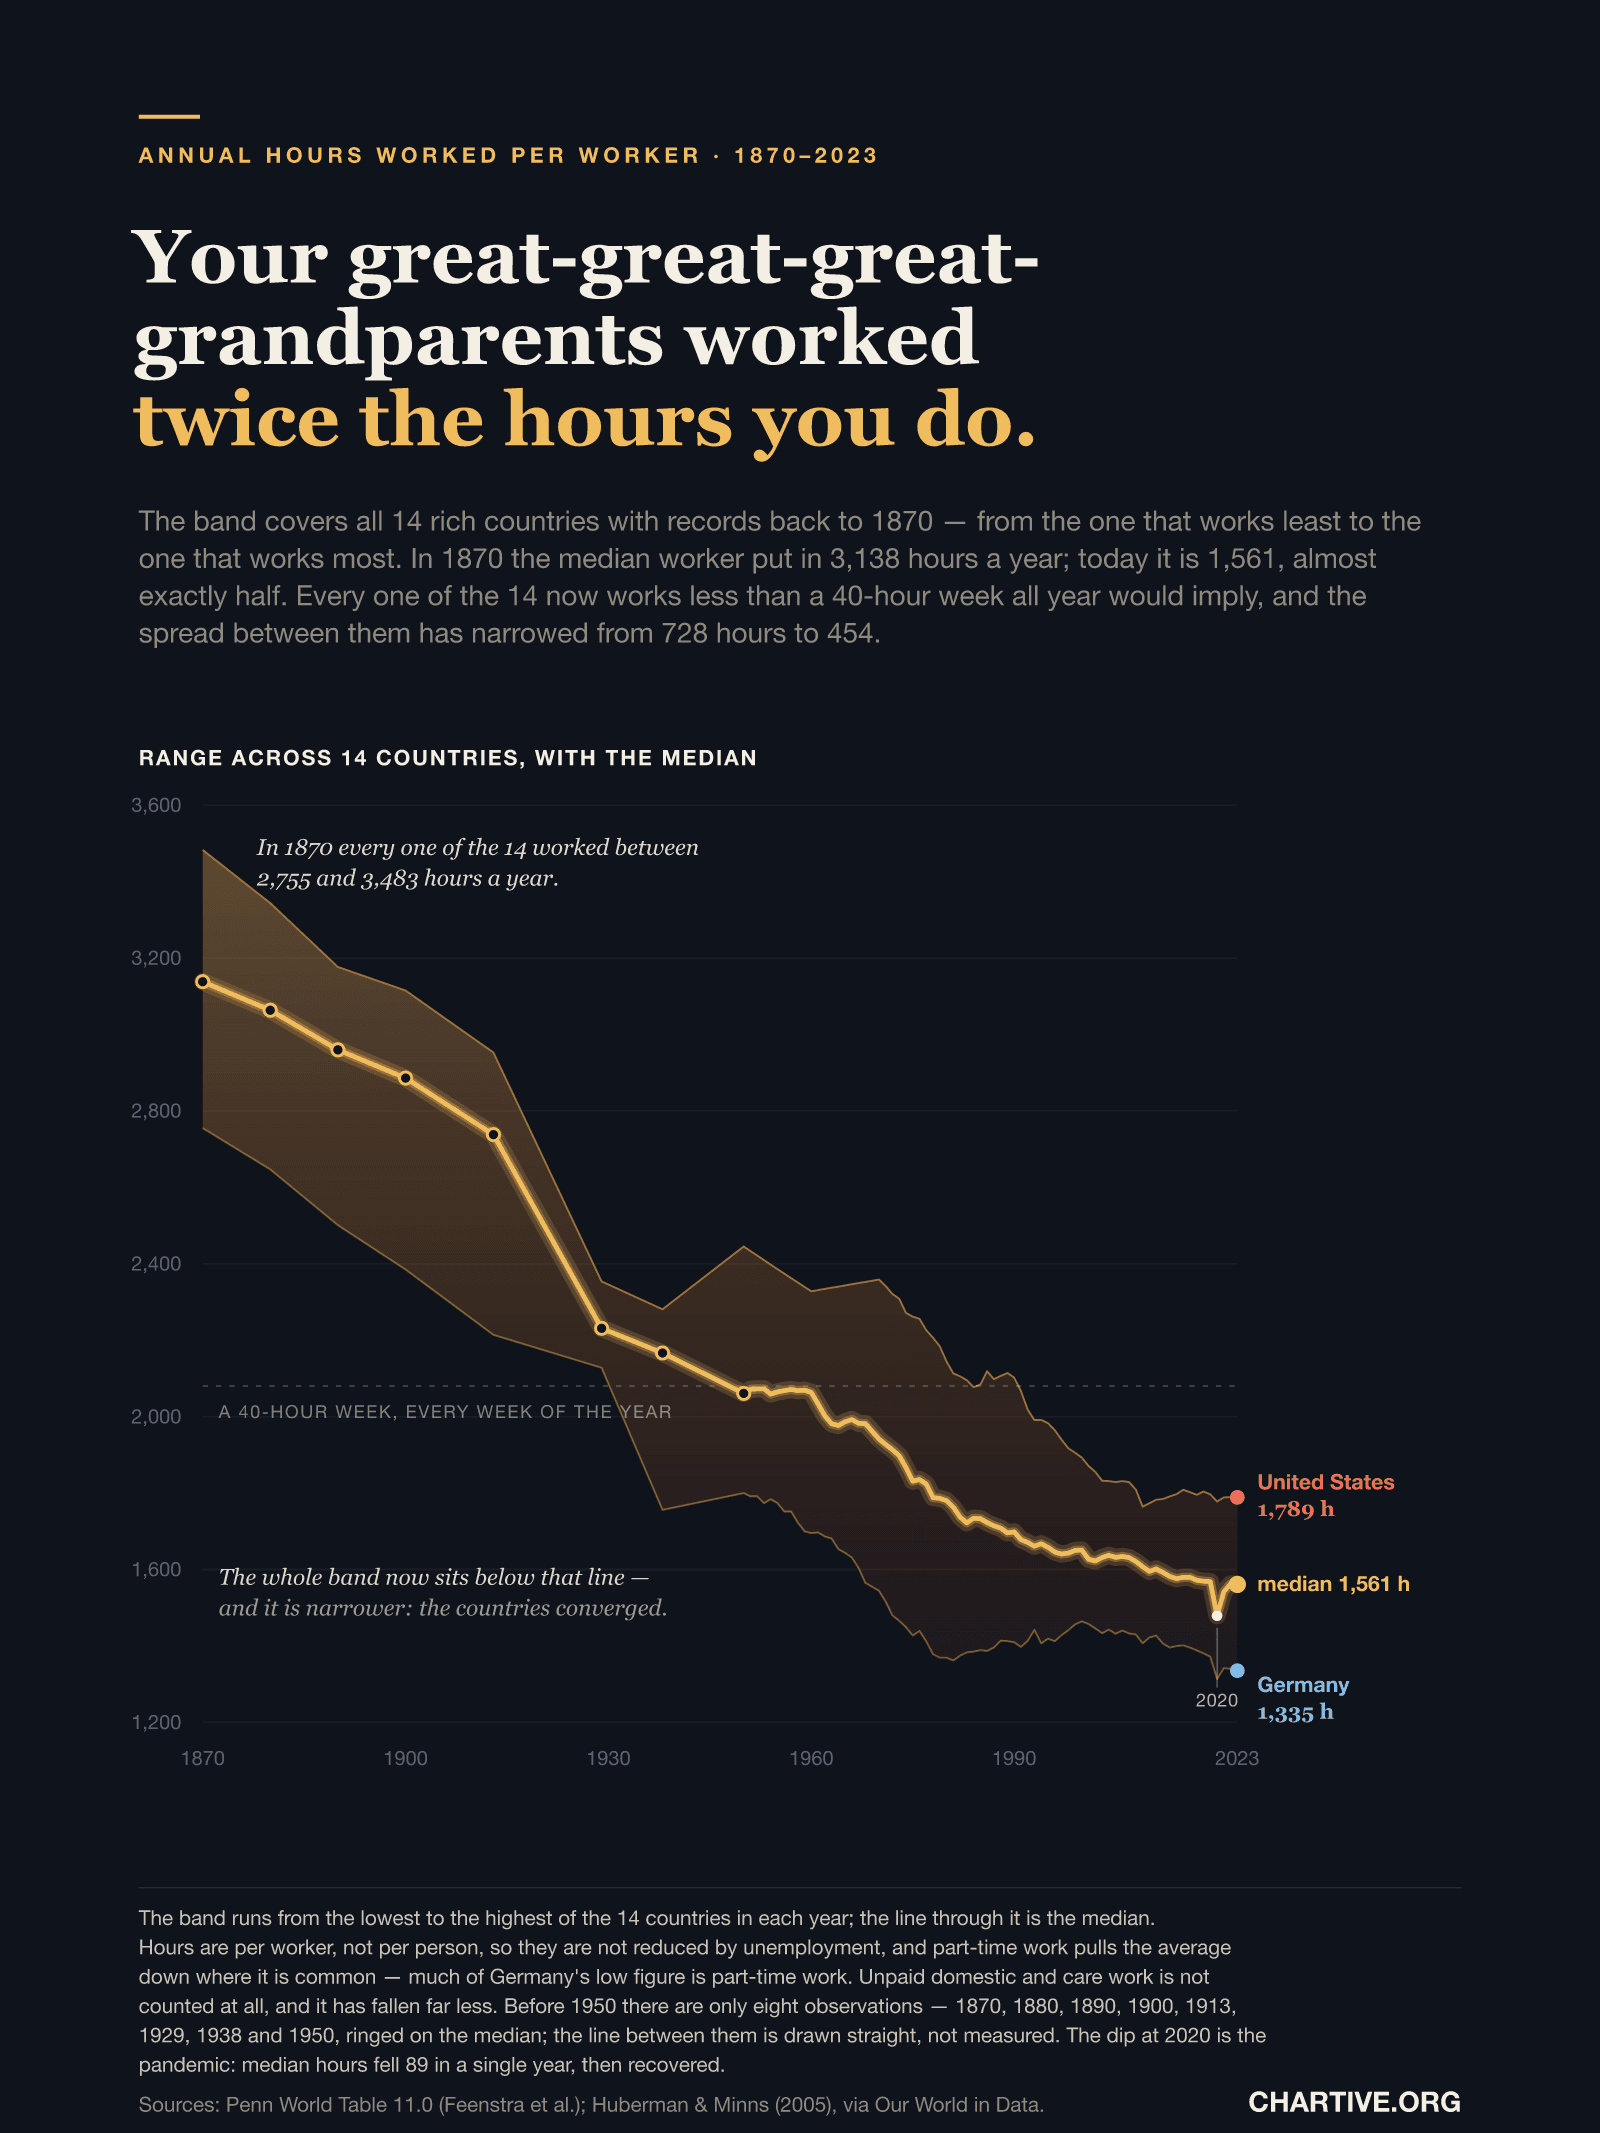
Across the 14 rich countries with records back to 1870, the median worker put in 3,138 hours a year. Today it is 1,561 — almost exactly half. Every one of them now works less than a 40-hour week all year would imply.
CSV · 81 rows · 1870–2023
Annual hours worked per worker have roughly halved since 1870 in every rich country with a long enough record. The median fell from 3,138 hours a year — around 60 hours a week with almost no holiday — to 1,561. The countries also converged: the spread between the hardest- and least-working of the 14 narrowed from 728 hours to 454. Germany now works least at 1,335 hours and the United States most at 1,789, a difference of eleven 40-hour weeks a year.
Key findings
- The median worker in these 14 countries put in 3,138 hours in 1870 and 1,561 in 2023 — a fall of 50%.
- In 1870 every one of the 14 worked between 2,755 and 3,483 hours a year, roughly 55 to 65 hours a week.
- Today all 14 work less than 2,080 hours, the equivalent of a 40-hour week every week of the year.
- The countries converged: the spread between highest and lowest narrowed from 728 hours to 454.
- Germany works least at 1,335 hours; the United States most at 1,789 — a gap of eleven 40-hour weeks.
- Germany fell furthest of all, from 3,284 hours to 1,335, a cut of 59%.
- The pandemic shows up clearly: median hours dropped 89 in 2020, then recovered within two years.
Explore the data
Coverage: Jan 1, 1870 – Dec 31, 2023 · 14 high-income countries
Free to download and reuse. Get the data behind every new chart →
Sources
Primary source
Penn World Table 11.0
Feenstra, Inklaar and Timmer, via Our World in Data
Annual hours worked per worker, modern period
Accessed Sep 6, 2026
Provides the post-war series. Combined by Our World in Data with the historical reconstruction below.
Primary source
Huberman and Minns (2005)
Explorations in Economic History, via Our World in Data
The times they are not changin': days and hours of work in Old and New Worlds, 1870–2000
Accessed Sep 6, 2026
Provides the historical observations for 1870, 1880, 1890, 1900, 1913, 1929, 1938 and 1950.
Methodology
The band spans the lowest and highest of the 14 countries in each year and the line through it is the median of all 14. Only countries with a continuous series from 1870 to 2023 are included: Australia, Belgium, Canada, Denmark, France, Germany, Ireland, Italy, Netherlands, Spain, Sweden, Switzerland, the United Kingdom and the United States — all classified as high income by the World Bank. The year 1969 is omitted because the Netherlands has no observation, which would make the band inconsistent. Before 1950 the underlying data has only eight observations — 1870, 1880, 1890, 1900, 1913, 1929, 1938 and 1950 — and these are ringed on the median line; the segments between them are drawn straight rather than measured. The reference line at 2,080 hours is a 40-hour week for all 52 weeks of the year.
What this does not show
Hours are per worker, not per person: they cover people in employment, so they are not reduced by unemployment, and where part-time work is common it pulls the average down — a substantial part of Germany's low figure is part-time work rather than shorter full-time weeks. Unpaid domestic and care work is not counted at all, and it has fallen far less than paid hours, so the chart understates total work and overstates the gain for the people who do most of that unpaid work. Nineteenth-century figures are historical reconstructions with real uncertainty. The series splices two sources that overlap around 1950, so some of the movement in the mid-twentieth century may reflect the join rather than reality; nothing is claimed about that period. The dip in 2020 is the pandemic: median hours fell 89 in one year and then recovered.
Creator
Reuse this visualization
Cite this
License: CC BY 4.0
Embed code
<figure style="margin:0;max-width:1600px">
  <a href="https://chartive.org/visualizations/working-hours-1870-2023" target="_blank" rel="noopener">
    <img src="https://chartive.org/infographics/working-hours-1870-2023.png" alt="Range chart of annual hours worked per worker from 1870 to 2023 across 14 rich countries. A shaded band runs from the lowest to the highest country each year, descending from 2,755–3,483 hours in 1870 to 1,335–1,789 in 2023, and narrowing as it falls. A gold median line runs through it from 3,138 to 1,561 hours, with rings marking the eight observations before 1950. A dashed reference line at 2,080 hours marks a 40-hour week all year; the entire band sits below it from the 1970s on. A dip at 2020 is labelled. The United States ends highest at 1,789 hours and Germany lowest at 1,335." width="1600" height="2133" style="max-width:100%;height:auto" />
  </a>
  <figcaption style="font:14px/1.4 system-ui,sans-serif;color:#57534e;margin-top:8px">
    Graphic by Chartive Editorial, using data from Penn World Table 11.0 — via <a href="https://chartive.org/visualizations/working-hours-1870-2023" target="_blank" rel="noopener">Chartive</a>
  </figcaption>
</figure>
Reuse is welcome — the embed keeps a link back to the source.