Economy
Verified dataCEOs out-earn workers 325 to 1
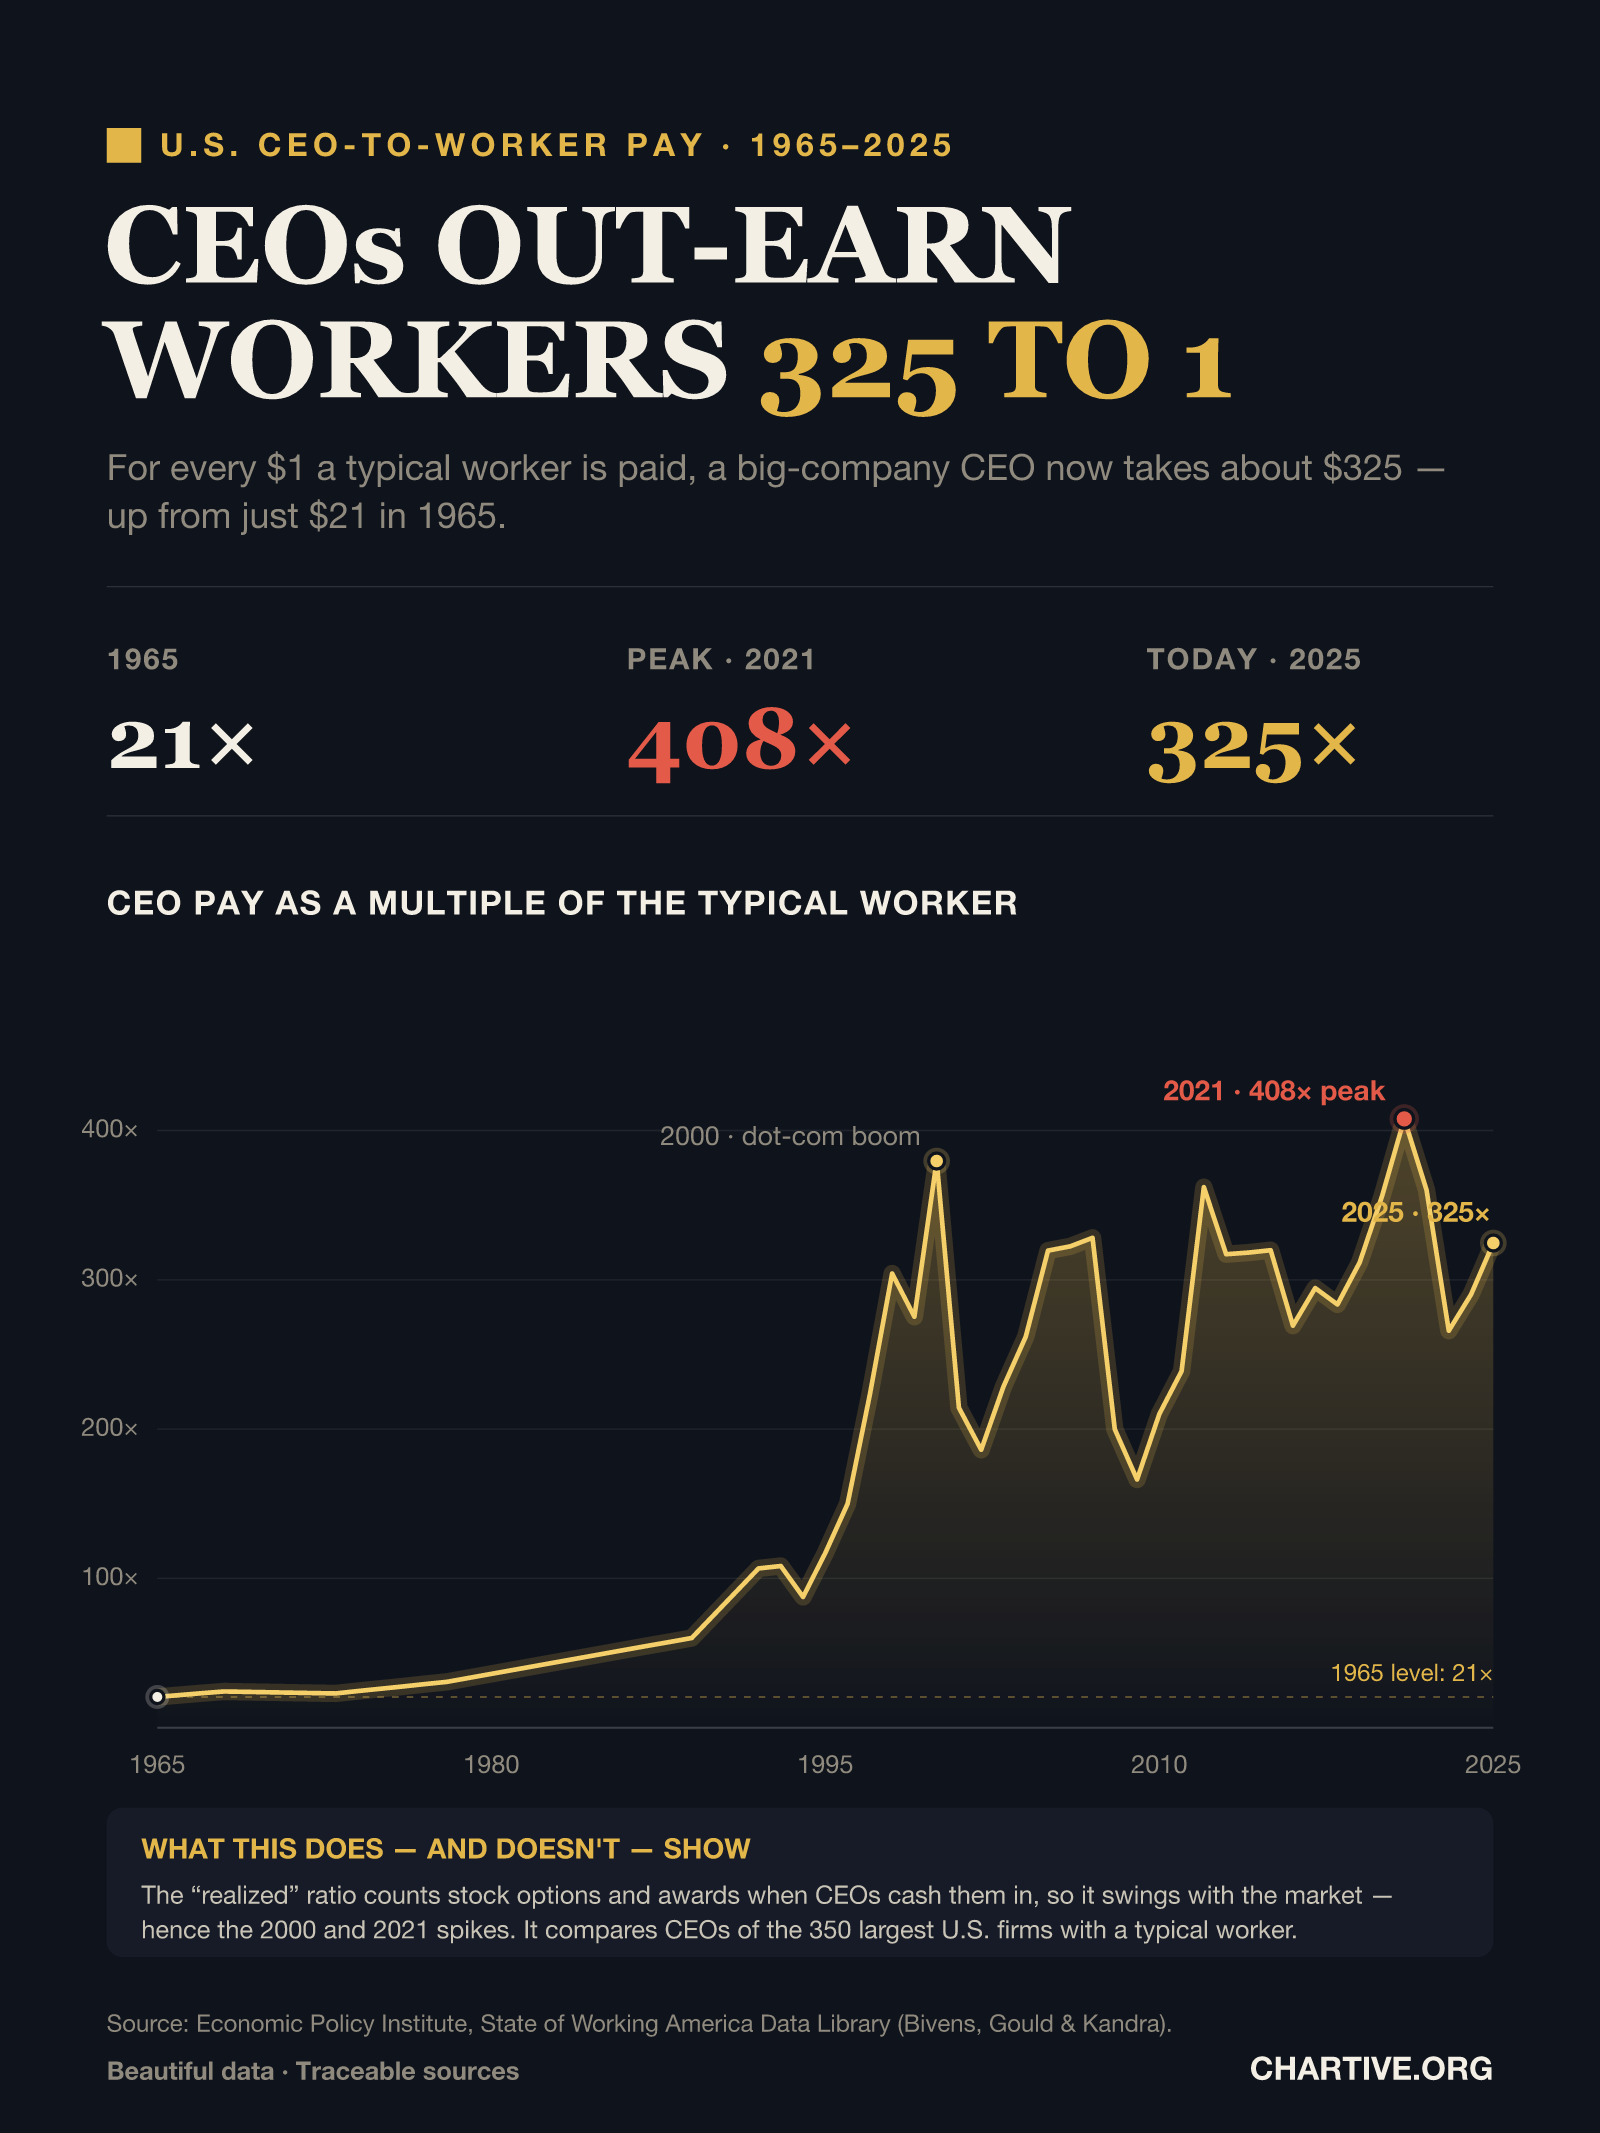
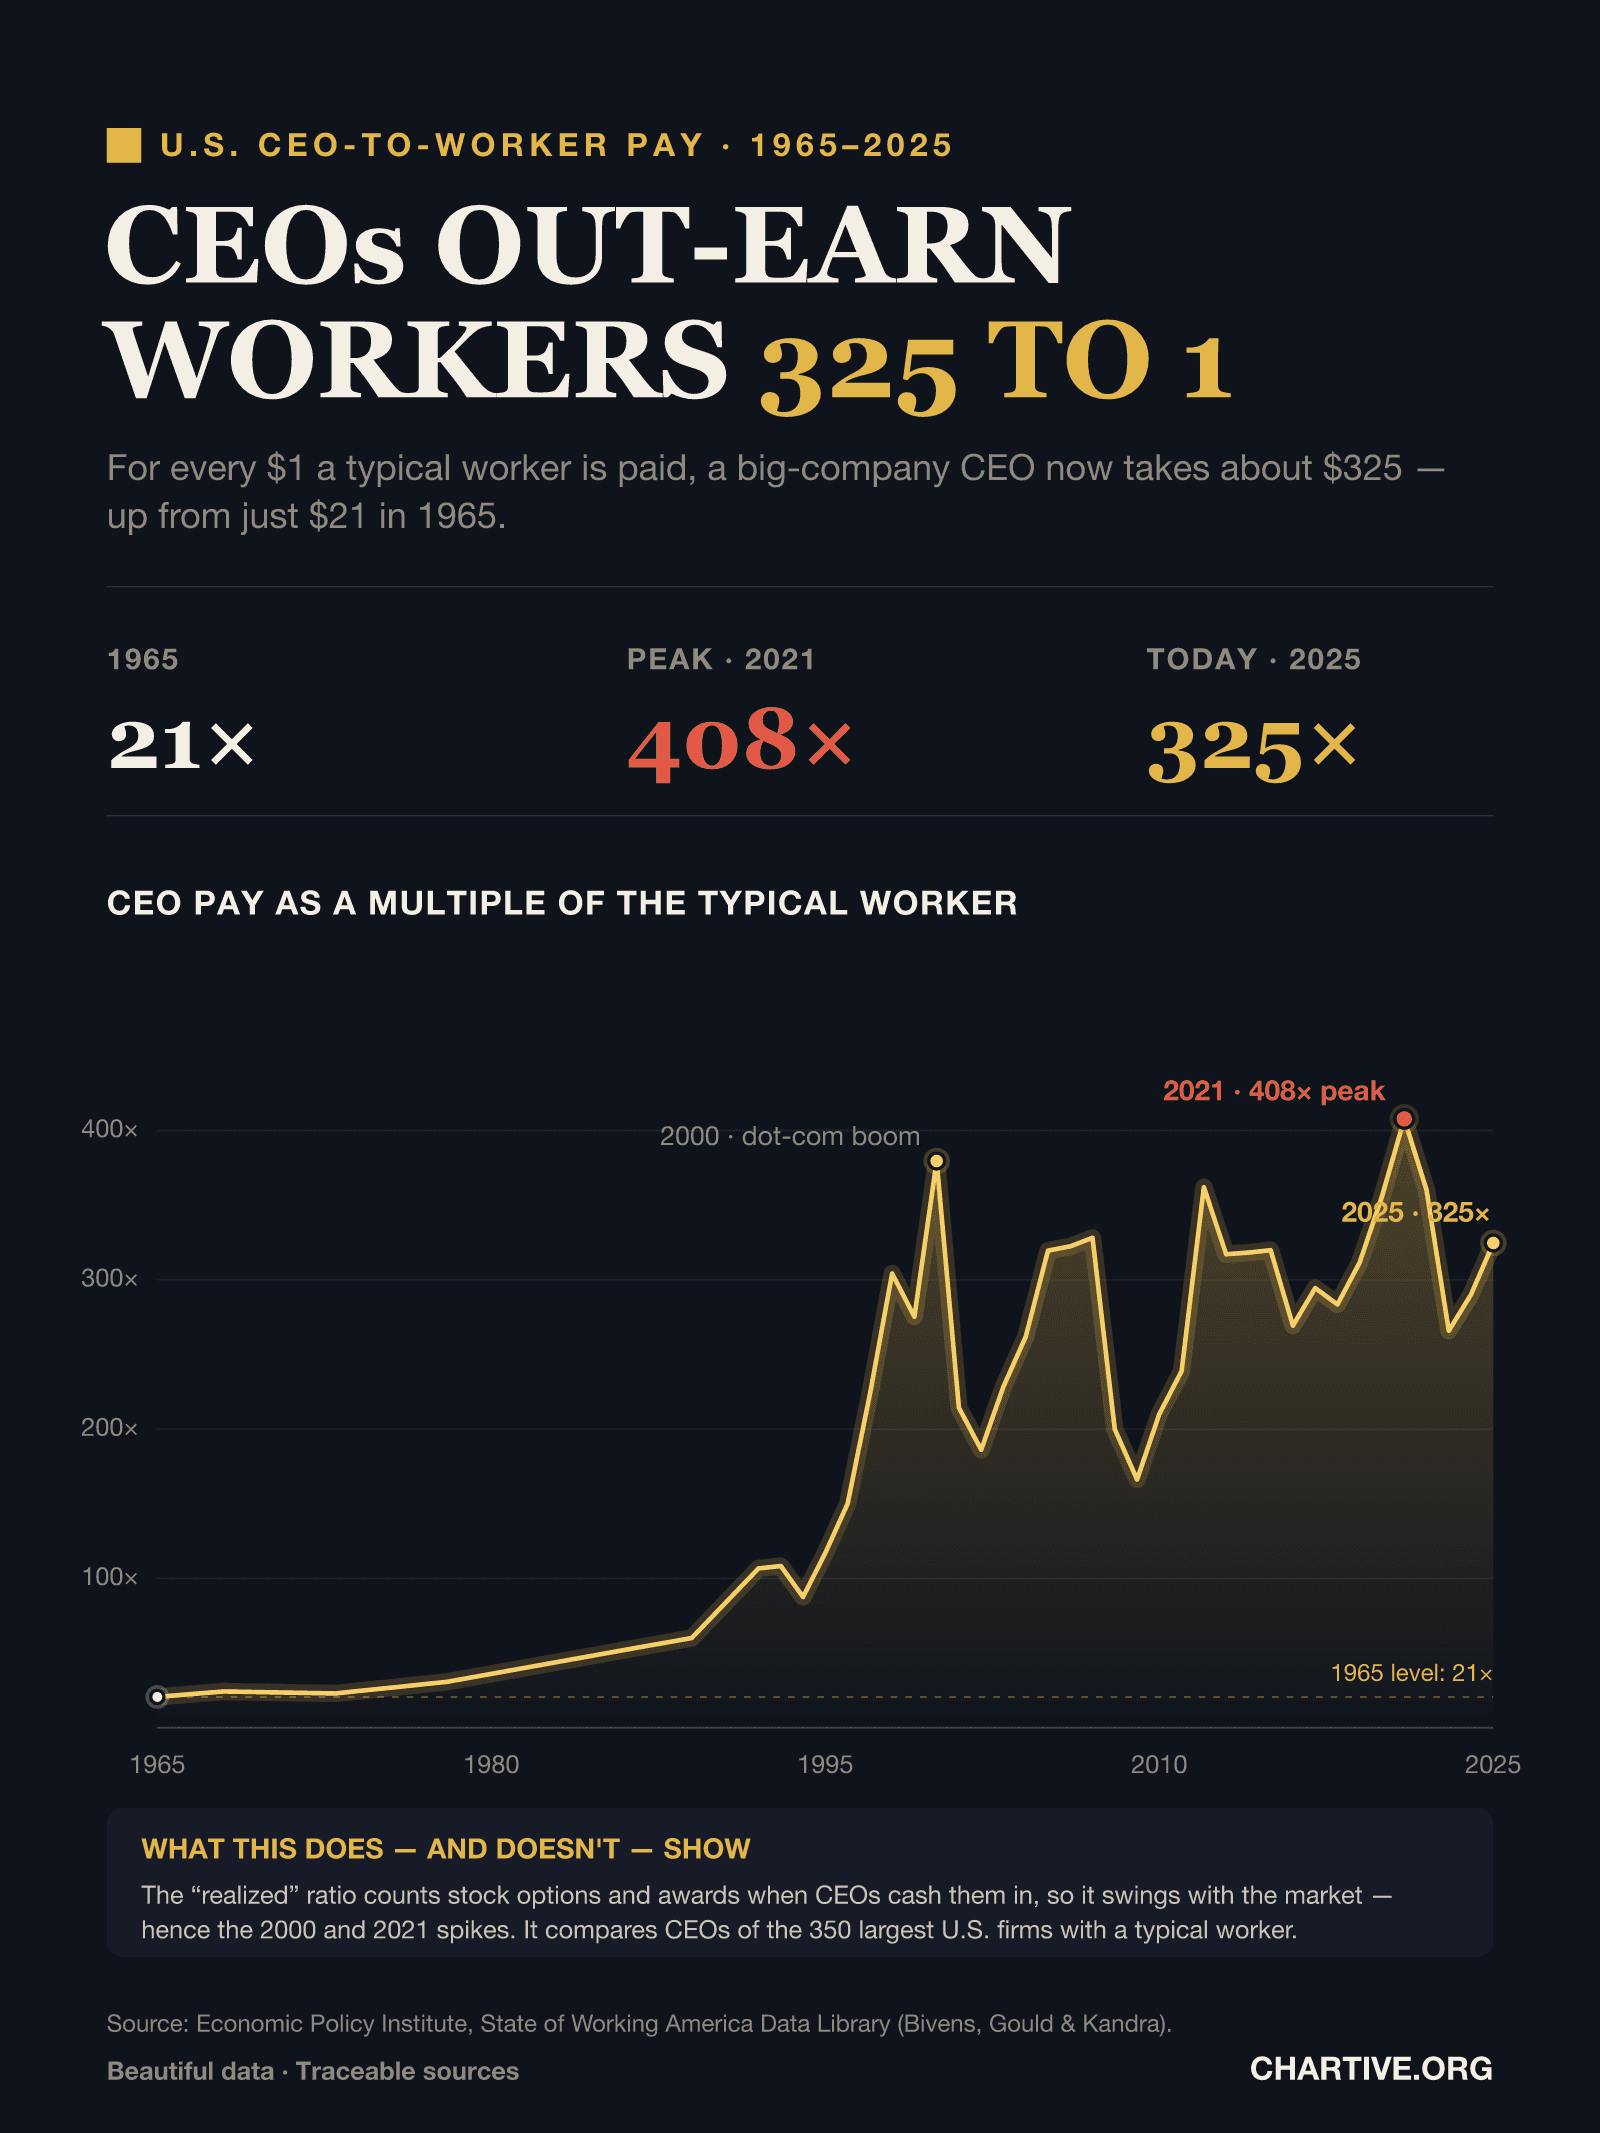
How many times more the average big-company CEO is paid than a typical U.S. worker — up from about 21-to-1 in 1965 to roughly 325-to-1 in 2025, after peaking at 408-to-1 in 2021.
CSV · 61 rows · 1965–2025
The realized pay of top U.S. CEOs has climbed from about 21 times a typical worker's in 1965 to roughly 325 times in 2025, peaking at 408-to-1 in 2021. Because the measure counts stock options when cashed in, it swings with the market.
Key findings
- Top U.S. CEOs were paid about 21 times a typical worker in 1965; by 2025 it was roughly 325 times.
- The ratio hit an all-time high of 408-to-1 in 2021 as stock-based pay surged.
- Because it counts stock options when cashed in, the ratio swings with the market — dipping to 166-to-1 in 2009.
Explore the data
Coverage: Jan 1, 1965 – Dec 31, 2025 · United States
Free to download and reuse. Get the data behind every new chart →
Sources
Primary source
Economic Policy Institute
State of Working America Data Library
CEO-to-worker pay ratio (realized)
Accessed Aug 22, 2026
Realized CEO-to-worker compensation ratio, 350 largest U.S. firms, 1965–2025 (Bivens, Gould & Kandra).
Methodology
The “realized” CEO-to-worker compensation ratio: average compensation of CEOs at the 350 largest U.S. firms (salary, bonuses, and stock options and awards valued when cashed in or vested) divided by the average compensation of a typical worker in those firms' industries. Data are from the Economic Policy Institute's State of Working America Data Library (Bivens, Gould & Kandra).
What this does not show
This is the “realized” ratio, which counts stock options and awards when CEOs cash them in, so it rises and falls with the stock market — hence the 2000 and 2021 spikes. It reflects the 350 largest U.S. firms, not all companies. A separate “granted” measure, valuing awards when issued, is smoother and somewhat lower.
Creator
Reuse this visualization
Cite this
License: CC BY 4.0
Embed code
<figure style="margin:0;max-width:1600px">
  <a href="https://chartive.org/visualizations/ceo-worker-pay-ratio-1965-2025" target="_blank" rel="noopener">
    <img src="https://chartive.org/infographics/ceo-worker-pay-ratio-1965-2025.png" alt="Area chart of the realized CEO-to-worker pay ratio in the U.S. from 1965 to 2025, rising from 21-to-1 to about 325-to-1, with spikes to 380 in 2000 and an all-time 408 in 2021 and a dip to 166 in 2009." width="1600" height="2133" style="max-width:100%;height:auto" />
  </a>
  <figcaption style="font:14px/1.4 system-ui,sans-serif;color:#57534e;margin-top:8px">
    Graphic by Chartive Editorial, using data from Economic Policy Institute — via <a href="https://chartive.org/visualizations/ceo-worker-pay-ratio-1965-2025" target="_blank" rel="noopener">Chartive</a>
  </figcaption>
</figure>
Reuse is welcome — the embed keeps a link back to the source.