Climate
Verified dataOne in four new cars is now electric
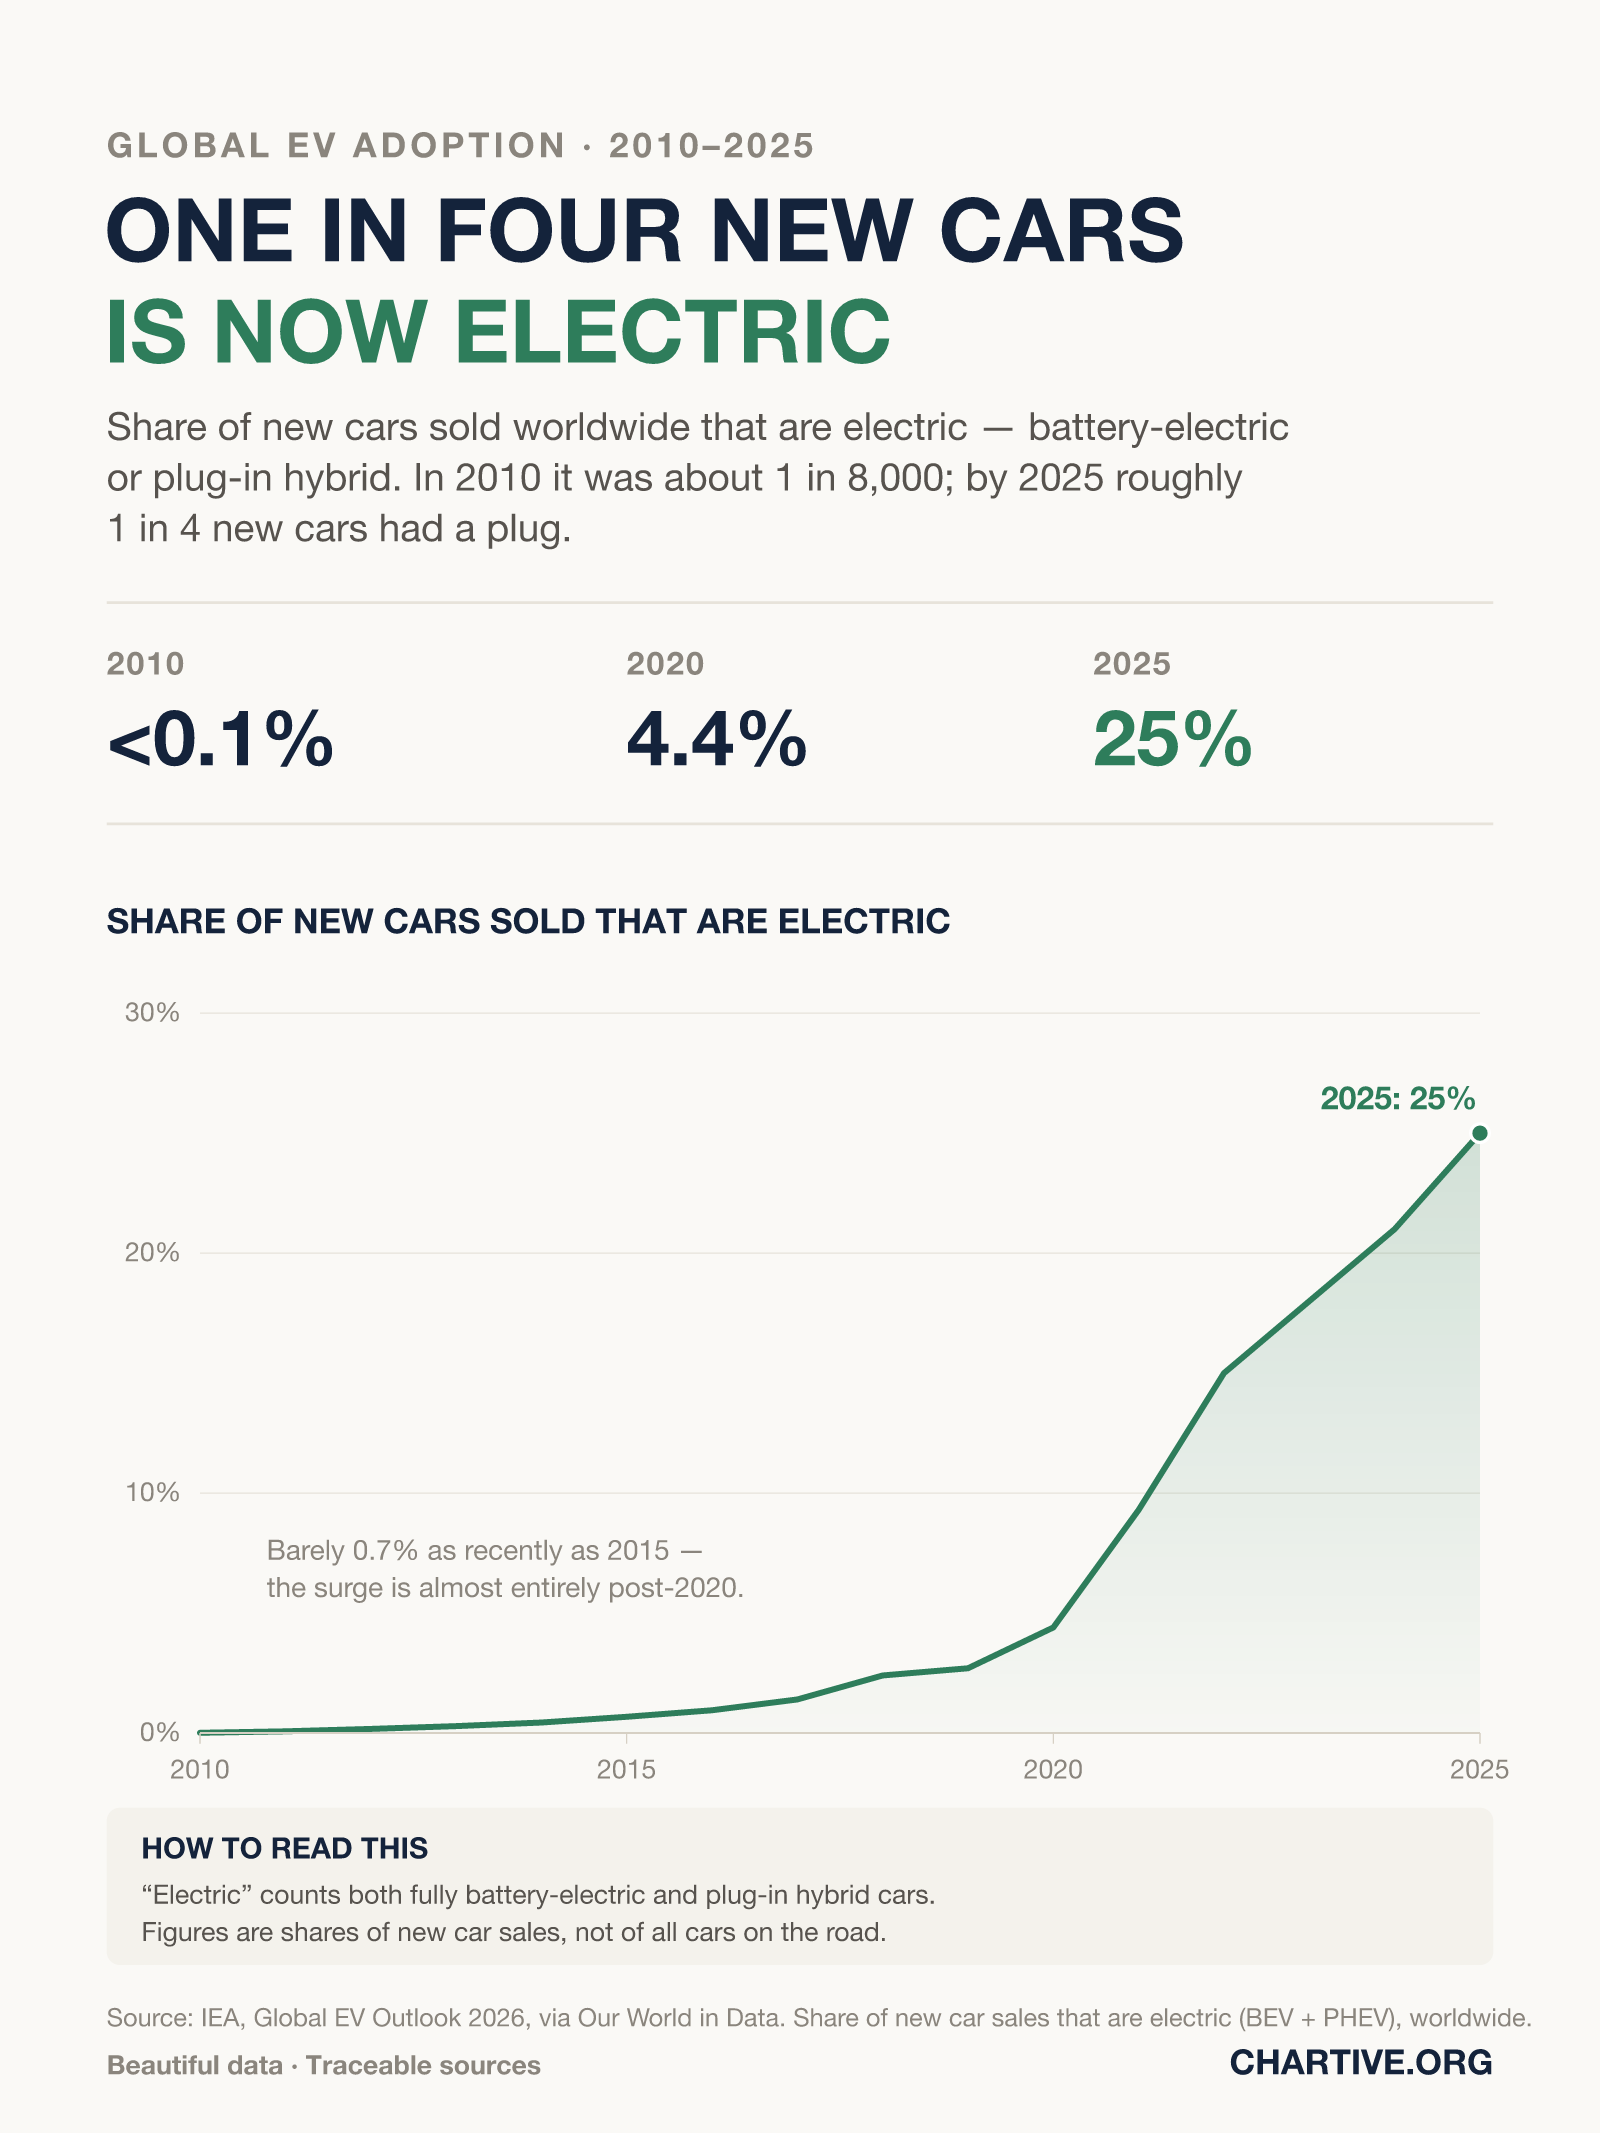
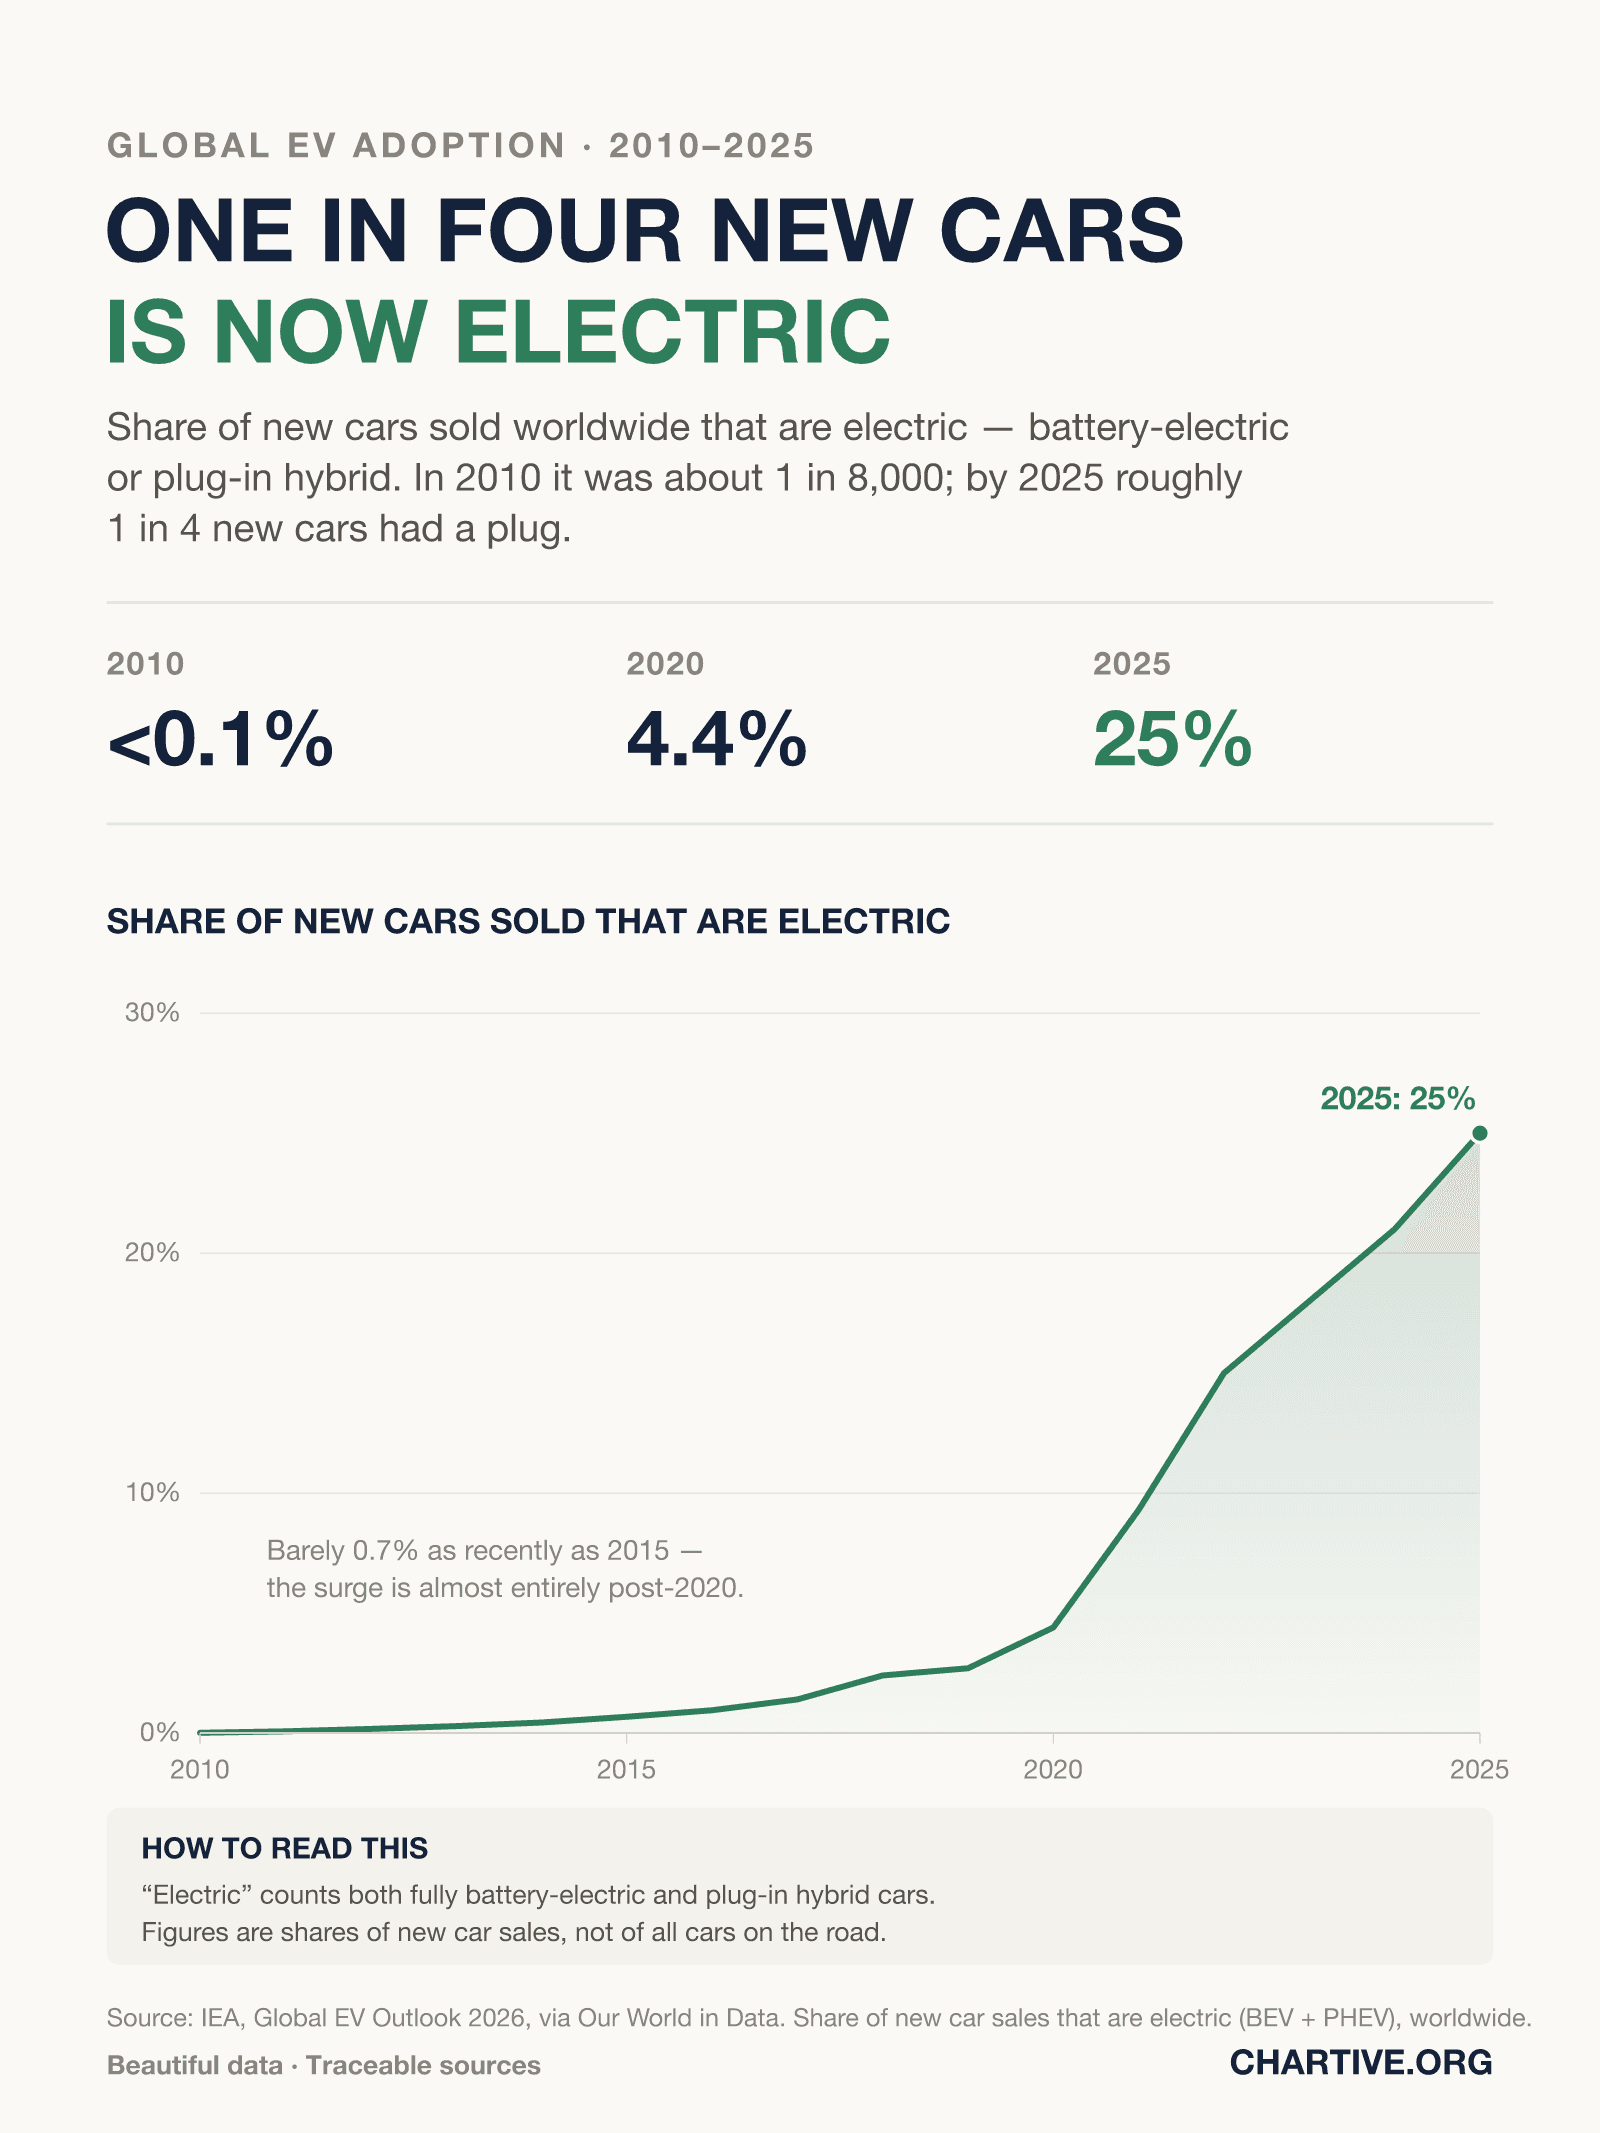
Share of new cars sold worldwide that are electric — battery-electric or plug-in hybrid. In 2010 it was about 1 in 8,000; by 2025 roughly one in four new cars had a plug.
CSV · 817 rows · 2010–2025
The electric share of new car sales worldwide rose from under 0.1% in 2010 to about 25% in 2025 — roughly one in four — with almost all of the growth coming after 2020.
Key findings
- In 2010 about 1 in 8,000 new cars was electric; by 2025 it was roughly 1 in 4.
- As recently as 2015 the electric share was just 0.7% — the surge is almost entirely post-2020.
- The figure combines battery-electric and plug-in hybrid cars; battery-electric alone is somewhat lower.
Explore the data
Coverage: Jan 1, 2010 – Dec 31, 2025 · World
Free to download and reuse. Get the data behind every new chart →
Sources
Primary source
IEA, Global EV Outlook 2026
via Our World in Data
Share of new cars that are electric
Accessed Aug 22, 2026
Share of new car sales that are electric (BEV + PHEV), worldwide, 2010–2025.
Methodology
Share of new passenger-car sales that are electric — battery-electric vehicles (BEV) plus plug-in hybrids (PHEV) — worldwide, 2010 to 2025. Data are from the IEA's Global EV Outlook 2026, distributed via Our World in Data.
What this does not show
“Electric” here counts both fully battery-electric and plug-in hybrid cars; counting only fully electric cars would give a lower share. Figures are shares of new-car sales in each year, not the share of all cars on the road, which changes far more slowly as the existing fleet turns over. The 2025 figure comes from the IEA's 2026 edition.
Creator
Reuse this visualization
Cite this
License: CC BY 4.0
Embed code
<figure style="margin:0;max-width:1600px">
  <a href="https://chartive.org/visualizations/world-ev-share-2010-2025" target="_blank" rel="noopener">
    <img src="https://chartive.org/infographics/world-ev-share-2010-2025.png" alt="Line chart of the share of new cars sold worldwide that are electric, rising from under 0.1% in 2010 to about 4.4% in 2020 and roughly 25% in 2025, with almost all growth after 2020." width="1600" height="2133" style="max-width:100%;height:auto" />
  </a>
  <figcaption style="font:14px/1.4 system-ui,sans-serif;color:#57534e;margin-top:8px">
    Graphic by Chartive Editorial, using data from IEA, Global EV Outlook 2026 — via <a href="https://chartive.org/visualizations/world-ev-share-2010-2025" target="_blank" rel="noopener">Chartive</a>
  </figcaption>
</figure>
Reuse is welcome — the embed keeps a link back to the source.