Climate
Verified dataWind and solar reached one-sixth of world electricity
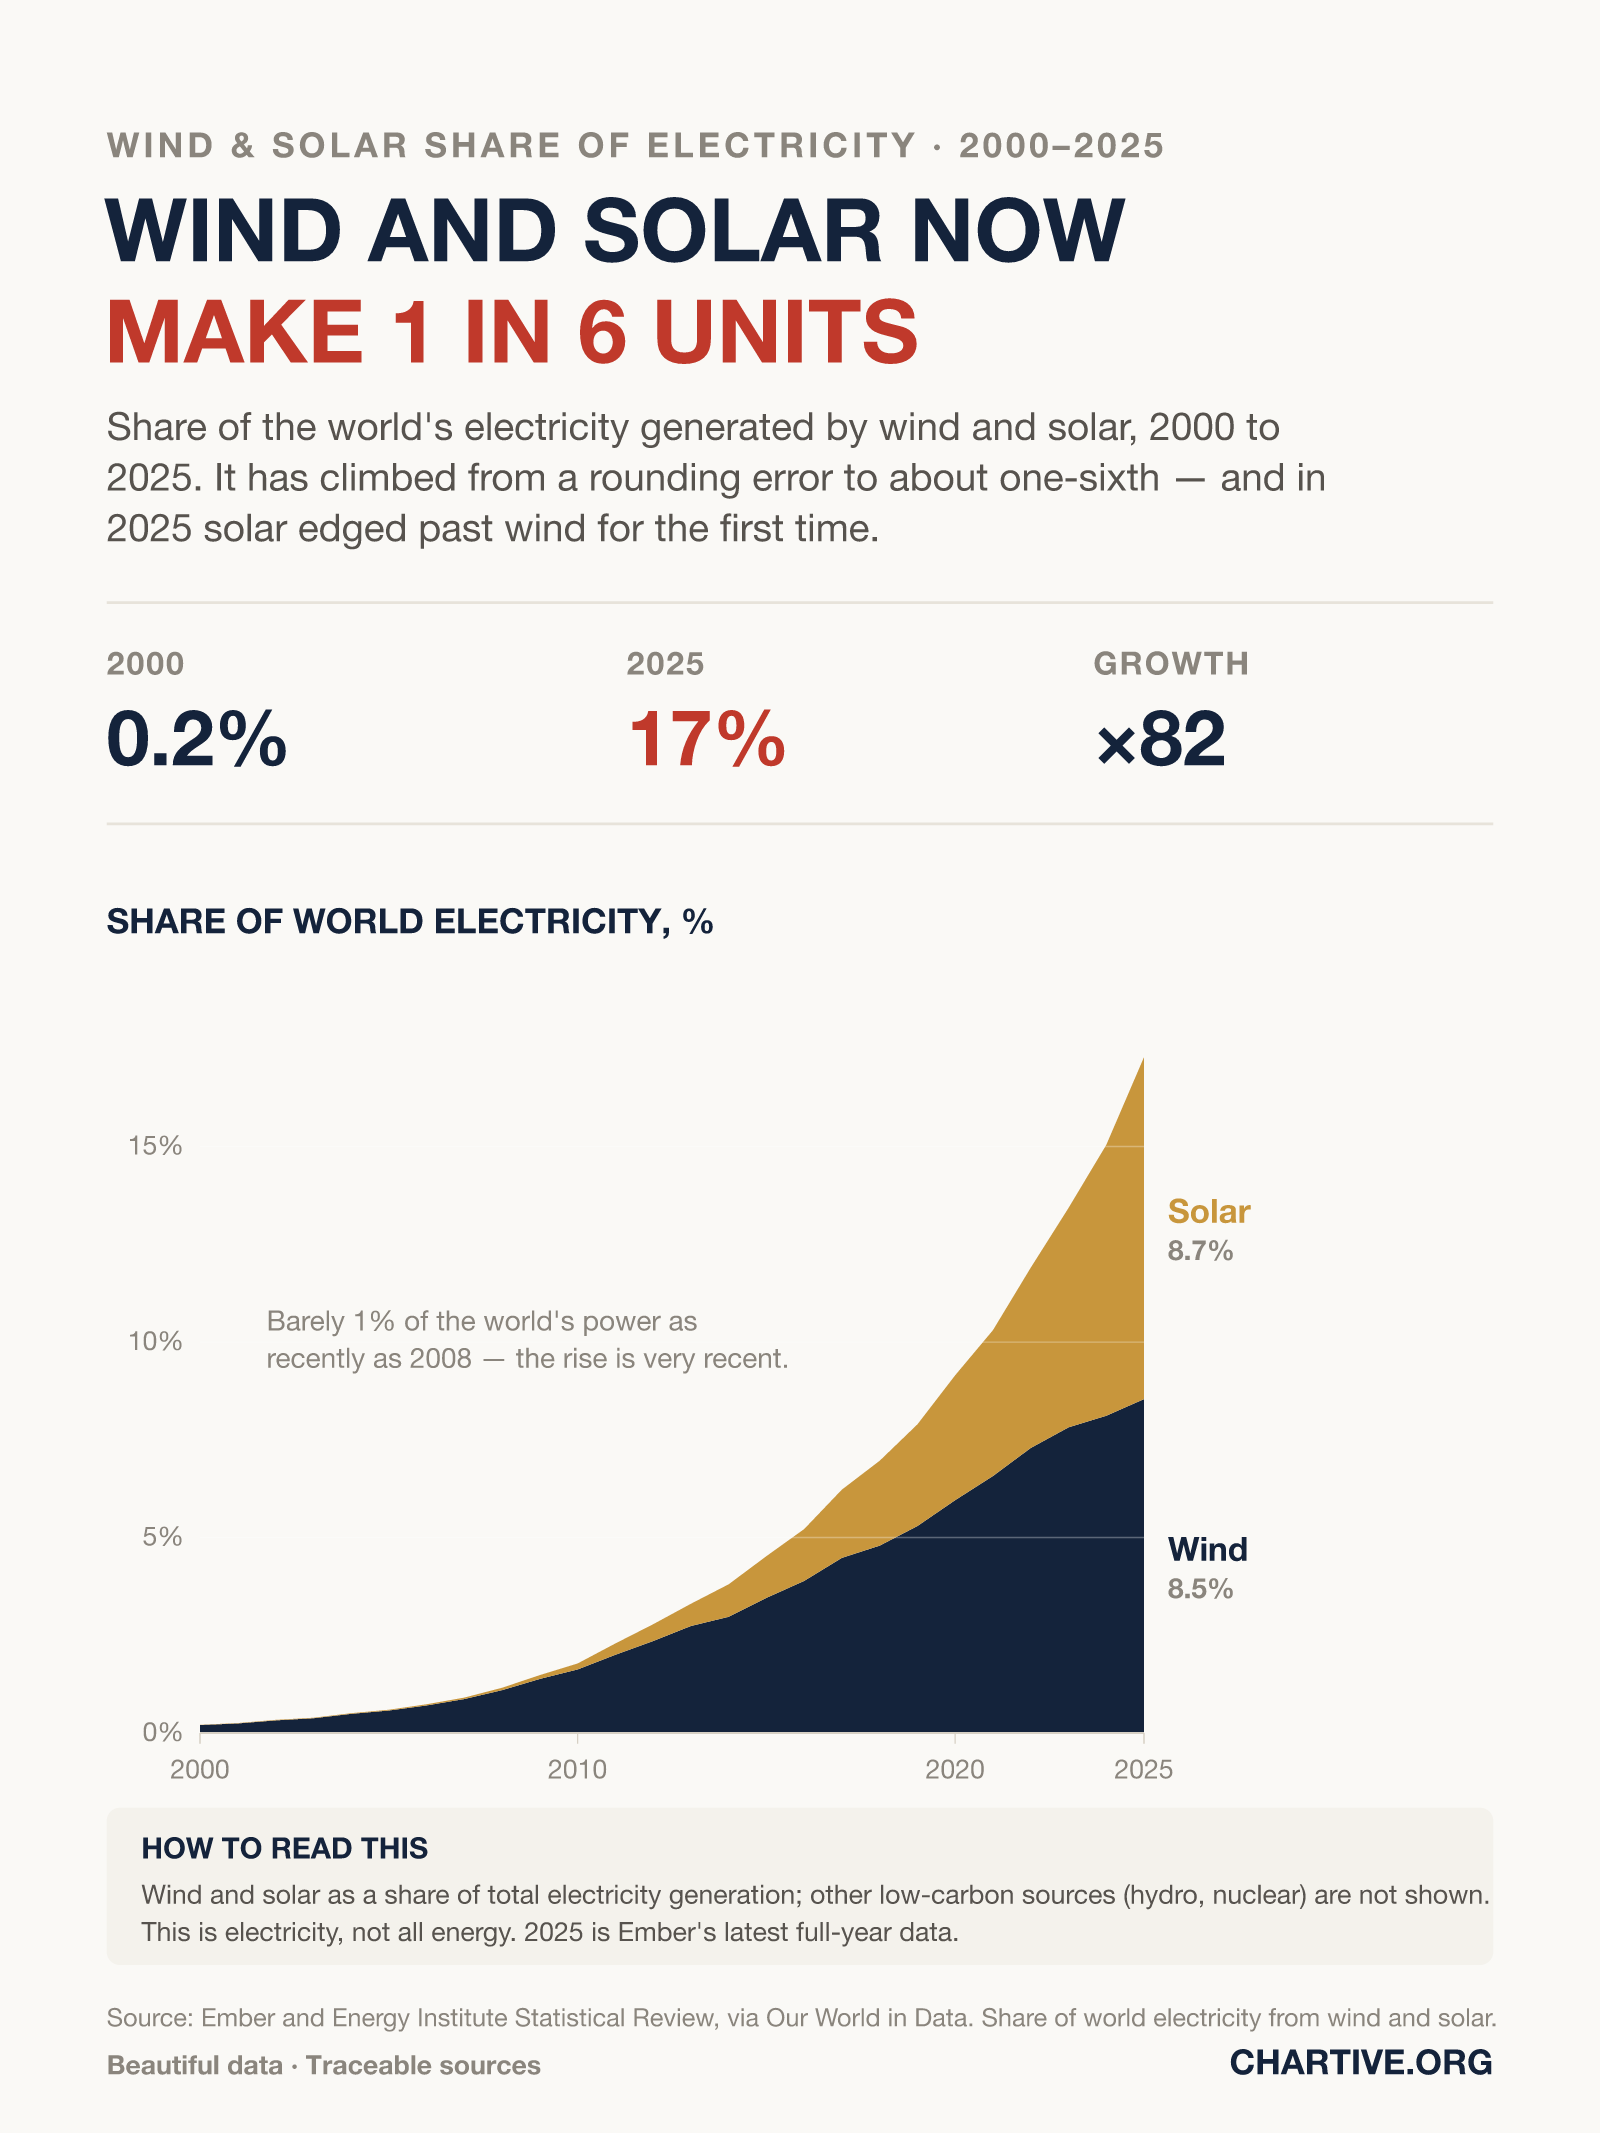
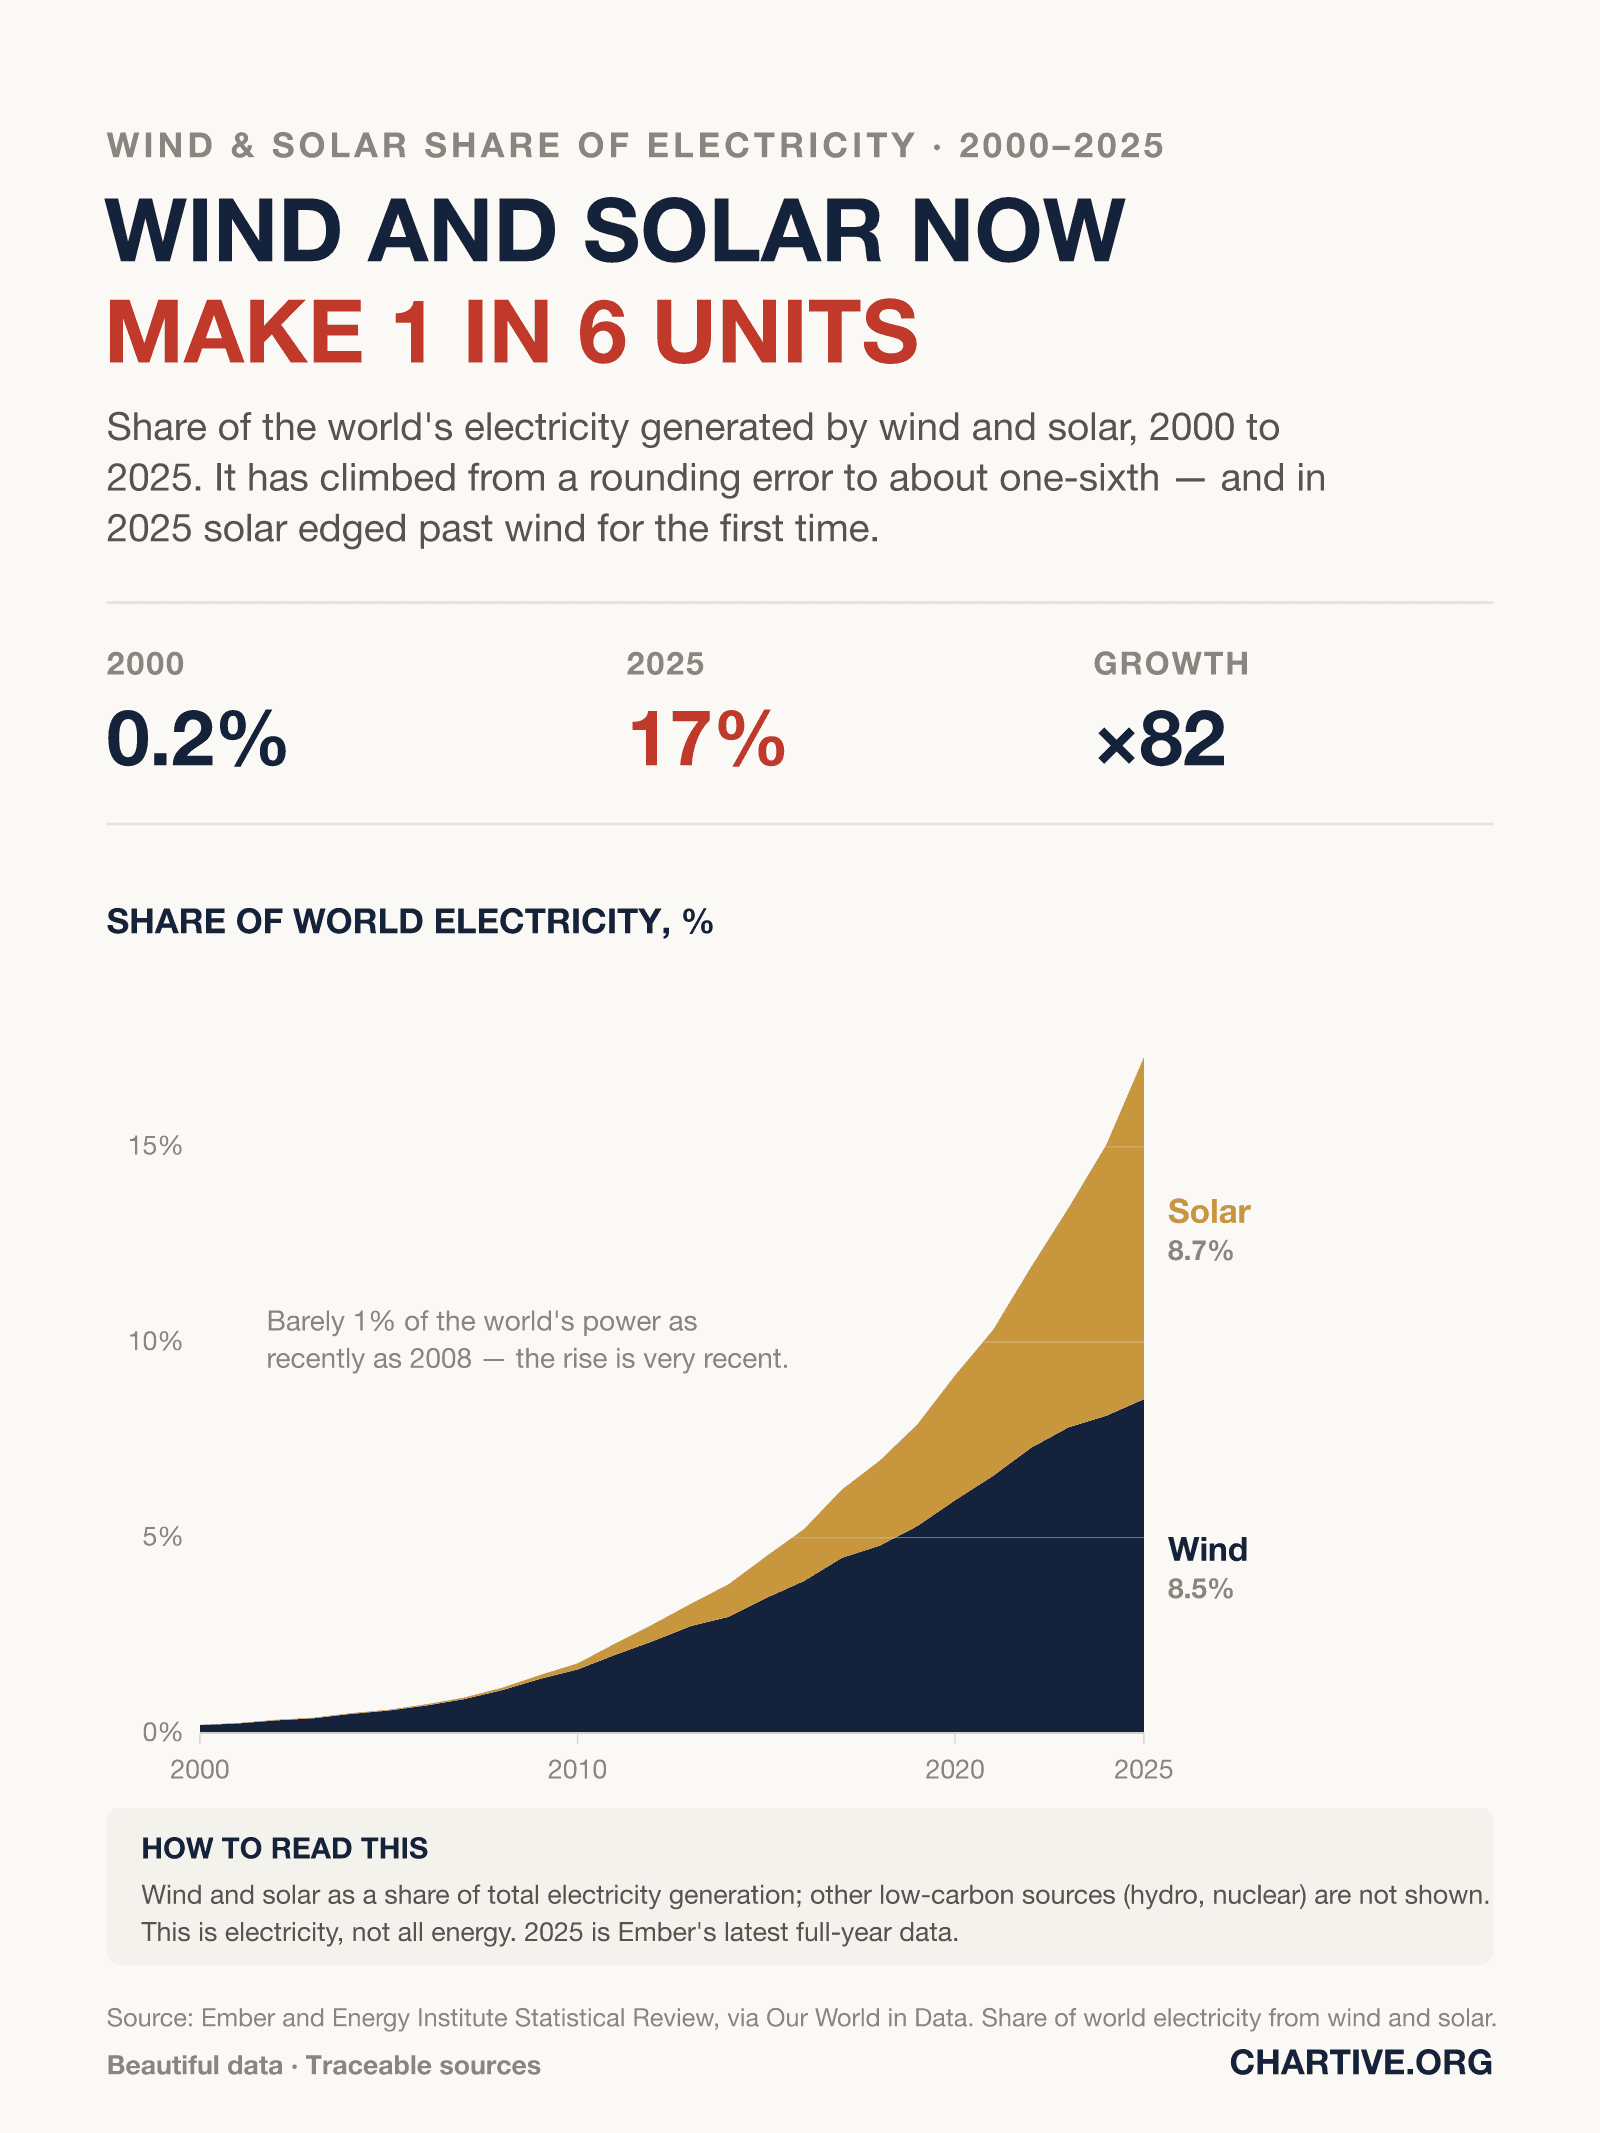
Share of the world's electricity generated by wind and solar, 2000 to 2025. It has climbed from a rounding error to about one-sixth — and in 2025 solar edged past wind for the first time.
CSV · 7,397 rows · 2000–2025
Wind and solar generated about 17% of the world's electricity in 2025, up from just 0.2% in 2000 — roughly one unit in six. In 2025 solar (8.8%) overtook wind (8.5%) for the first time.
Key findings
- Wind and solar rose from 0.2% of world electricity in 2000 to about 17% in 2025 — roughly one unit in six.
- In 2025 solar (8.8%) overtook wind (8.5%) for the first time, driven by its rapid recent growth.
- The take-off is recent: as late as 2008 the two together supplied barely 1% of global power.
Explore the data
Coverage: Jan 1, 2000 – Dec 31, 2025 · World
Free to download and reuse. Get the data behind every new chart →
Sources
Primary source
Ember; Energy Institute Statistical Review
via Our World in Data
Share of electricity production from solar and wind
Accessed Aug 22, 2026
Wind and solar as a share of total electricity generation, World, 2000–2025.
Methodology
Wind and solar generation as a share of total electricity generation, worldwide, 2000 to 2025, in percent. Data are compiled by Our World in Data from Ember's Yearly Electricity Data and the Energy Institute's Statistical Review of World Energy.
What this does not show
This is wind and solar as a share of electricity only — other low-carbon sources such as hydropower and nuclear are not shown, and electricity is a subset of total energy use (which also includes transport and heating). The 2025 figure is Ember's latest full-year data.
Creator
Reuse this visualization
Cite this
License: CC BY 4.0
Embed code
<figure style="margin:0;max-width:1600px">
  <a href="https://chartive.org/visualizations/world-wind-solar-electricity-2000-2025" target="_blank" rel="noopener">
    <img src="https://chartive.org/infographics/world-wind-solar-electricity-2000-2025.png" alt="Stacked area chart of wind and solar as a share of world electricity, 2000 to 2025, rising from 0.2% to about 17%. In 2025 solar is 8.8% and wind 8.5%." width="1600" height="2133" style="max-width:100%;height:auto" />
  </a>
  <figcaption style="font:14px/1.4 system-ui,sans-serif;color:#57534e;margin-top:8px">
    Graphic by Daniel Okafor, using data from Ember; Energy Institute Statistical Review — via <a href="https://chartive.org/visualizations/world-wind-solar-electricity-2000-2025" target="_blank" rel="noopener">Chartive</a>
  </figcaption>
</figure>
Reuse is welcome — the embed keeps a link back to the source.