Topic
Emissions
Follow this topic to get its latest charts in your For you feed.
Climate
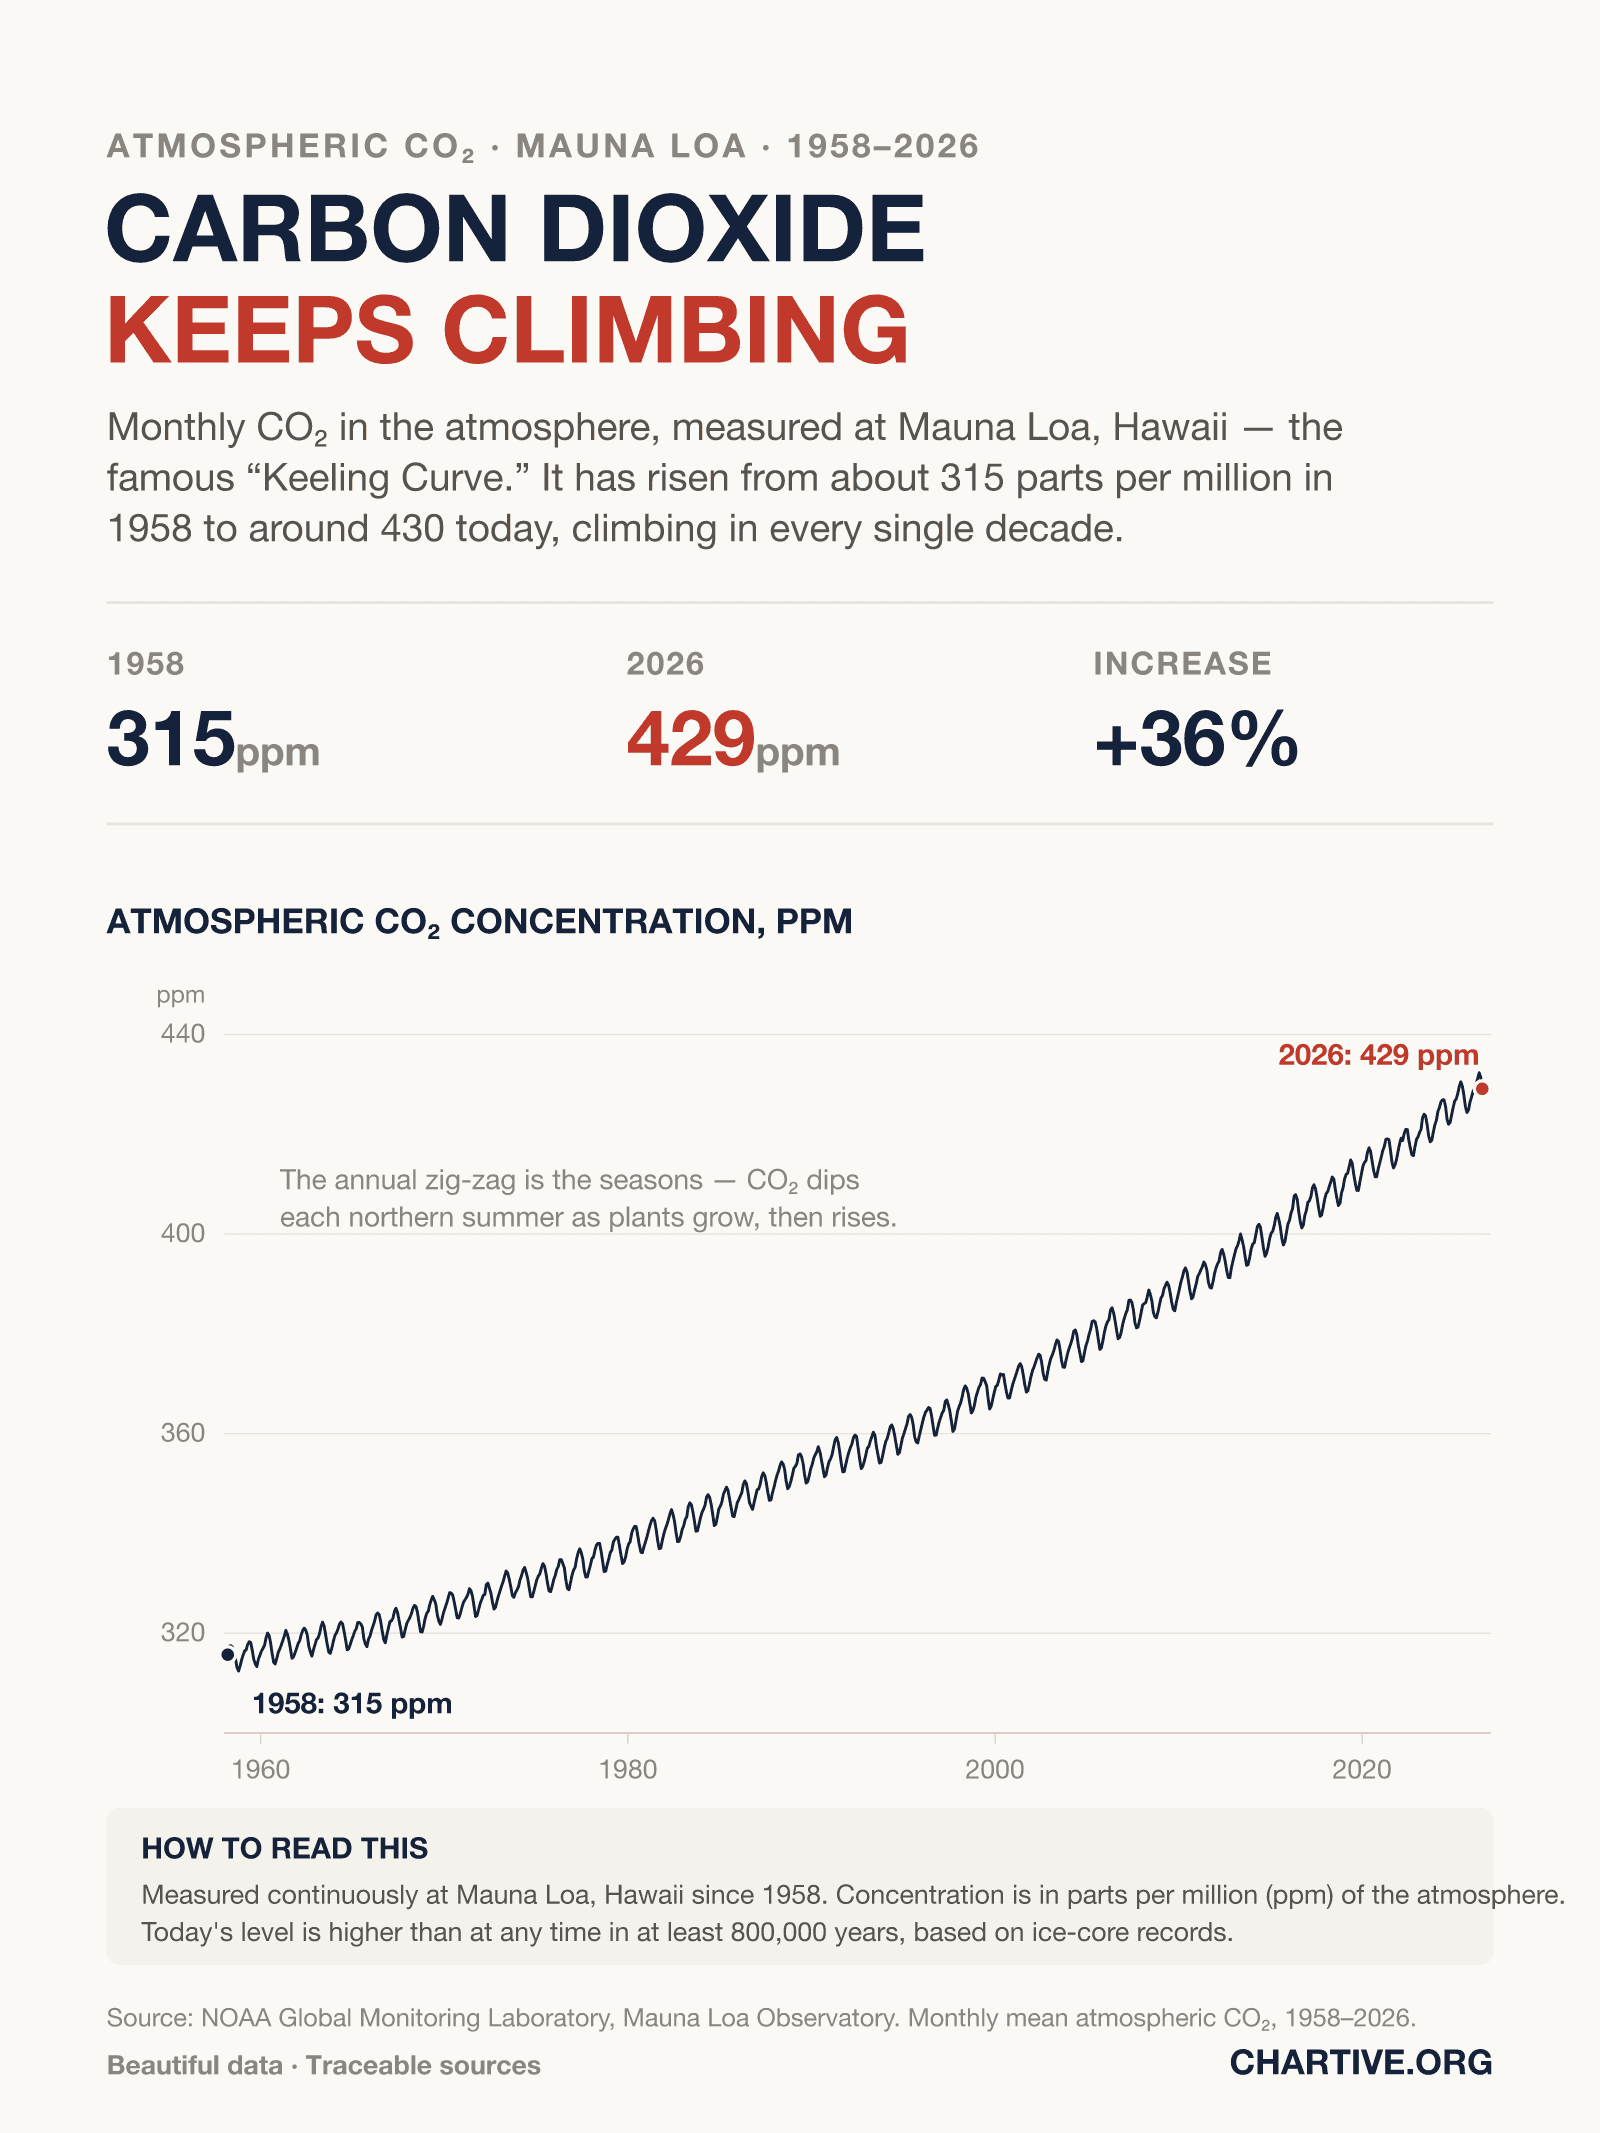
Carbon dioxide keeps climbing
Monthly CO₂ in the atmosphere, measured at Mauna Loa, Hawaii — the famous “Keeling Curve.” It has risen from about 315 parts per million in 1958 to around 430 today, climbing in every single decade.
Daniel Okafor
Climate
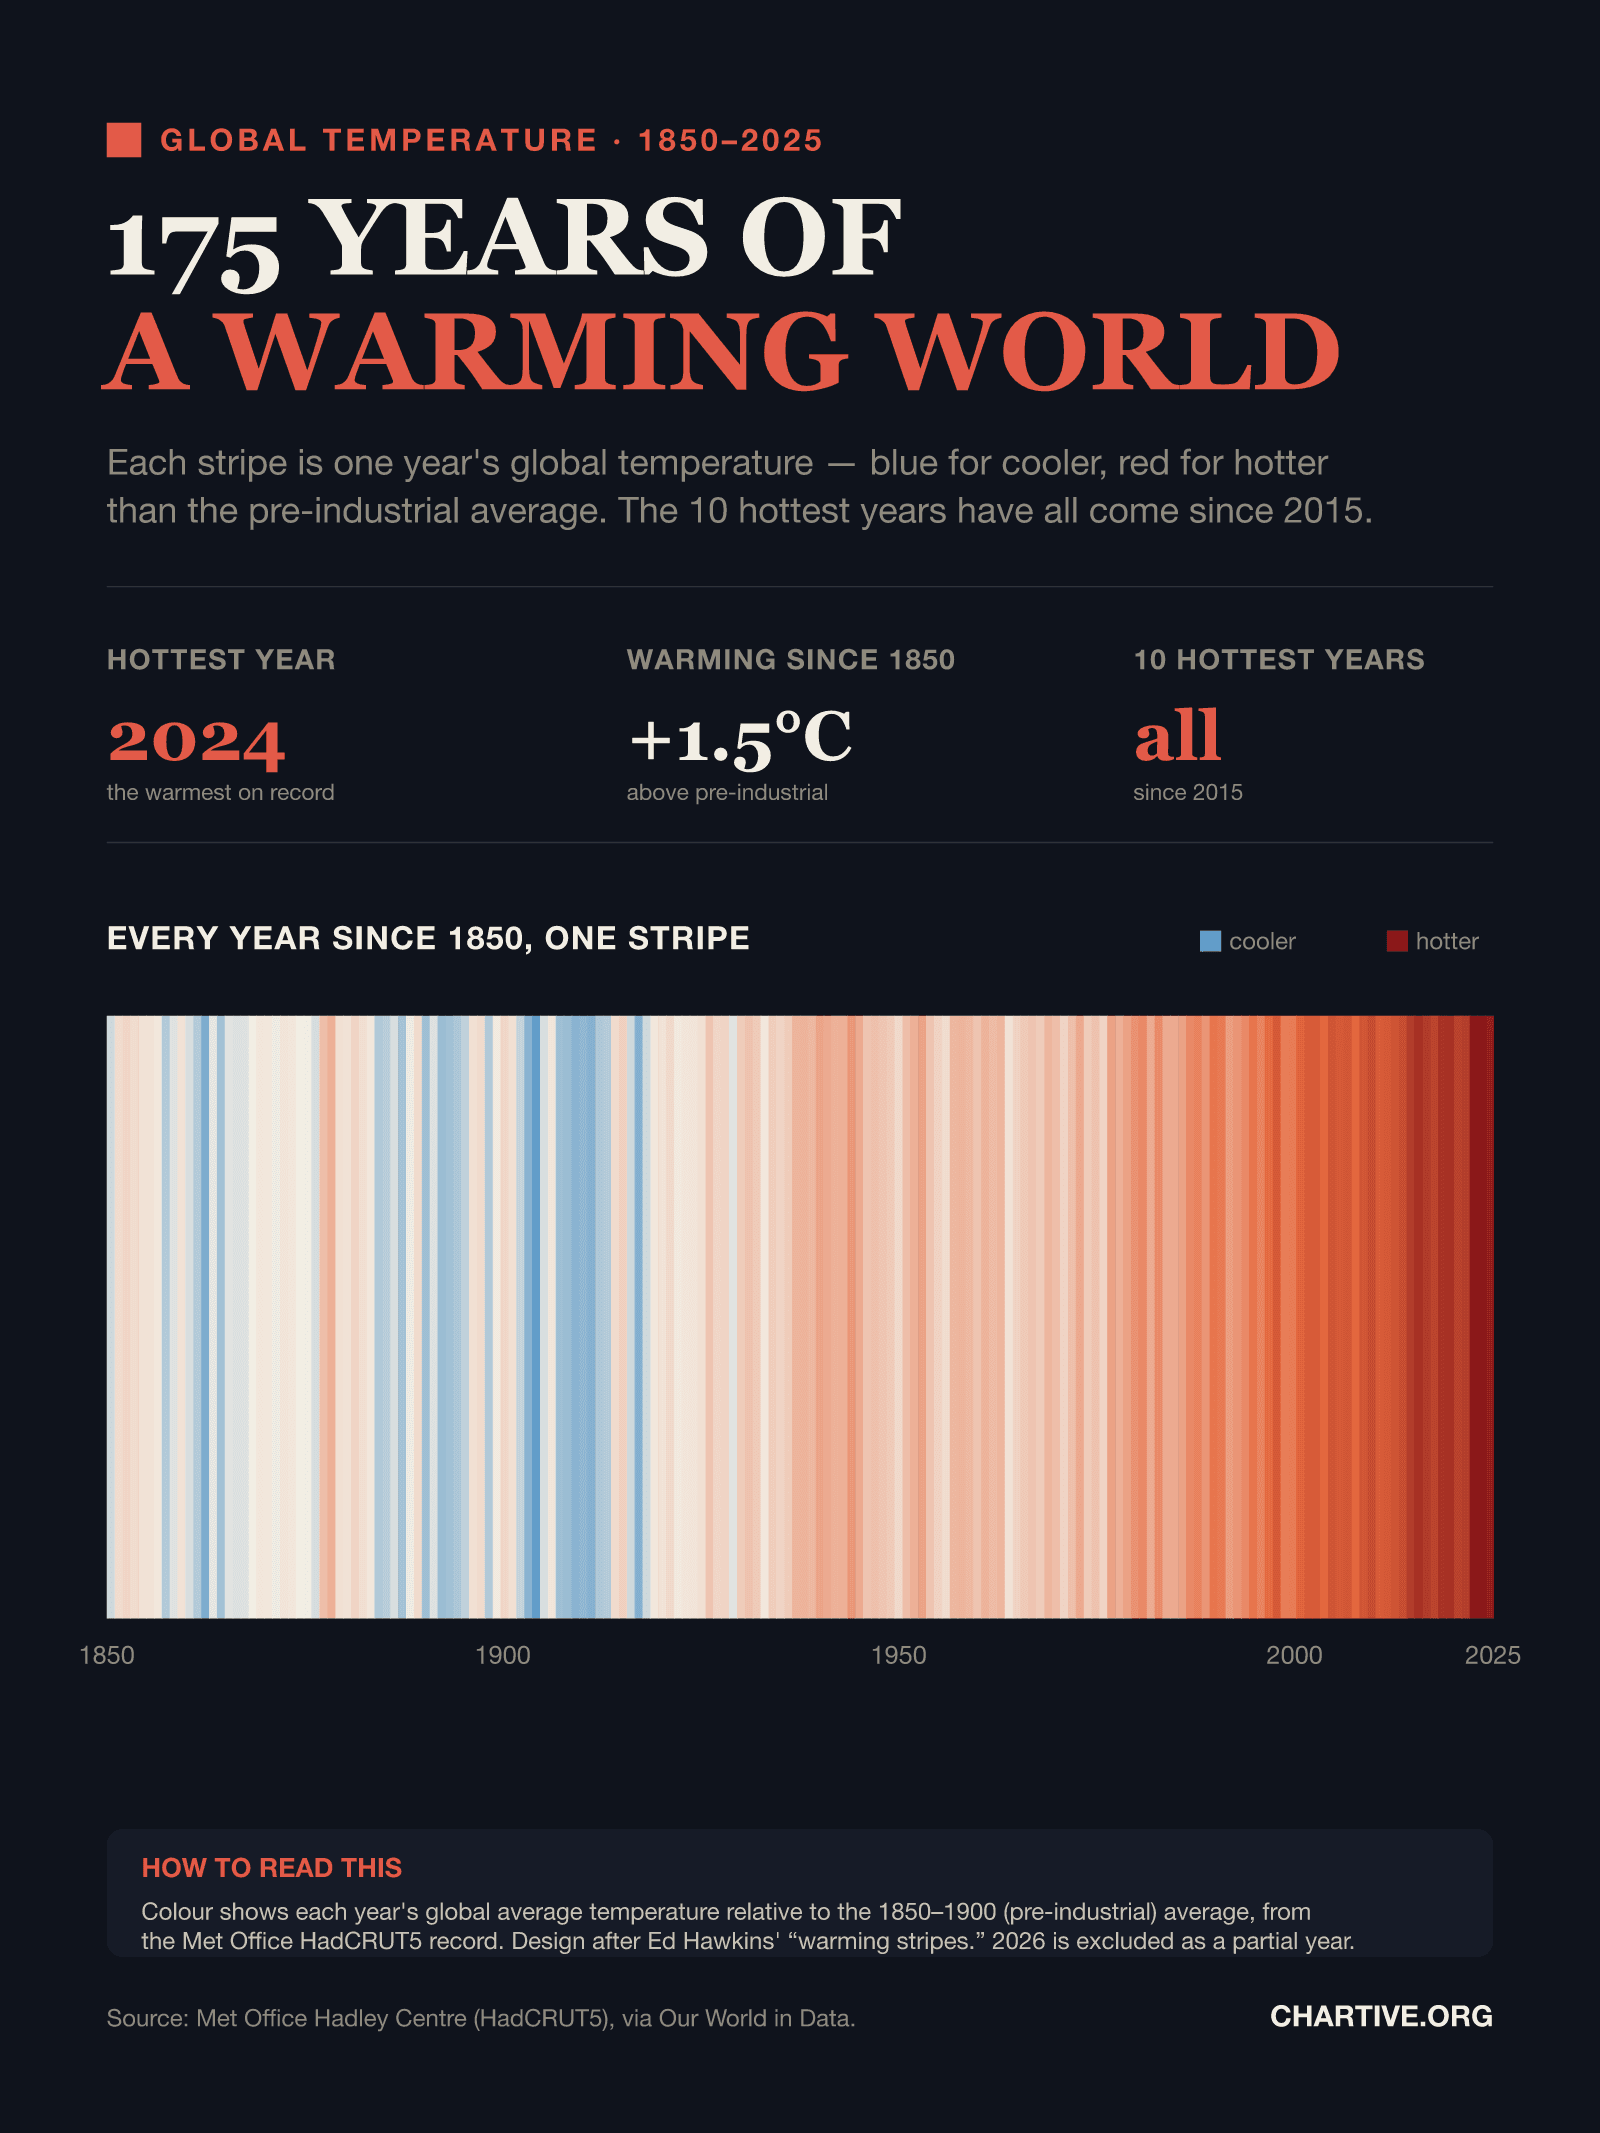
175 years of a warming world
Each stripe is one year's global temperature from 1850 to 2025 — blue for cooler, red for hotter than the pre-industrial average. The ten hottest years on record have all come since 2015.
Chartive Editorial
Climate
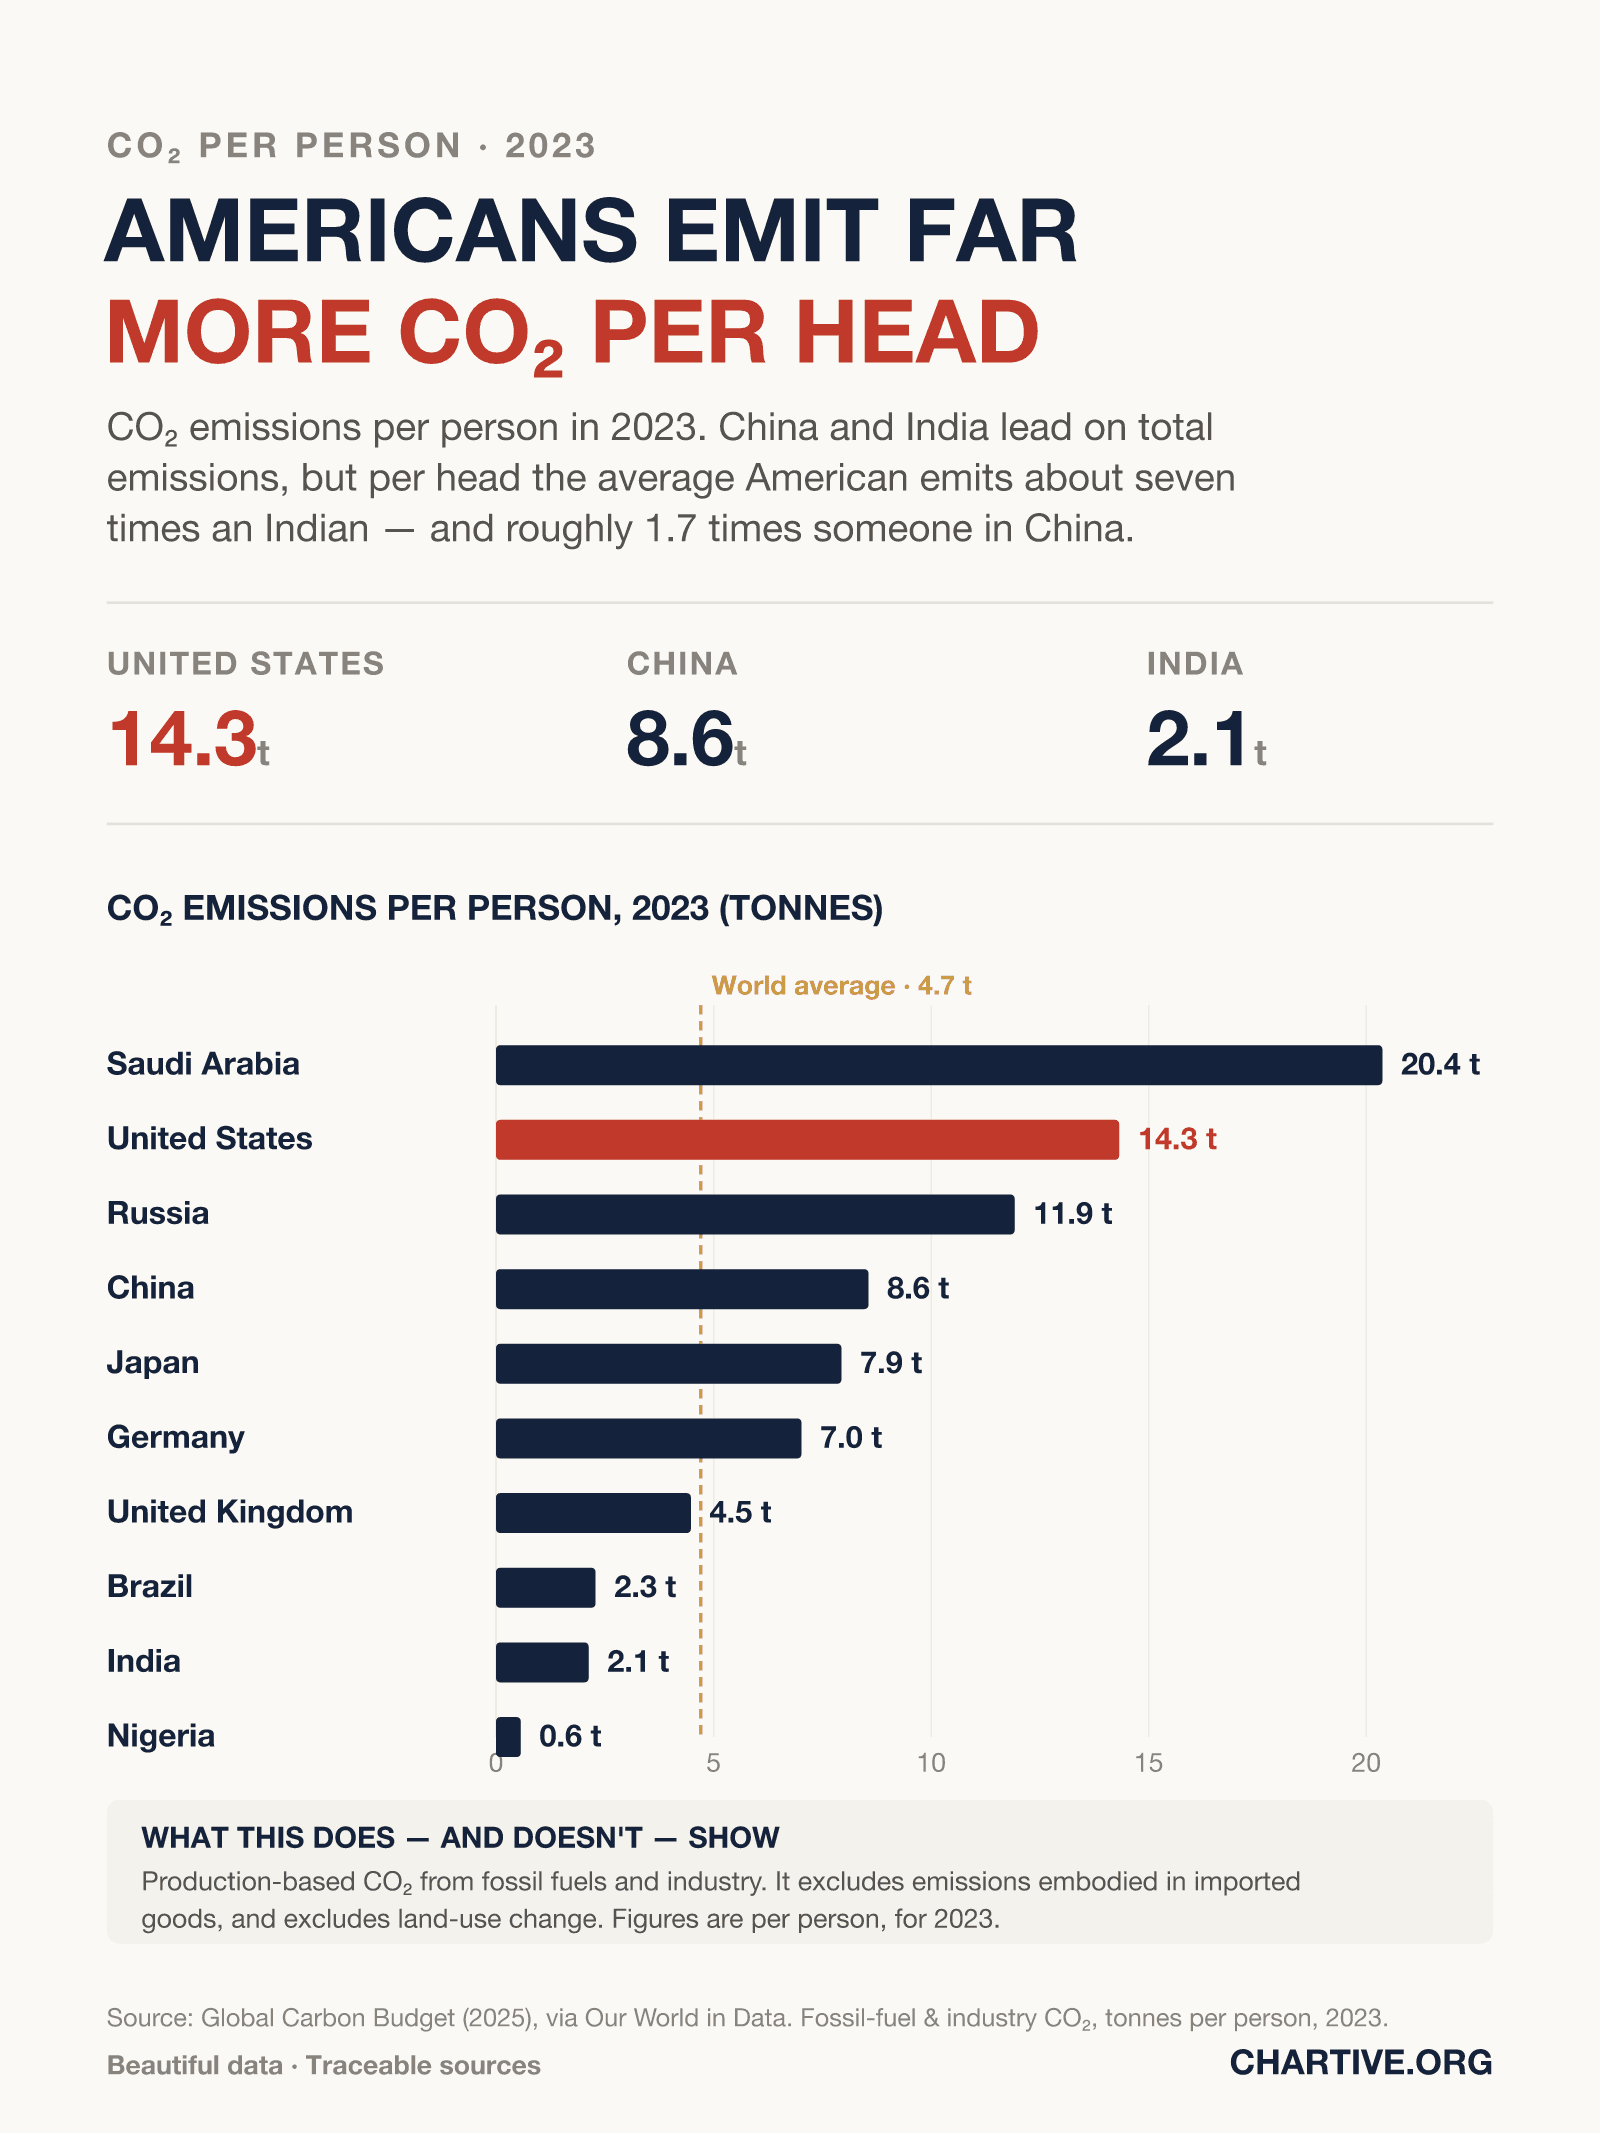
Americans emit far more CO₂ per person than China or India
CO₂ emissions per person in 2023. China and India lead on total emissions, but per head the average American emits about seven times an Indian — and roughly 1.7 times someone in China.
Chartive Editorial