Climate
Verified dataAmericans emit far more CO₂ per person than China or India
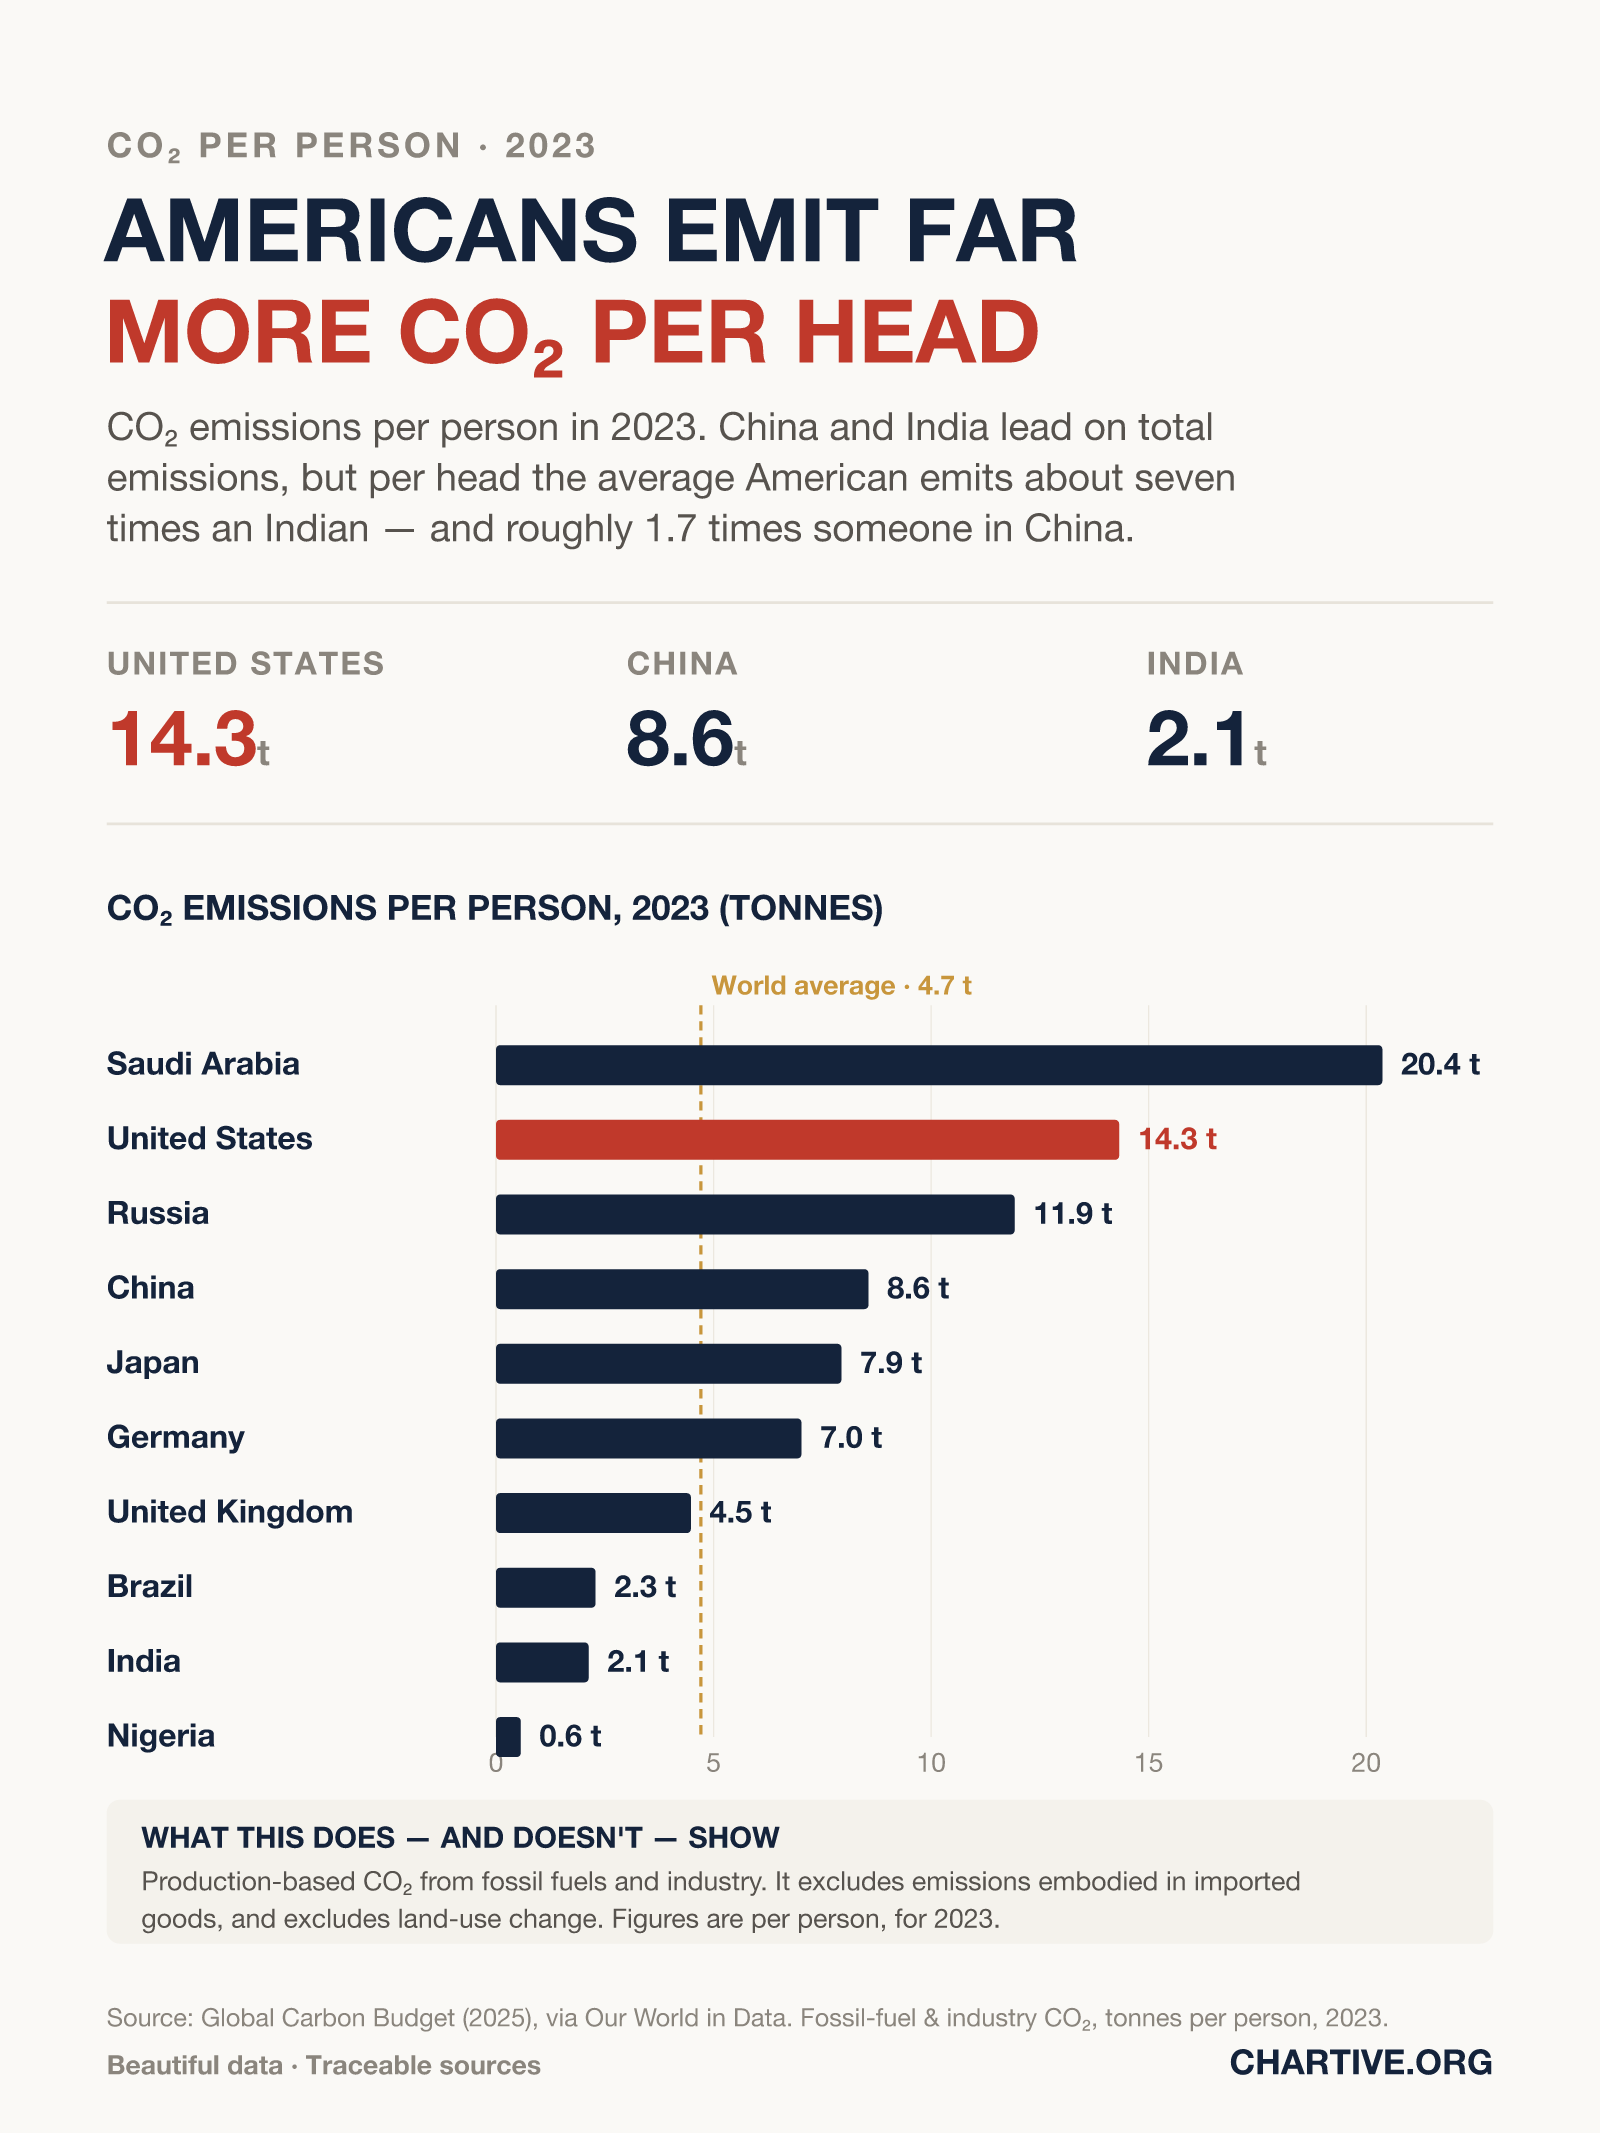
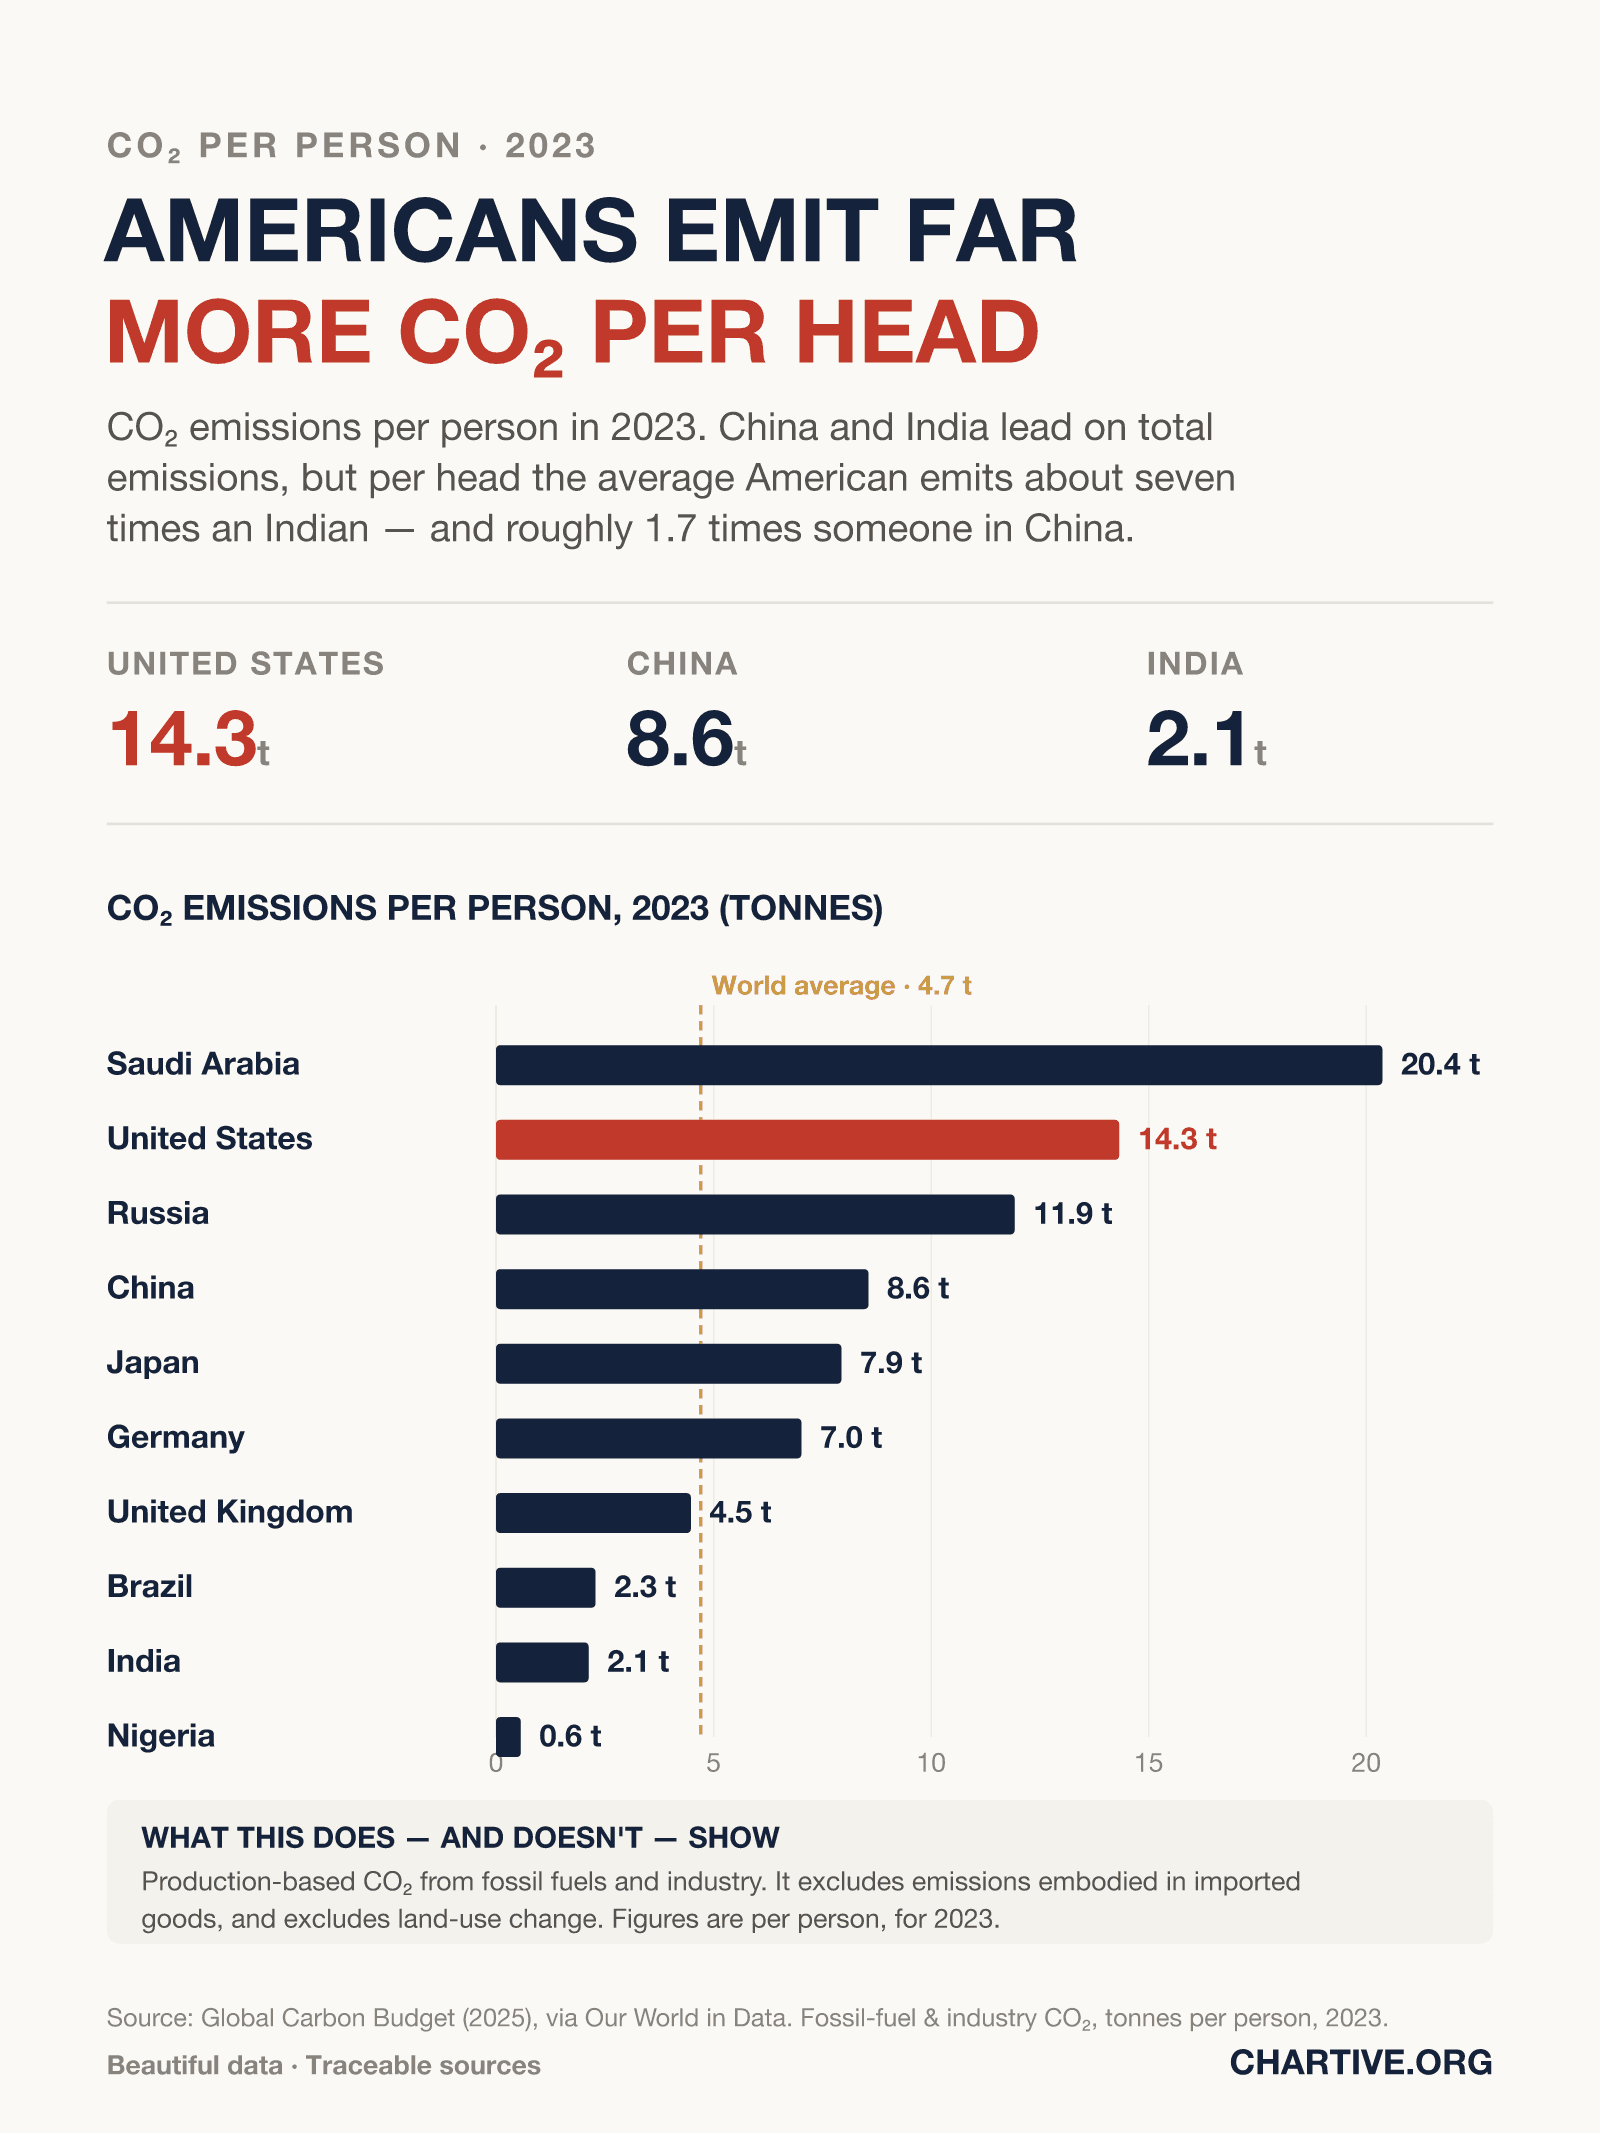
CO₂ emissions per person in 2023. China and India lead on total emissions, but per head the average American emits about seven times an Indian — and roughly 1.7 times someone in China.
CSV · 11 rows · 2023
In 2023 the average American emitted about 14.3 tonnes of CO₂ — roughly 1.7 times a person in China, about seven times a person in India, and three times the world average of 4.7 tonnes.
Key findings
- Saudi Arabia (20.4 t) and the United States (14.3 t) top the list — the U.S. emits about three times the world average of 4.7 tonnes.
- China's per-person emissions (8.6 t) now exceed those of Japan, Germany and the UK, yet remain roughly 1.7 times below the United States.
- India (2.1 t) and Nigeria (0.6 t) emit a small fraction per person, even though India is among the largest total emitters.
Explore the data
Coverage: Jan 1, 2023 – Dec 31, 2023 · Selected countries
Free to download and reuse. Get the data behind every new chart →
Sources
Primary source
Global Carbon Budget (2025)
via Our World in Data
CO₂ emissions per capita
Accessed Aug 14, 2026
Production-based fossil-fuel and industry CO₂ per person, 2023, in tonnes.
Methodology
Production-based (territorial) CO₂ emissions from fossil fuels and industry, divided by population, for 2023, in tonnes per person. Data are from the Global Carbon Budget (2025), distributed via Our World in Data.
What this does not show
These are production-based emissions — CO₂ released within a country's borders. They exclude emissions embodied in imported goods (a consumption-based measure shifts some emissions from manufacturing countries to importers) and exclude land-use change. Figures are per person; total national emissions rank differently — China and the United States are the two largest total emitters.
Creator
Reuse this visualization
Cite this
License: CC BY 4.0
Embed code
<figure style="margin:0;max-width:1600px">
  <a href="https://chartive.org/visualizations/co2-emissions-per-capita-2023" target="_blank" rel="noopener">
    <img src="https://chartive.org/infographics/co2-per-capita-2023.png" alt="Horizontal bar chart of CO₂ emissions per person in 2023: Saudi Arabia 20.4t, United States 14.3t (highlighted), Russia 11.9t, China 8.6t, Japan 7.9t, Germany 7.0t, United Kingdom 4.5t, Brazil 2.3t, India 2.1t, Nigeria 0.6t, with a world average of 4.7t." width="1600" height="2133" style="max-width:100%;height:auto" />
  </a>
  <figcaption style="font:14px/1.4 system-ui,sans-serif;color:#57534e;margin-top:8px">
    Graphic by Chartive Editorial, using data from Global Carbon Budget (2025) — via <a href="https://chartive.org/visualizations/co2-emissions-per-capita-2023" target="_blank" rel="noopener">Chartive</a>
  </figcaption>
</figure>
Reuse is welcome — the embed keeps a link back to the source.