Climate
Verified dataCarbon dioxide keeps climbing
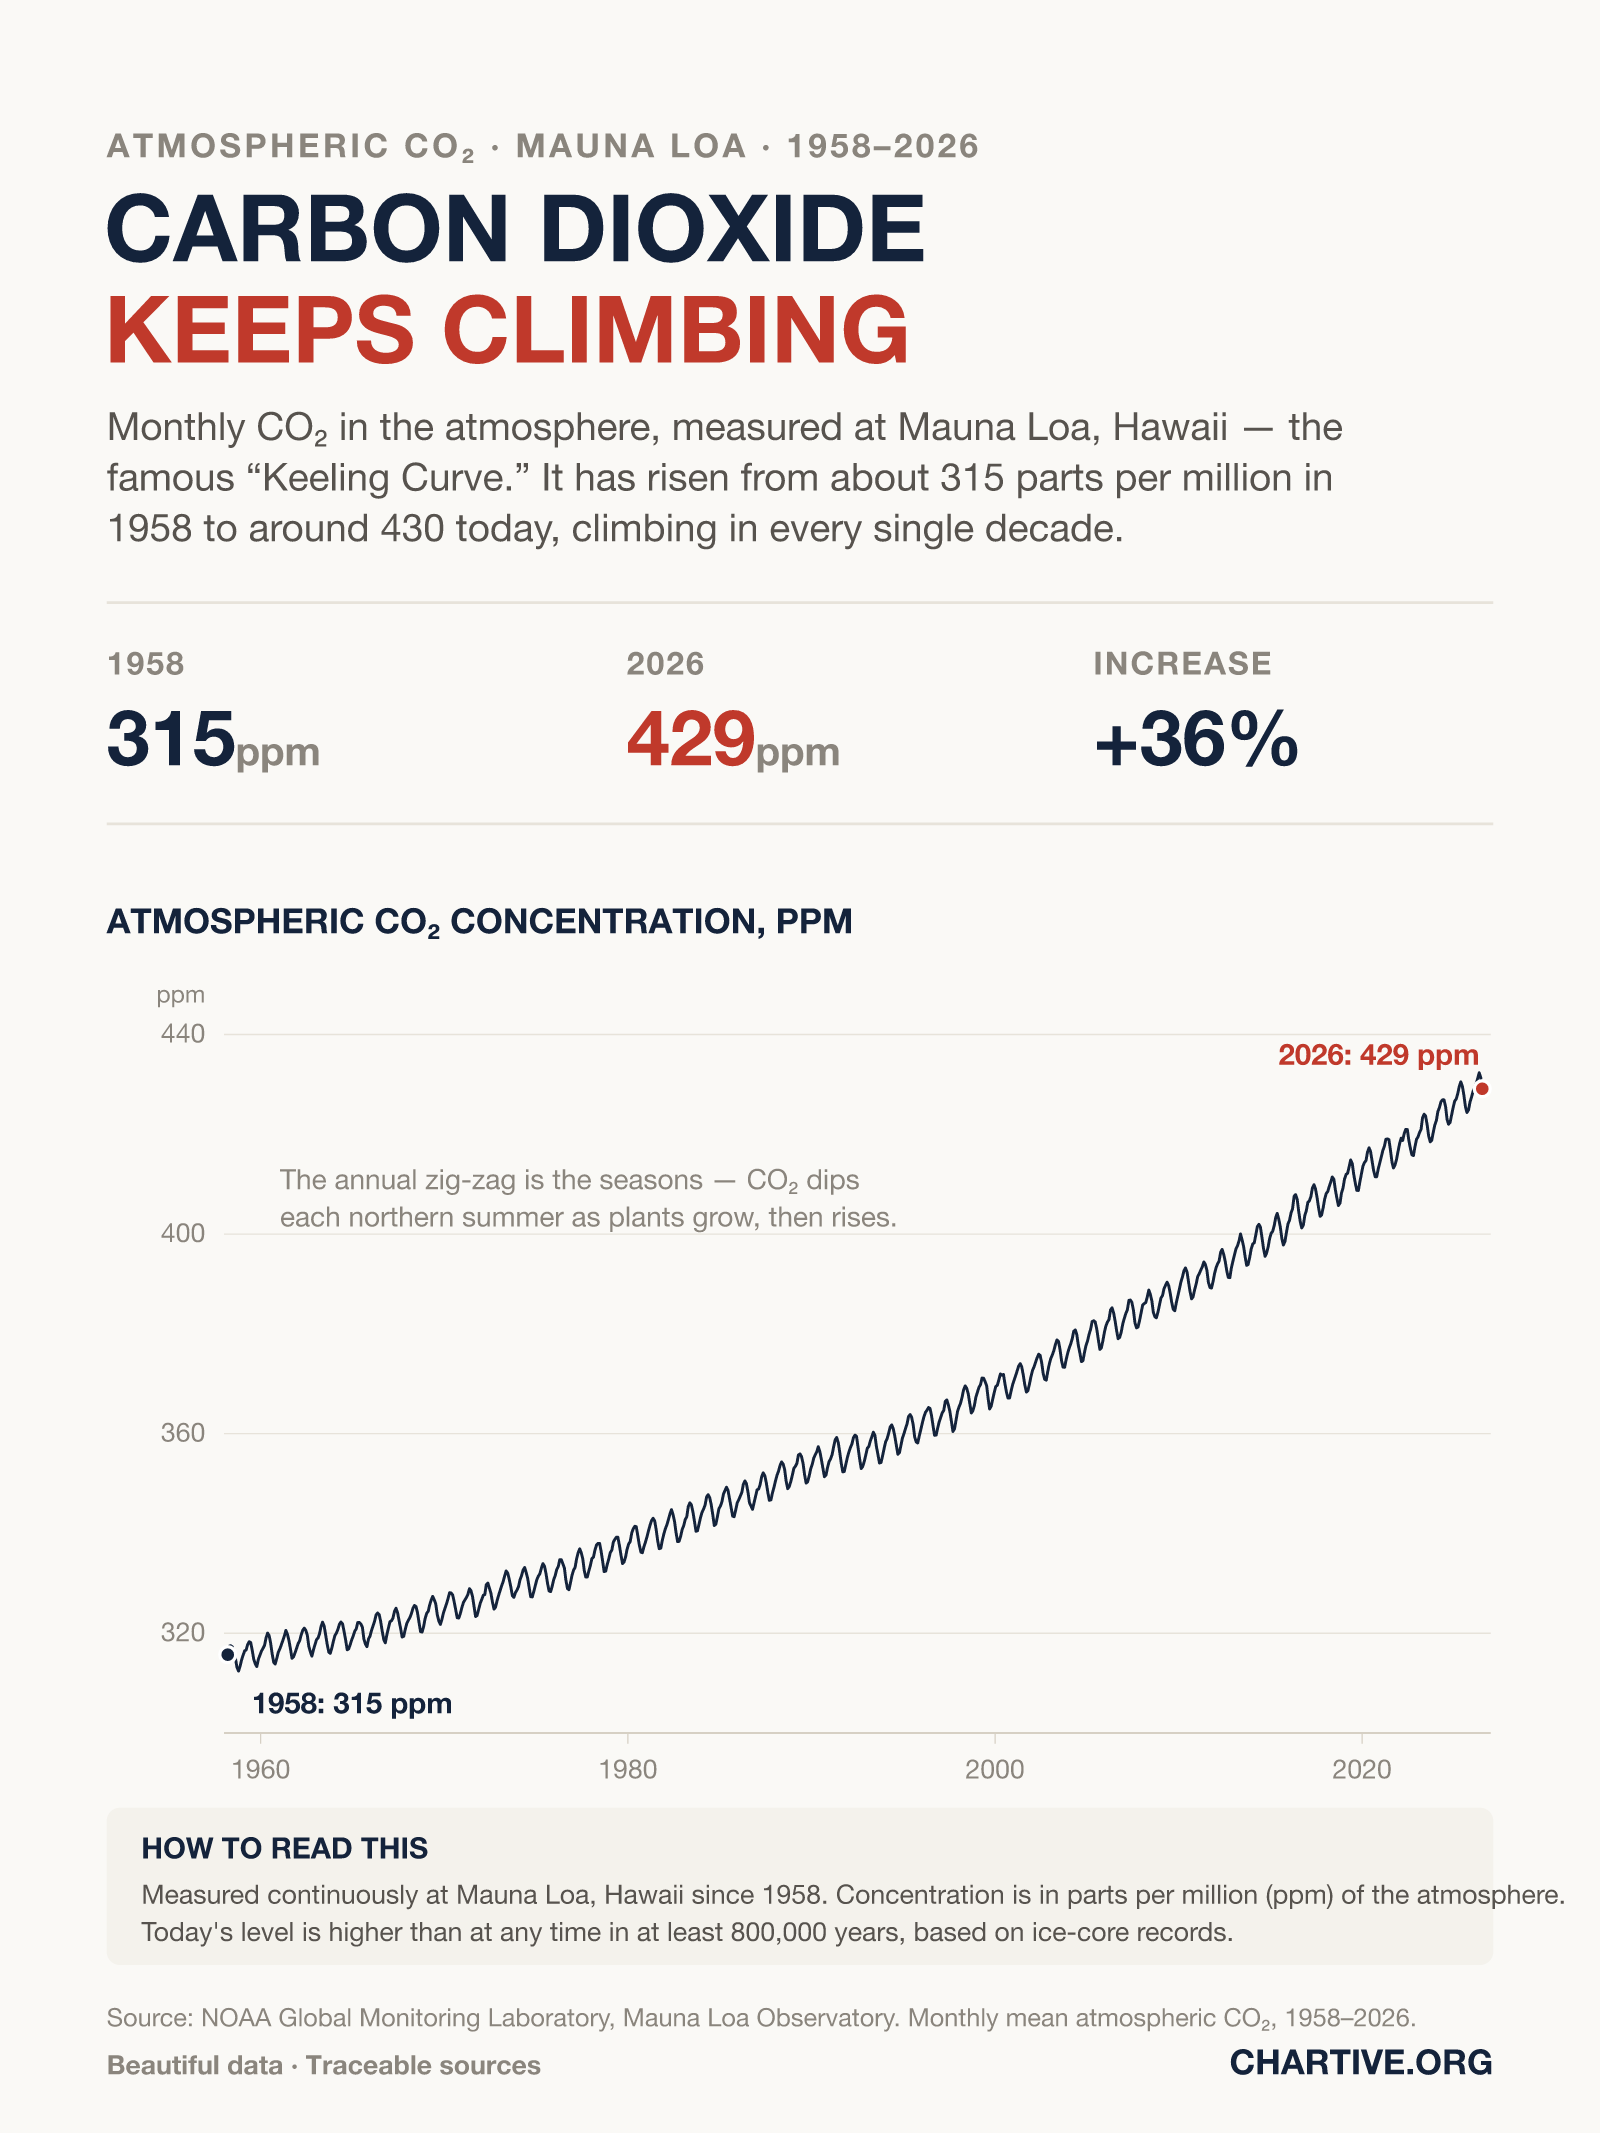
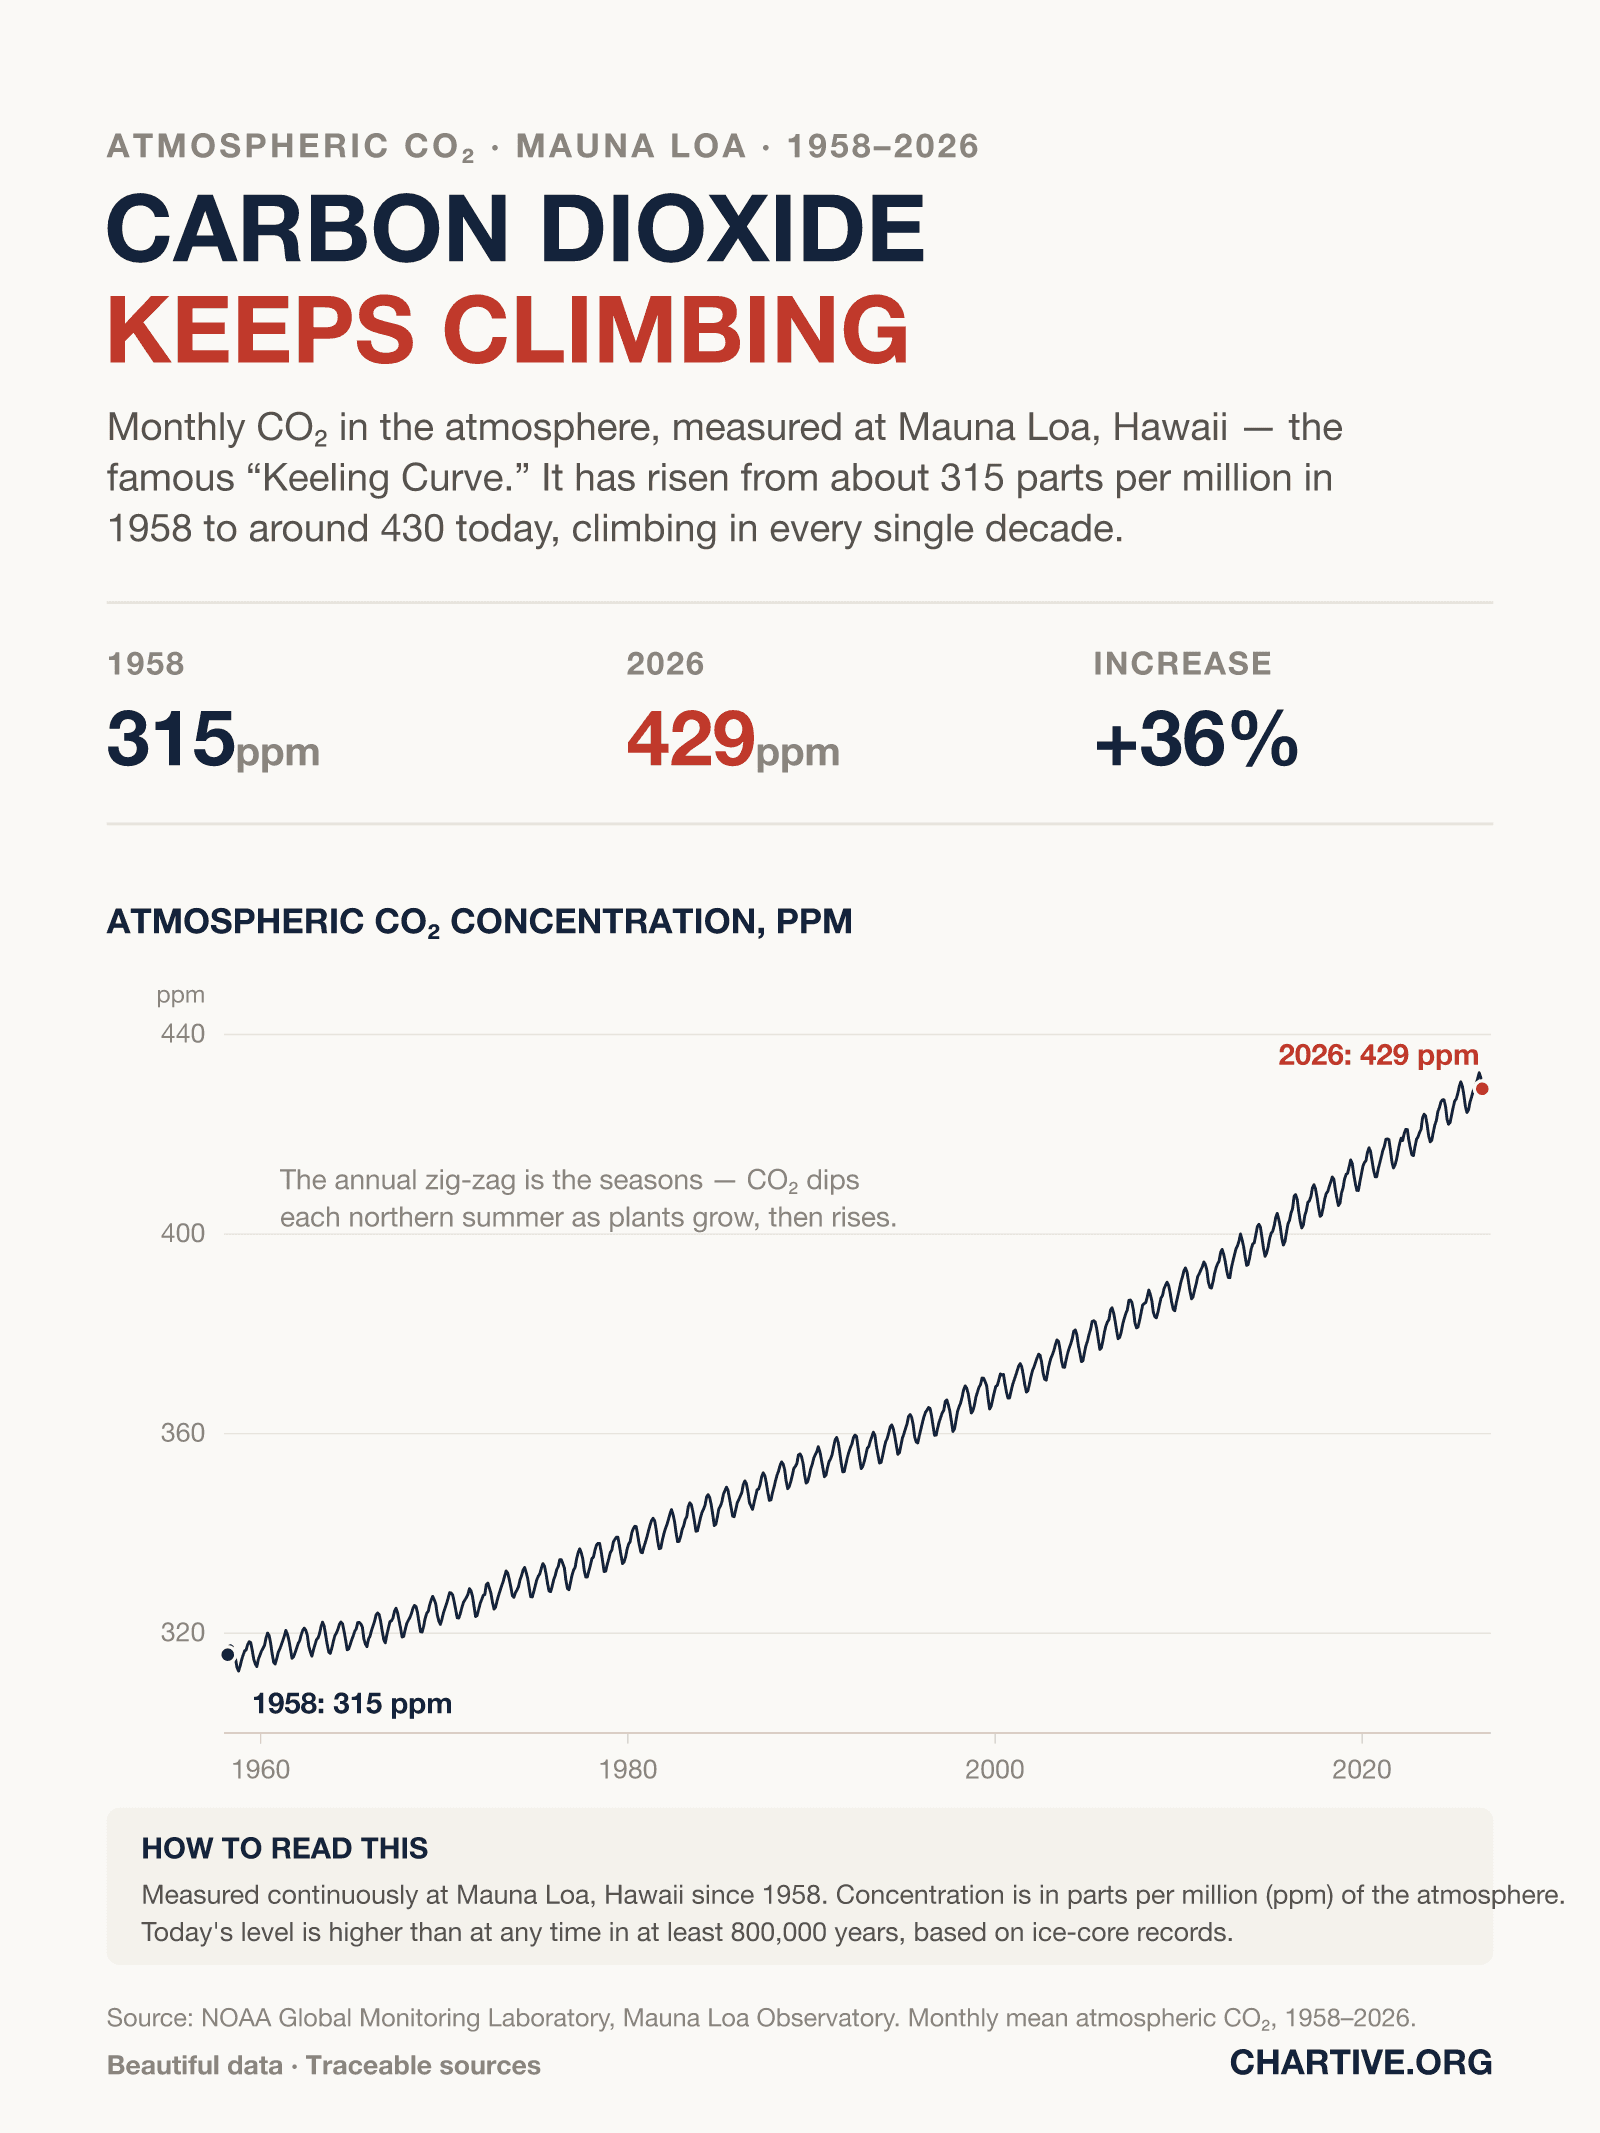
Monthly CO₂ in the atmosphere, measured at Mauna Loa, Hawaii — the famous “Keeling Curve.” It has risen from about 315 parts per million in 1958 to around 430 today, climbing in every single decade.
CSV · 821 rows · 1958–2026
Atmospheric CO₂ measured at Mauna Loa has climbed from about 315 parts per million in 1958 to around 429 in 2026 — a 36% rise, and higher than at any time in at least 800,000 years. The annual zig-zag is the seasons; the underlying trend has risen every decade.
Key findings
- Atmospheric CO₂ has risen from about 315 ppm in 1958 to around 429 in 2026 — up 36%.
- It has increased in every decade of the record, with no sign of levelling off.
- Today's concentration is higher than at any point in at least the last 800,000 years.
Explore the data
Coverage: Mar 1, 1958 – Jul 31, 2026 · Global
Free to download and reuse. Get the data behind every new chart →
Sources
Primary source
NOAA Global Monitoring Laboratory
Mauna Loa Observatory
Trends in atmospheric carbon dioxide
Accessed Aug 22, 2026
Monthly mean atmospheric CO₂ (ppm), Mauna Loa, March 1958 – July 2026.
Methodology
Monthly mean atmospheric carbon dioxide concentration, in parts per million (ppm), measured continuously at NOAA's Mauna Loa Observatory in Hawaii since March 1958 — the “Keeling Curve.” Data are from the NOAA Global Monitoring Laboratory.
What this does not show
Mauna Loa is a single, well-mixed mid-Pacific site that closely tracks the global average. The annual saw-tooth is seasonal: CO₂ falls each northern-hemisphere summer as plants take up carbon, then rises again. The comparison with the past 800,000 years comes from ice-core records.
Creator
Reuse this visualization
Cite this
License: CC BY 4.0
Embed code
<figure style="margin:0;max-width:1600px">
  <a href="https://chartive.org/visualizations/co2-keeling-curve-1958-2026" target="_blank" rel="noopener">
    <img src="https://chartive.org/infographics/co2-keeling-curve-1958-2026.png" alt="Line chart of monthly atmospheric CO₂ at Mauna Loa from 1958 to 2026, rising with a seasonal saw-tooth pattern from about 315 to 429 parts per million." width="1600" height="2133" style="max-width:100%;height:auto" />
  </a>
  <figcaption style="font:14px/1.4 system-ui,sans-serif;color:#57534e;margin-top:8px">
    Graphic by Daniel Okafor, using data from NOAA Global Monitoring Laboratory — via <a href="https://chartive.org/visualizations/co2-keeling-curve-1958-2026" target="_blank" rel="noopener">Chartive</a>
  </figcaption>
</figure>
Reuse is welcome — the embed keeps a link back to the source.