Demographics
Verified dataSouth Korea went from six children per woman to fewer than one — then turned
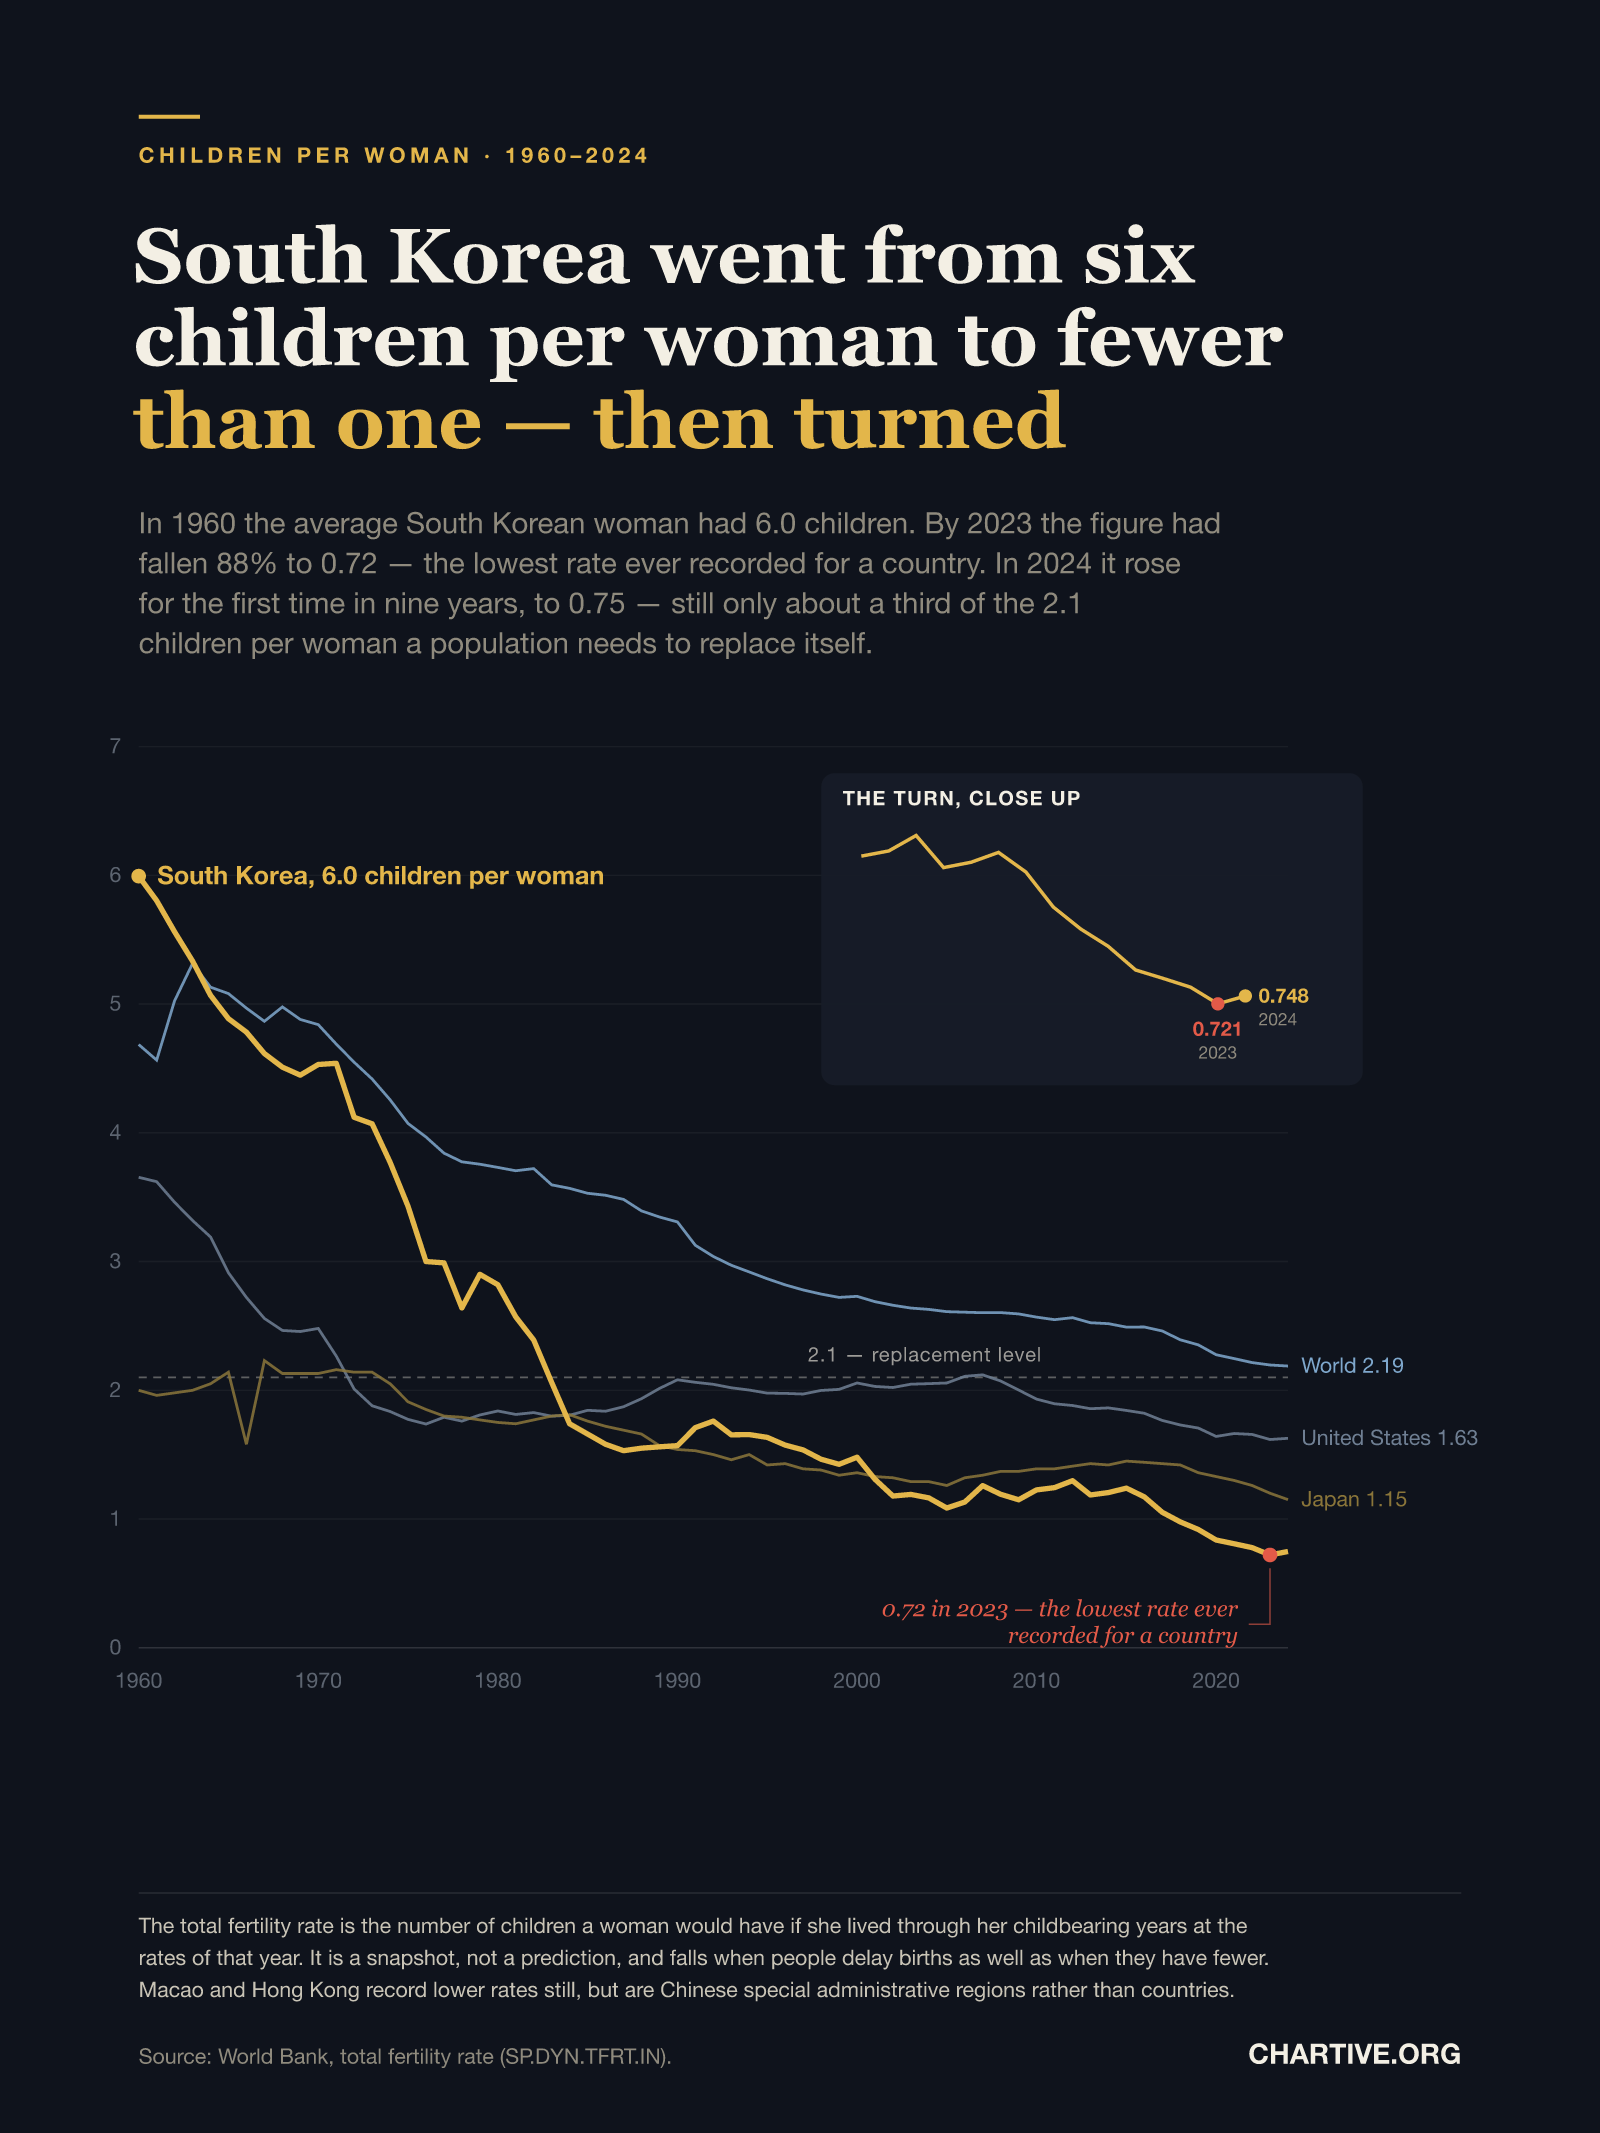
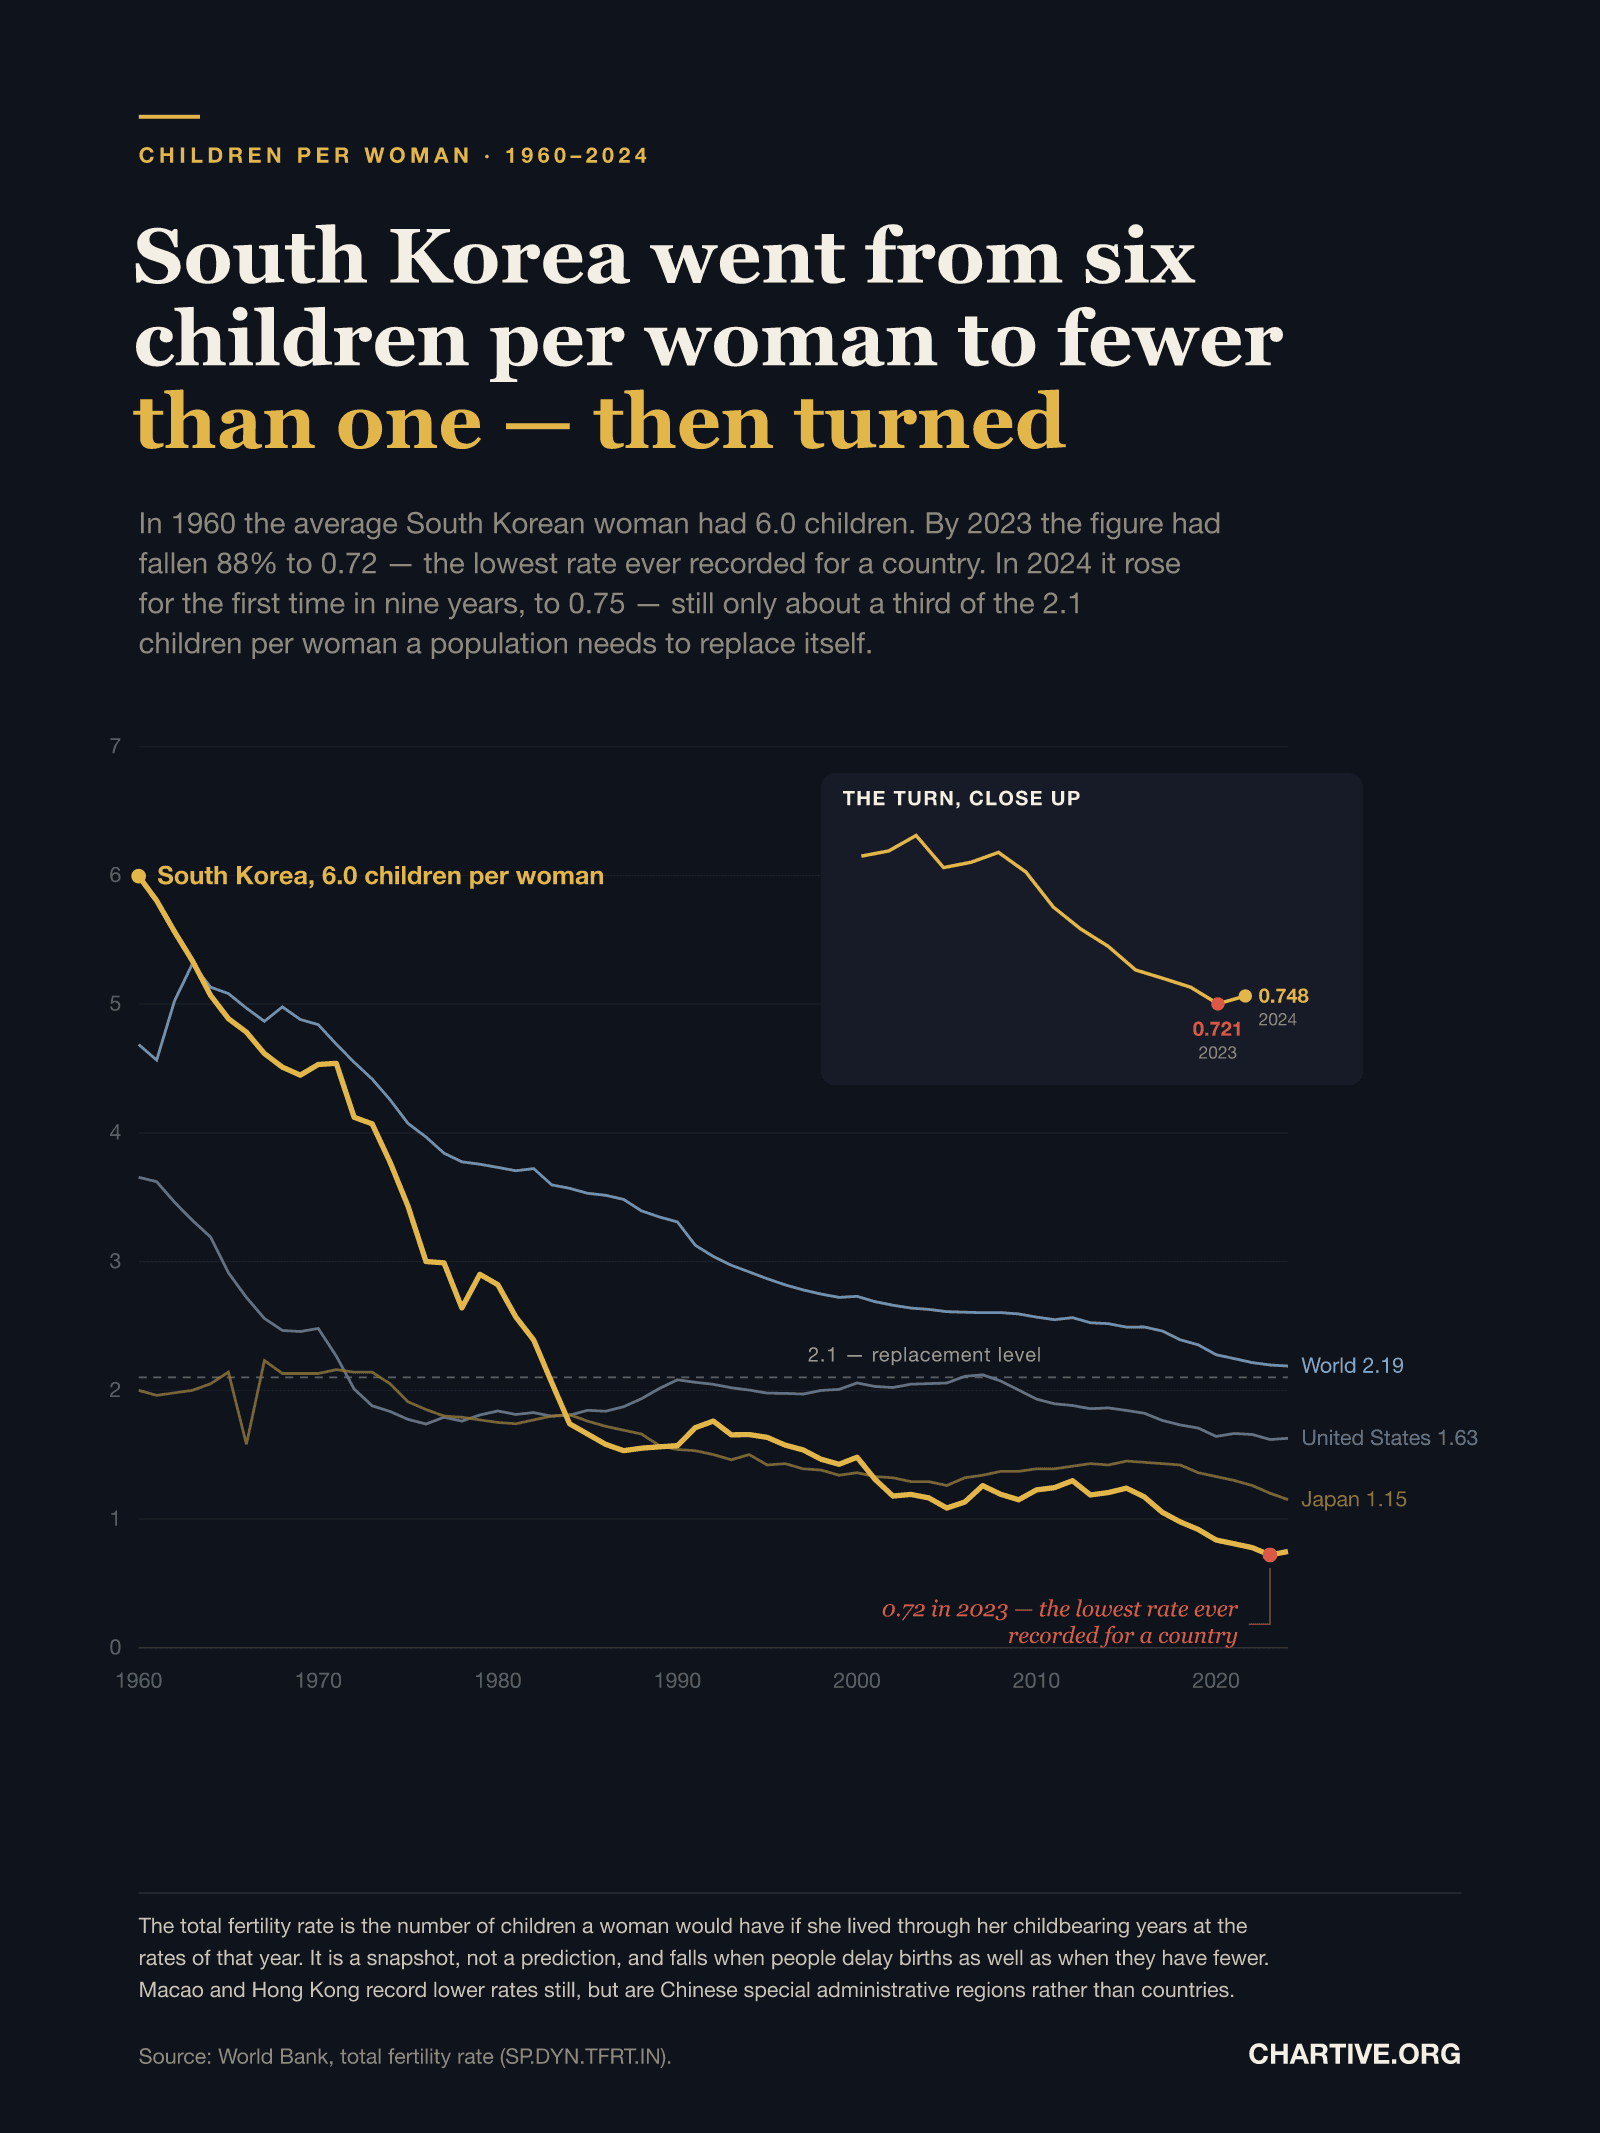
In 1960 the average South Korean woman had 6.0 children. By 2023 the figure had fallen 88% to 0.72 — the lowest rate ever recorded for a country. In 2024 it rose for the first time in nine years.
CSV · 65 rows · 1960–2024
South Korea's total fertility rate fell from 6.0 children per woman in 1960 to 0.72 in 2023 — an 88% decline and the lowest rate ever recorded for a sovereign country. In 2024 it rose to 0.75, the first increase in nine years. Even after that rise it sits at about a third of the 2.1 children per woman a population needs to replace itself, and well below Japan (1.15), the United States (1.63) and the world average (2.19).
Key findings
- South Korea's fertility rate fell from 6.0 children per woman in 1960 to 0.72 in 2023 — a decline of 88%.
- That 0.72 is the lowest rate ever recorded for a sovereign country; South Korea holds the five lowest values in the series.
- In 2024 the rate rose to 0.75 — the first increase in nine years, the last being in 2015.
- Even after the rise, it is about a third of the 2.1 children per woman needed to replace a population.
- South Korea fell below replacement level in the mid-1980s and has stayed there ever since.
- It is now far below Japan (1.15), the United States (1.63) and the world average (2.19).
- The world as a whole is close to replacement level at 2.19, down from 4.69 in 1960.
Explore the data
Coverage: Jan 1, 1960 – Dec 31, 2024 · South Korea, with global comparison
Free to download and reuse. Get the data behind every new chart →
Sources
Primary source
World Development Indicators
World Bank
Fertility rate, total (births per woman) — SP.DYN.TFRT.IN
Accessed Aug 30, 2026
Compiled by the World Bank from United Nations Population Division estimates and national statistical offices. Retrieved via the World Bank API for South Korea, Japan, the United States and the world aggregate; the record-low claim was tested against all countries and years in the indicator.
Methodology
The figures are the total fertility rate — the number of children a woman would have if she lived through her childbearing years at the age-specific birth rates observed in that year. Data are the World Bank's series SP.DYN.TFRT.IN, compiled from United Nations estimates and national statistical offices. The claim that 0.72 is the lowest rate ever recorded for a country was checked against every observation in the series for all countries and years, 1960–2024: South Korea holds the five lowest values on record among sovereign states. Macao and Hong Kong record lower rates still and are shown as an exception in the notes, because they are special administrative regions of China rather than countries.
What this does not show
The total fertility rate is a snapshot of one year's birth rates, not a forecast of how many children women will actually have. It falls when people postpone births as well as when they have fewer of them, so part of a decline can later be recovered — which is one reason a single year's uptick should not be read as a reversal of the trend. Replacement level is conventionally put at about 2.1 children per woman, but the exact figure depends on child mortality and the sex ratio at birth. Population change also depends on migration and on age structure, neither of which this measure captures.
Creator
Reuse this visualization
Cite this
License: CC BY 4.0
Embed code
<figure style="margin:0;max-width:1600px">
  <a href="https://chartive.org/visualizations/world-fertility-1960-2024" target="_blank" rel="noopener">
    <img src="https://chartive.org/infographics/world-fertility-1960-2024.png" alt="Line chart of children per woman from 1960 to 2024. South Korea's line falls steeply from 6.0 in 1960 to 0.72 in 2023, crossing below the dashed 2.1 replacement line in the mid-1980s, then ticks up to 0.75 in 2024. Context lines end at 2.19 for the world, 1.63 for the United States and 1.15 for Japan. An inset panel magnifies the 2010s, marking the 0.721 low point in 2023 and the rise to 0.748 in 2024." width="1600" height="2133" style="max-width:100%;height:auto" />
  </a>
  <figcaption style="font:14px/1.4 system-ui,sans-serif;color:#57534e;margin-top:8px">
    Graphic by Chartive Editorial, using data from World Development Indicators — via <a href="https://chartive.org/visualizations/world-fertility-1960-2024" target="_blank" rel="noopener">Chartive</a>
  </figcaption>
</figure>
Reuse is welcome — the embed keeps a link back to the source.