Demographics
Verified dataWhere did all the children go?
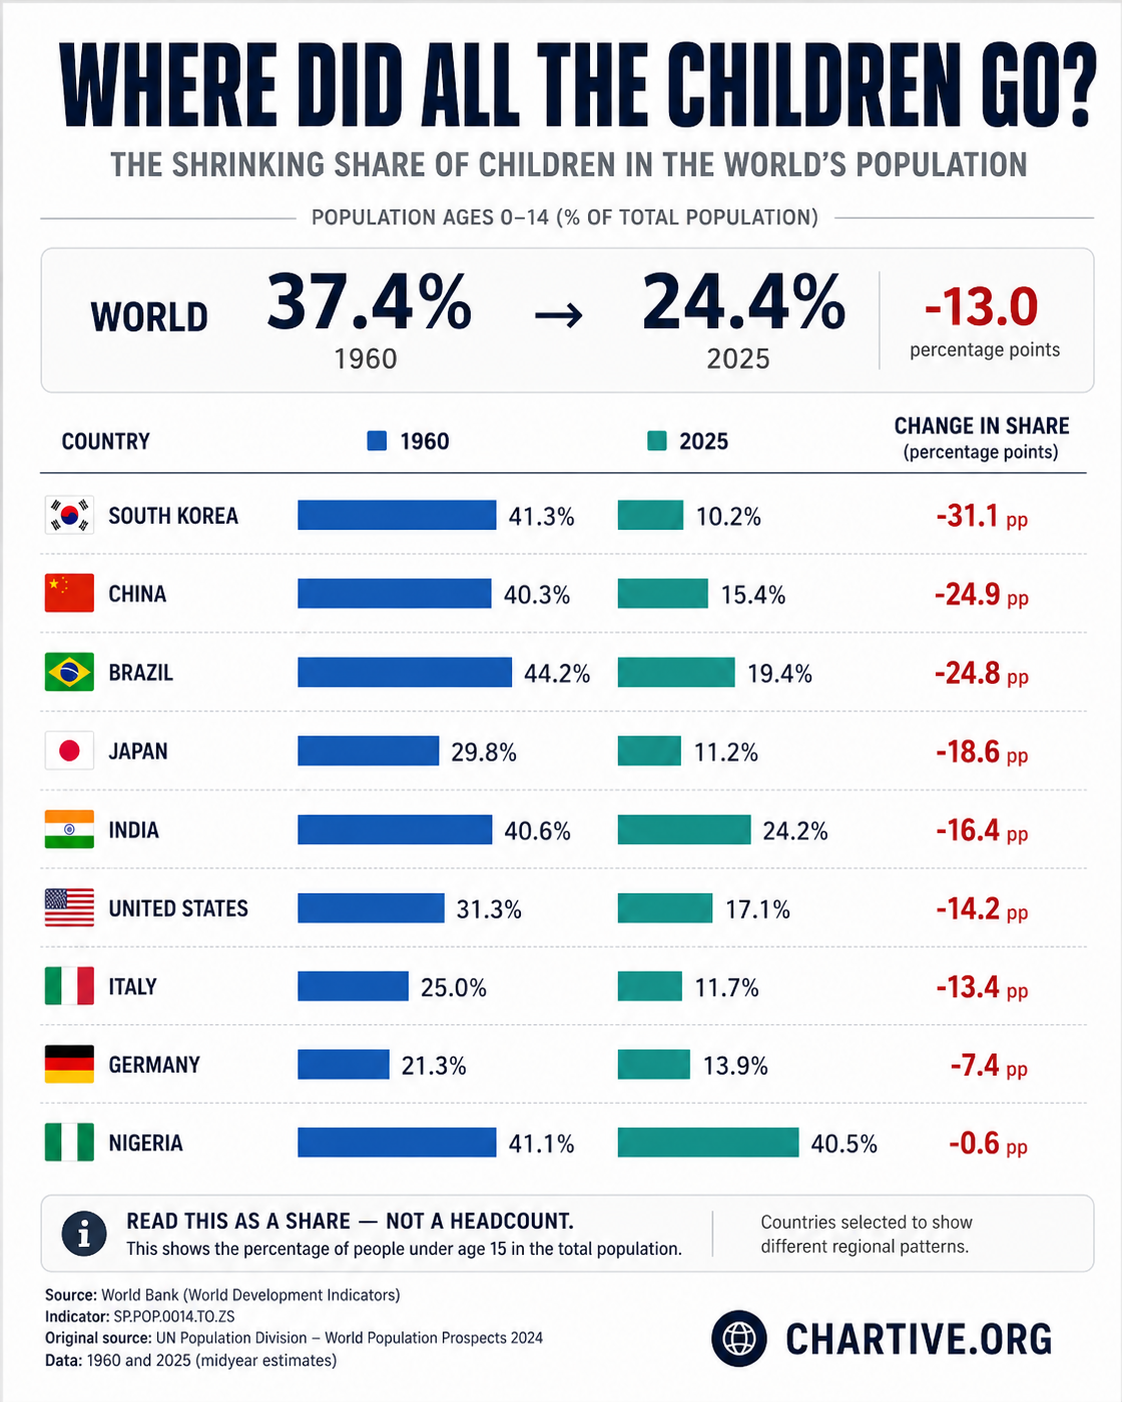
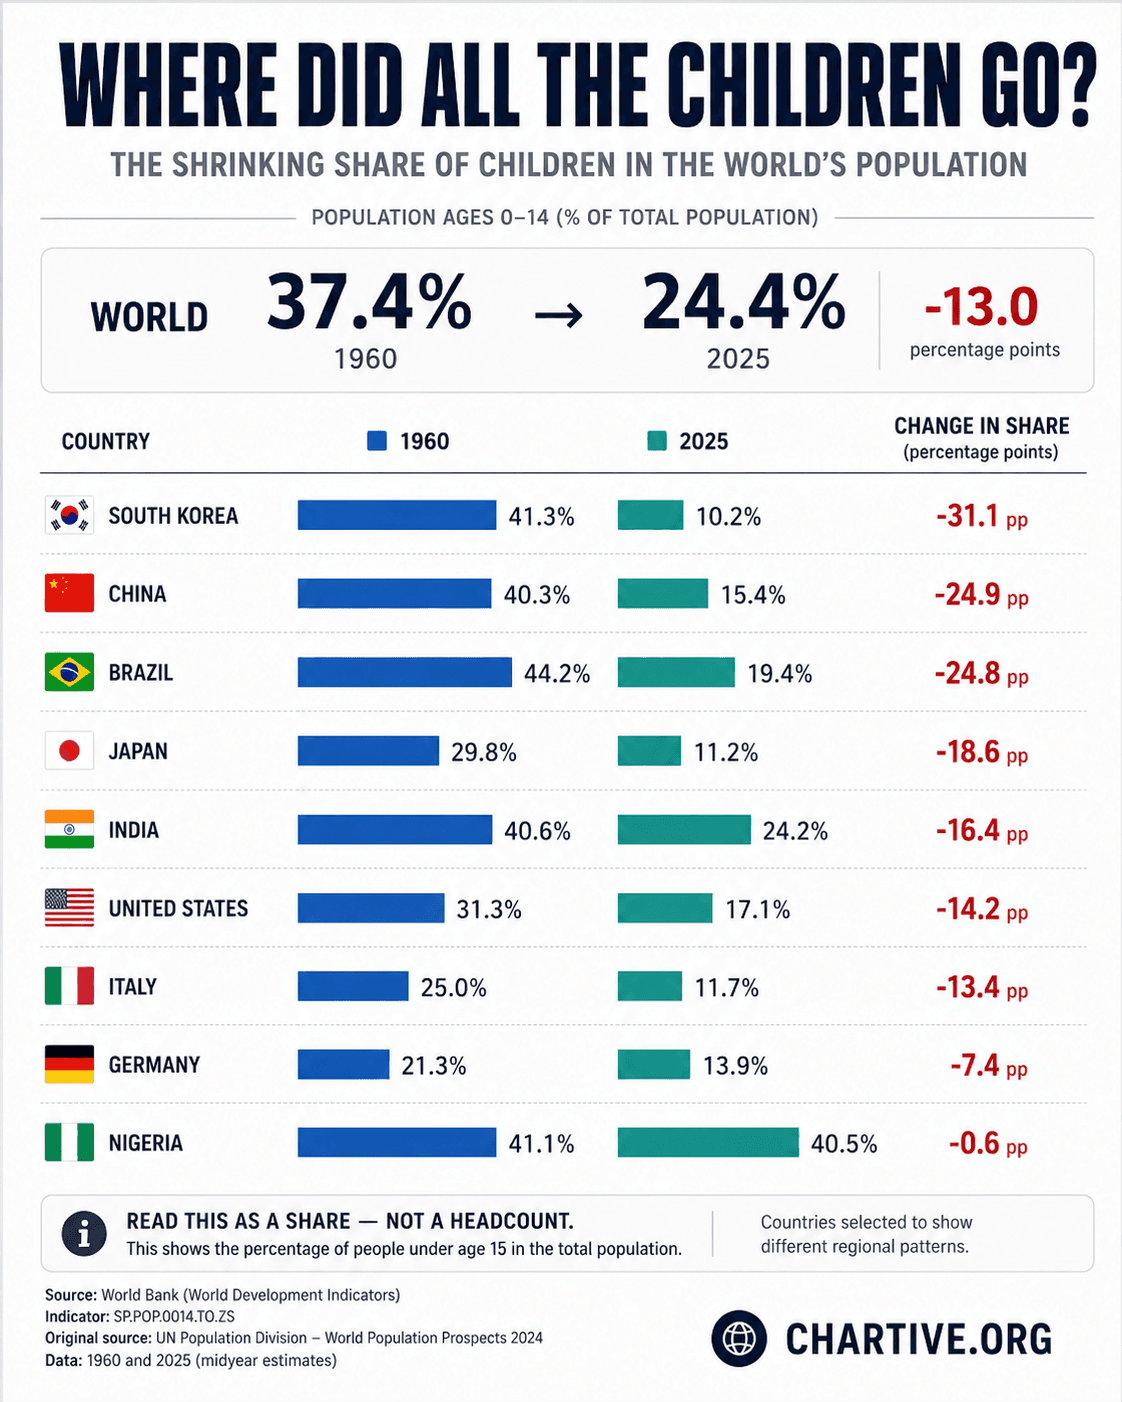
Children made up 37.4% of the world in 1960. In 2025, they make up 24.4%. Population ages 0–14 as a share of total population, selected countries.
CSV · 66 rows · 1960–2025
Children (ages 0–14) fell from 37.4% of the world’s population in 1960 to 24.4% in 2025 — a 13-point drop — with especially steep declines in South Korea, China and Brazil.
Key findings
- Worldwide, children’s share of the population fell 13 points, from 37.4% in 1960 to 24.4% in 2025.
- South Korea saw the steepest drop in this selection: 41.3% → 10.2%, a decline of 31.1 points.
- Nigeria barely changed (41.1% → 40.5%), remaining among the youngest populations.
Explore the data
Coverage: Jan 1, 1960 – Dec 31, 2025 · World and selected countries
Free to download and reuse. Get the data behind every new chart →
Sources
Primary source
World Bank
World Bank — World Development Indicators
Population ages 0–14 (% of total) — SP.POP.0014.TO.ZS
Accessed Aug 14, 2026
Original source: UN Population Division, World Population Prospects. Midyear estimates, 1960 & 2025.
Methodology
Share of each country’s total population aged 0–14, from the World Bank World Development Indicators (series SP.POP.0014.TO.ZS; original source: UN Population Division, World Population Prospects). Midyear estimates for 1960 and 2025, rounded to one decimal point.
What this does not show
This is a share, not a headcount: a falling percentage does not necessarily mean the absolute number of children fell — total populations grew substantially over the period.
Creator
Reuse this visualization
Cite this
License: CC BY 4.0
Embed code
<figure style="margin:0;max-width:1122px">
  <a href="https://chartive.org/visualizations/where-did-all-the-children-go-1960-2025" target="_blank" rel="noopener">
    <img src="https://chartive.org/infographics/children-world-1960-2025.png" alt="Table and bars showing the share of population aged 0–14 in 1960 vs 2025 for selected countries; South Korea falls from 41.3% to 10.2%." width="1122" height="1402" style="max-width:100%;height:auto" />
  </a>
  <figcaption style="font:14px/1.4 system-ui,sans-serif;color:#57534e;margin-top:8px">
    Graphic by Chartive Editorial, using data from World Bank — via <a href="https://chartive.org/visualizations/where-did-all-the-children-go-1960-2025" target="_blank" rel="noopener">Chartive</a>
  </figcaption>
</figure>
Reuse is welcome — the embed keeps a link back to the source.