Health
Verified dataThere is no country on earth where men outlive women
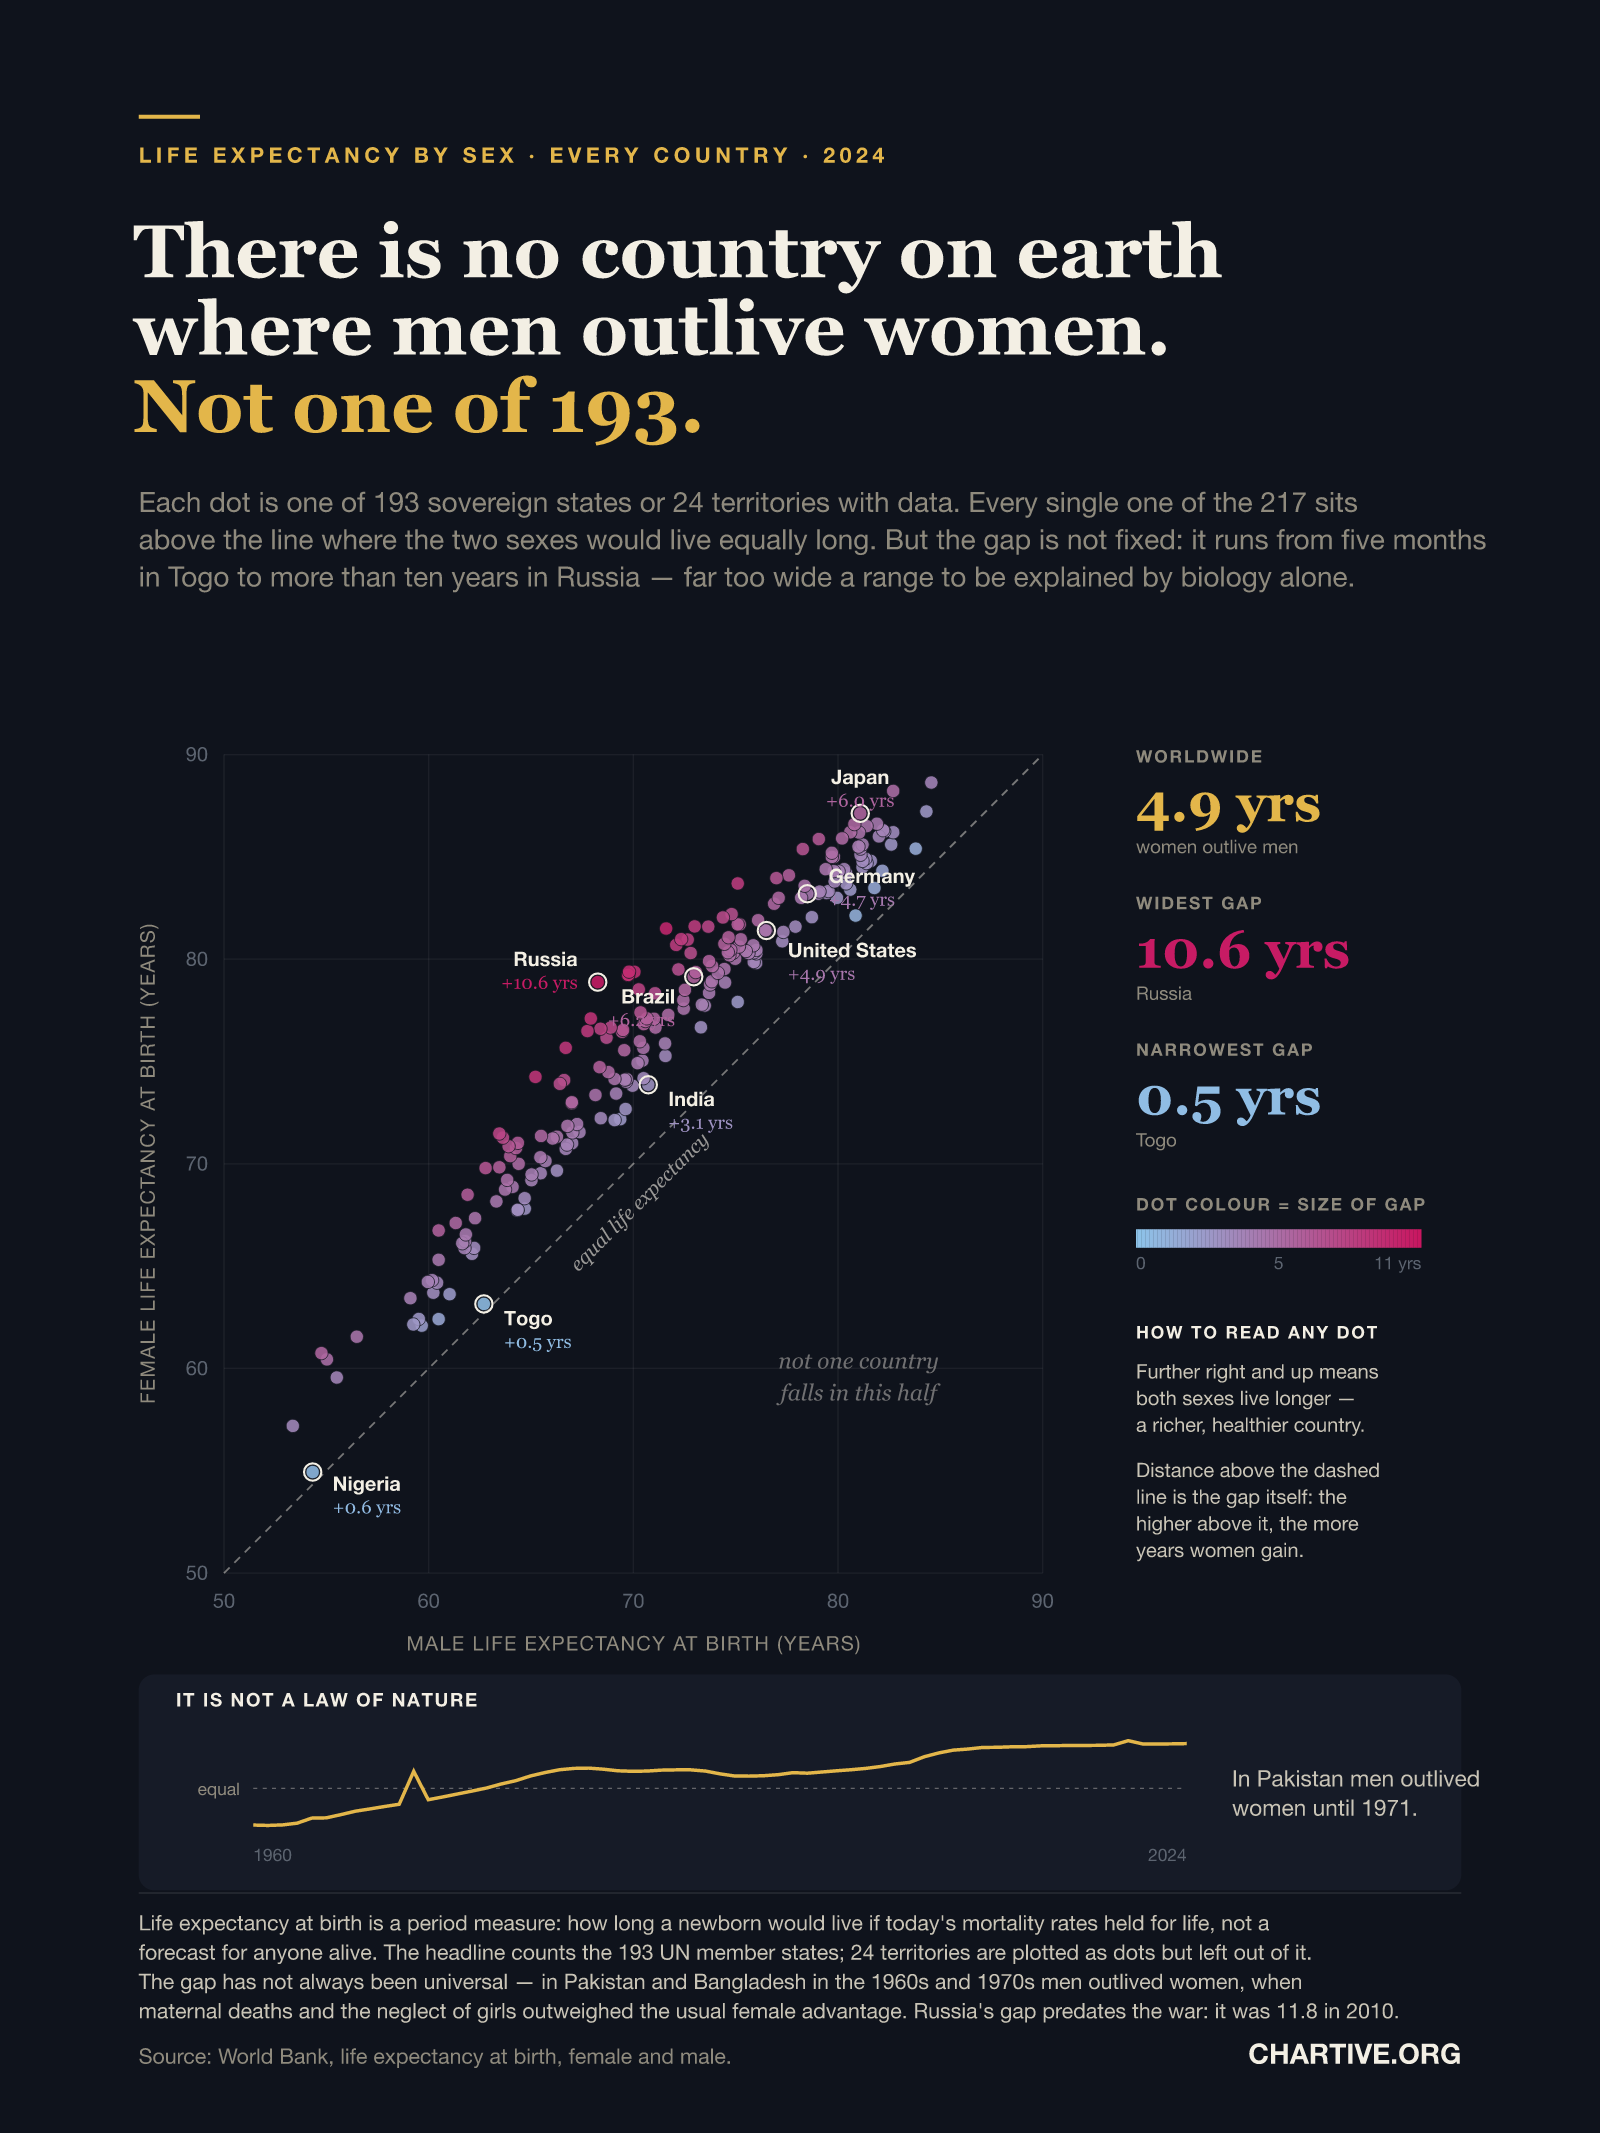
Each dot is one of 193 sovereign states or 24 territories with data. Every single one of the 217 sits above the line where the two sexes would live equally long — but the gap runs from five months in Togo to more than ten years in Russia.
CSV · 283 rows · 2024
Women outlive men in every country on earth. Across 193 UN member states and 24 territories with 2024 data, there is not one exception. What varies enormously is the size of the advantage: five months in Togo and six months in Nigeria, against 10.6 years in Russia — a twentyfold range. A gap that differs that much between countries cannot be explained by biology alone, and it has not always existed everywhere: in Pakistan men outlived women until 1971.
Key findings
- Women outlive men in all 193 UN member states and all 24 territories with 2024 data — 217 out of 217.
- Worldwide the gap is 4.9 years.
- It is widest in Russia at 10.6 years, where men reach 68.3 and women 78.9.
- It is narrowest in Togo at 0.5 years and Nigeria at 0.6 — a twentyfold range across countries.
- Japan has both the longest male life expectancy (81.1) and the longest female (87.1), with a gap of 6.0 years.
- Large economies cluster between three and six years: India 3.1, Germany 4.7, the United States 4.9, China 5.7, Brazil 6.2.
- Russia's gap is not a consequence of the war — it was 11.8 years in 2010 and 9.0 in 2021.
- The gap is not universal across history: in Pakistan men outlived women every year until 1971.
Explore the data
Coverage: Jan 1, 2024 – Dec 31, 2024 · World
Free to download and reuse. Get the data behind every new chart →
Sources
Primary source
World Development Indicators
World Bank
Life expectancy at birth, female and male — SP.DYN.LE00.FE.IN, SP.DYN.LE00.MA.IN
Accessed Aug 30, 2026
Retrieved via the World Bank API for 2024, plus the full Pakistan series from 1960 for the inset and the world aggregate for the headline figure.
Methodology
Each dot plots a country's male life expectancy at birth against its female life expectancy, both from the World Bank for 2024 (series SP.DYN.LE00.MA.IN and SP.DYN.LE00.FE.IN). The dashed diagonal marks where the two would be equal; every entity with data falls above it. Dot colour encodes the size of the gap rather than a category, with a key on the chart. Of the 217 entities plotted, 193 are UN member states and 24 are territories such as Hong Kong, Puerto Rico and Greenland; the headline count refers only to the 193, and the dataset labels each row accordingly. The world figure of 4.9 years is the World Bank's own world aggregate, not an average of the plotted points. The inset traces Pakistan's gap for every year from 1960 to 2024.
What this does not show
Life expectancy at birth is a period measure: it is how long a newborn would live if the mortality rates of that year applied for their whole life. It is not a forecast for anyone currently alive, and it is heavily influenced by deaths in infancy. The universality of the gap should not be read as a biological constant — in Pakistan men outlived women until 1971 and in Bangladesh into the 1980s, when maternal mortality and the neglect of girls outweighed the usual female advantage. Nor is the widest gap a war effect: Russia's stood at 11.8 years in 2010 and 9.0 in 2021, so it long predates 2022. Figures for small territories and for countries with weak civil registration are modelled estimates with wide uncertainty.
Creator
Reuse this visualization
Cite this
License: CC BY 4.0
Embed code
<figure style="margin:0;max-width:1600px">
  <a href="https://chartive.org/visualizations/life-expectancy-gap-2024" target="_blank" rel="noopener">
    <img src="https://chartive.org/infographics/life-expectancy-gap-2024.png" alt="Scatter plot of male against female life expectancy at birth for 217 countries and territories in 2024, both axes running from 50 to 90 years. A dashed diagonal marks equal life expectancy. Every dot lies above it, so women outlive men everywhere; the lower half of the chart is empty and labelled accordingly. Dots are coloured by the size of the gap, from pale blue at zero to deep pink at eleven years. Russia is furthest above the line at 10.6 years, Togo closest at 0.5 and Nigeria at 0.6. Japan sits top right at 81.1 years for men and 87.1 for women. An inset below shows Pakistan's gap crossing from negative to positive in 1971." width="1600" height="2133" style="max-width:100%;height:auto" />
  </a>
  <figcaption style="font:14px/1.4 system-ui,sans-serif;color:#57534e;margin-top:8px">
    Graphic by Chartive Editorial, using data from World Development Indicators — via <a href="https://chartive.org/visualizations/life-expectancy-gap-2024" target="_blank" rel="noopener">Chartive</a>
  </figcaption>
</figure>
Reuse is welcome — the embed keeps a link back to the source.