Health
Verified dataIn 1980, one in twenty adults had obesity. Today it is one in six.
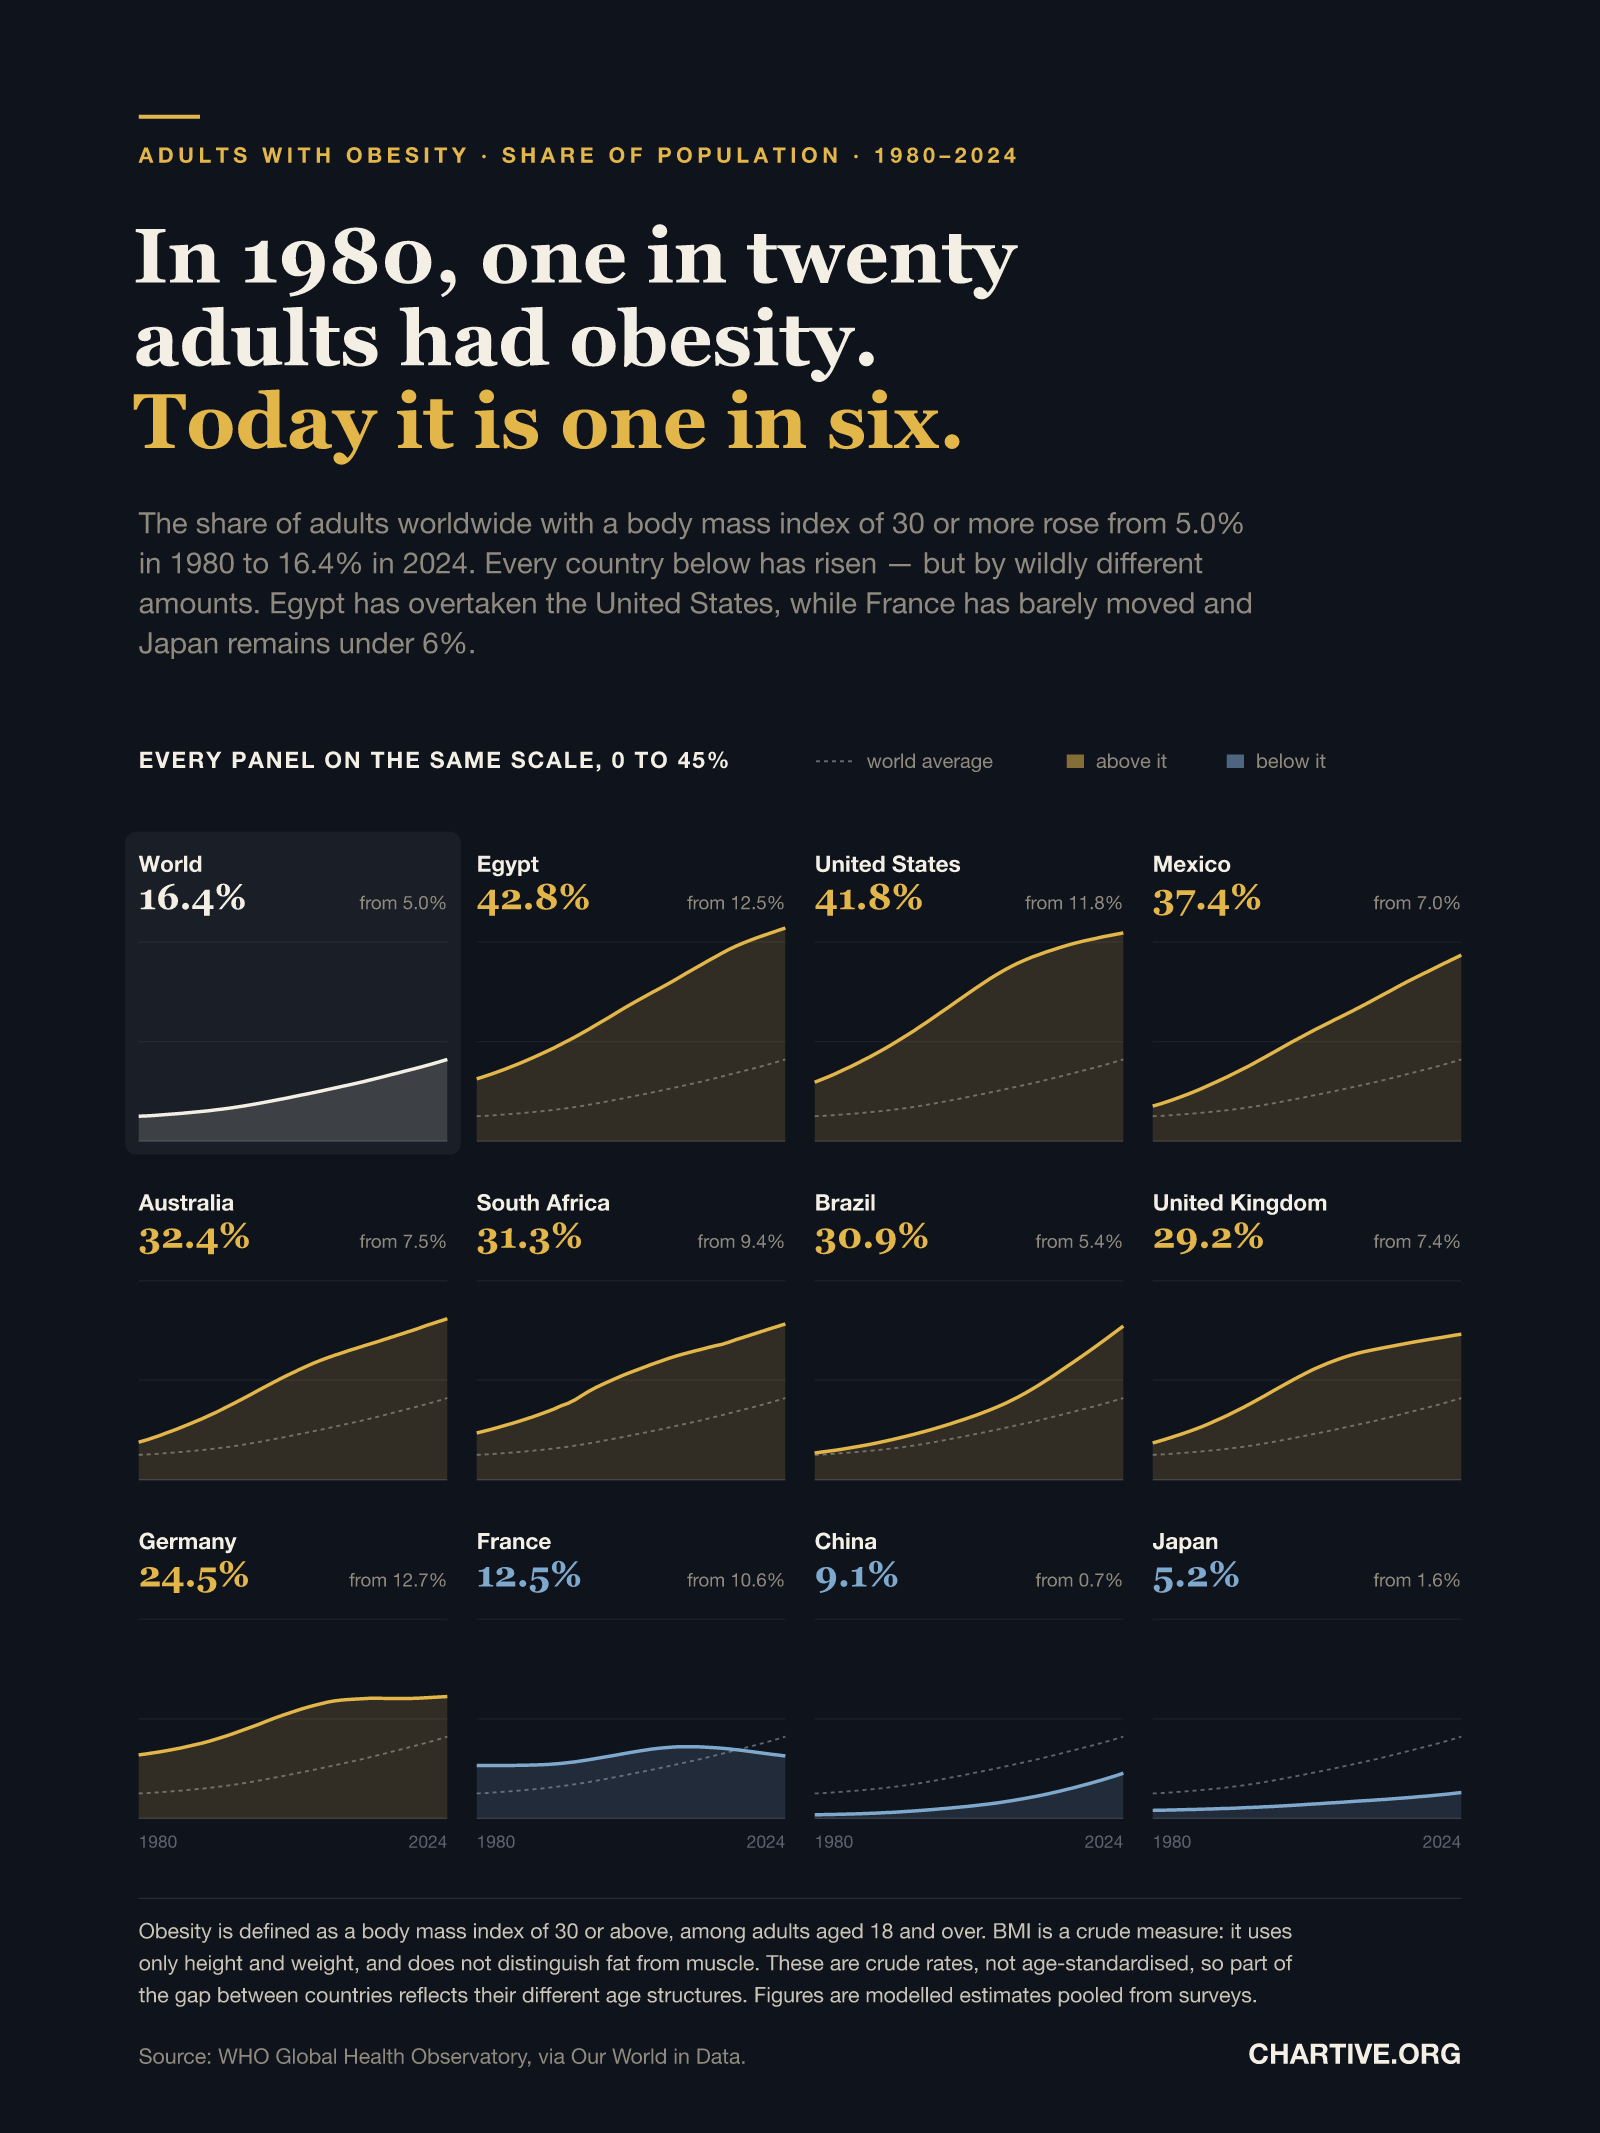
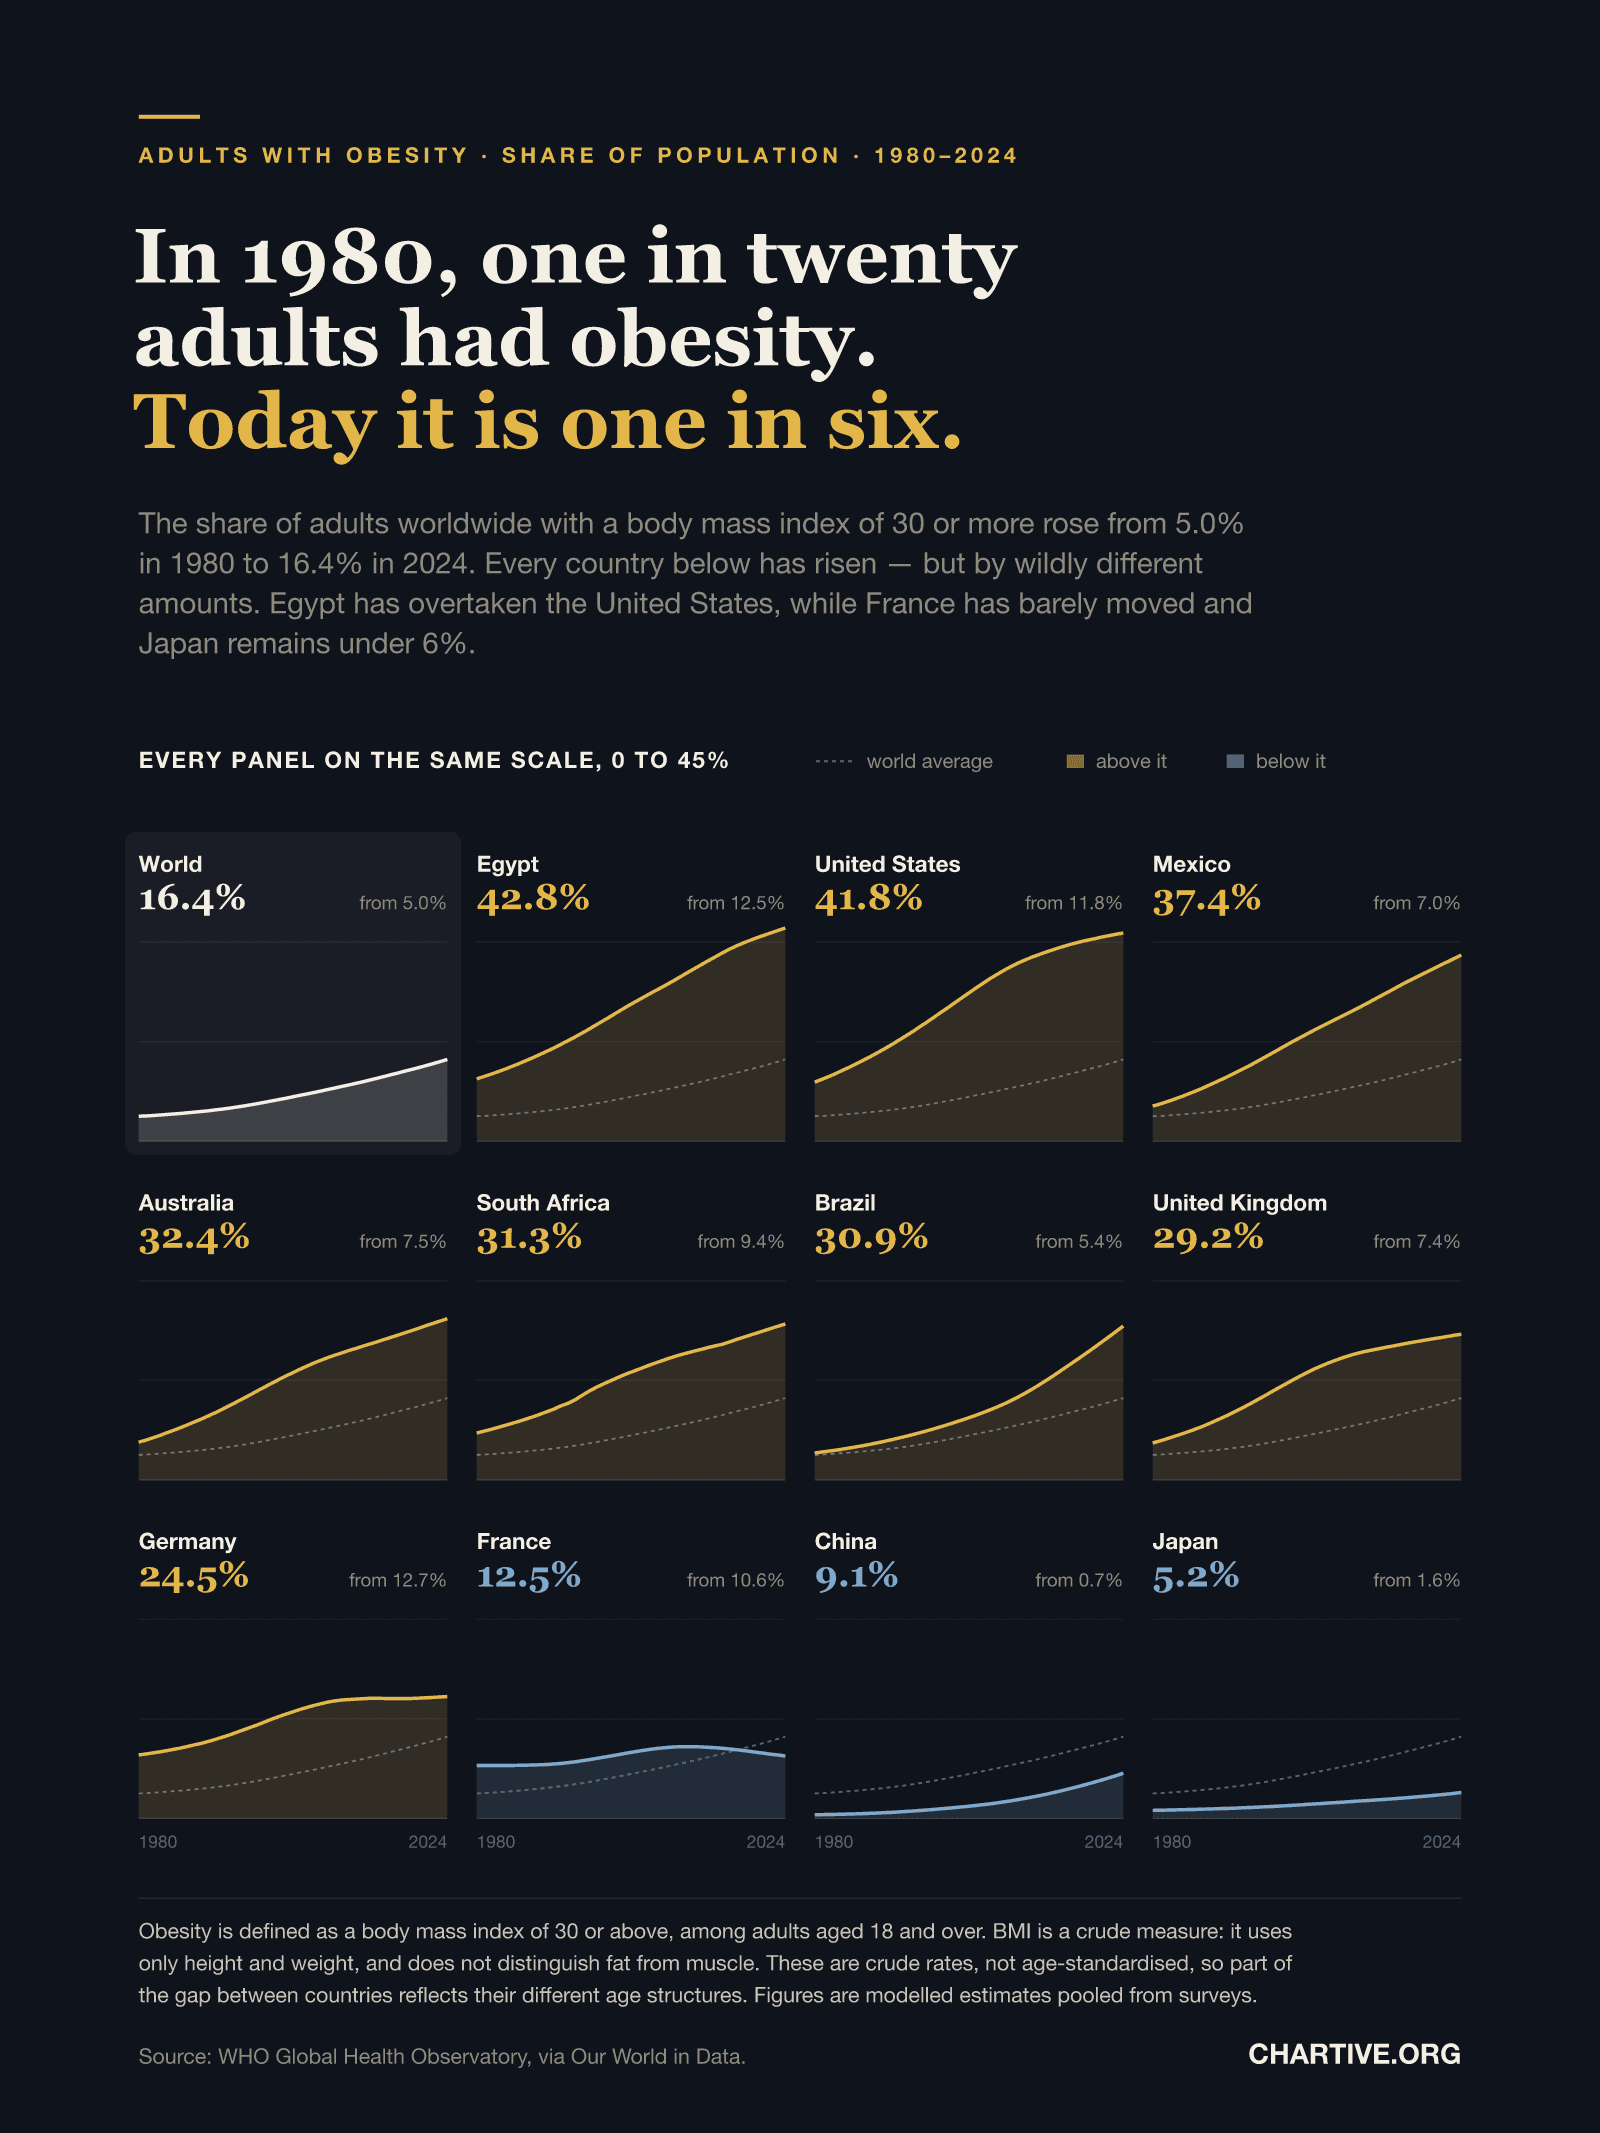
The share of adults worldwide with a body mass index of 30 or more rose from 5.0% in 1980 to 16.4% in 2024. Every country has risen — but by wildly different amounts.
CSV · 45 rows · 1980–2024
Global adult obesity more than tripled between 1980 and 2024, from 5.0% to 16.4% of adults. The spread between countries is enormous and does not follow income alone: Egypt (42.8%) has overtaken the United States (41.8%), Mexico is at 37.4%, while France rose barely two points in 44 years to 12.5% and Japan remains at 5.2%. The fastest relative growth is in Asia, where China went from 0.7% to 9.1% and India from 0.3% to 8.0%.
Key findings
- The share of adults worldwide with obesity more than tripled, from 5.0% in 1980 to 16.4% in 2024.
- Egypt has overtaken the United States — 42.8% against 41.8% — having passed it in 2020.
- Mexico (37.4%), Australia (32.4%), South Africa (31.3%) and Brazil (30.9%) all sit near or above 30%.
- France is the rich-country outlier: up just 1.9 percentage points in 44 years, from 10.6% to 12.5%.
- Japan remains lowest of the group at 5.2%, having started at 1.6% in 1980.
- The steepest relative rises are in Asia: China went from 0.7% to 9.1% and India from 0.3% to 8.0%.
- Germany started higher than the United States in 1980 — 12.7% against 11.8% — and is now 17 points below it.
Explore the data
Coverage: Jan 1, 1980 – Dec 31, 2024 · World
Free to download and reuse. Get the data behind every new chart →
Sources
Primary source
Global Health Observatory
World Health Organization
Prevalence of obesity among adults, BMI ≥ 30
Accessed Aug 30, 2026
WHO Global Health Observatory estimates with minor processing by Our World in Data. Crude prevalence among adults aged 18 and over, both sexes.
Methodology
Obesity is defined as a body mass index of 30 kg/m² or above among adults aged 18 and over. Figures are the World Health Organization's Global Health Observatory estimates, accessed through Our World in Data, and are modelled from pooled national measurement surveys. Every panel in the chart uses the same vertical scale, 0 to 45%, so the shapes are directly comparable, and each carries the world average as a dashed reference line. Panels are coloured by whether the country sits above or below that world average in 2024. The figures are crude rates rather than age-standardised ones.
What this does not show
BMI is a blunt instrument: it uses only height and weight, cannot distinguish fat from muscle, and says nothing about where body fat sits — all of which matter for health. Because these are crude rather than age-standardised rates, part of the difference between countries reflects their differing age structures rather than differing behaviour. The estimates are modelled from surveys that vary in coverage and quality between countries and over time, so the long-run trend is far firmer than any individual year or any small gap between two countries. A single threshold at BMI 30 also hides how the whole distribution has shifted.
Creator
Reuse this visualization
Cite this
License: CC BY 4.0
Embed code
<figure style="margin:0;max-width:1600px">
  <a href="https://chartive.org/visualizations/world-obesity-1980-2024" target="_blank" rel="noopener">
    <img src="https://chartive.org/infographics/world-obesity-1980-2024.png" alt="A grid of twelve small line charts showing the share of adults with obesity from 1980 to 2024, all on the same 0 to 45 percent scale, each with the world average as a dashed reference line. The world panel rises from 5.0% to 16.4%. Egypt reaches 42.8%, the United States 41.8%, Mexico 37.4%, Australia 32.4%, South Africa 31.3%, Brazil 30.9%, the United Kingdom 29.2% and Germany 24.5% — all above the world average and drawn in gold. France (12.5%), China (9.1%) and Japan (5.2%) sit below it and are drawn in blue." width="1600" height="2133" style="max-width:100%;height:auto" />
  </a>
  <figcaption style="font:14px/1.4 system-ui,sans-serif;color:#57534e;margin-top:8px">
    Graphic by Chartive Editorial, using data from Global Health Observatory — via <a href="https://chartive.org/visualizations/world-obesity-1980-2024" target="_blank" rel="noopener">Chartive</a>
  </figcaption>
</figure>
Reuse is welcome — the embed keeps a link back to the source.