Health
Verified dataThe world quit smoking faster than almost anyone expected — but not evenly
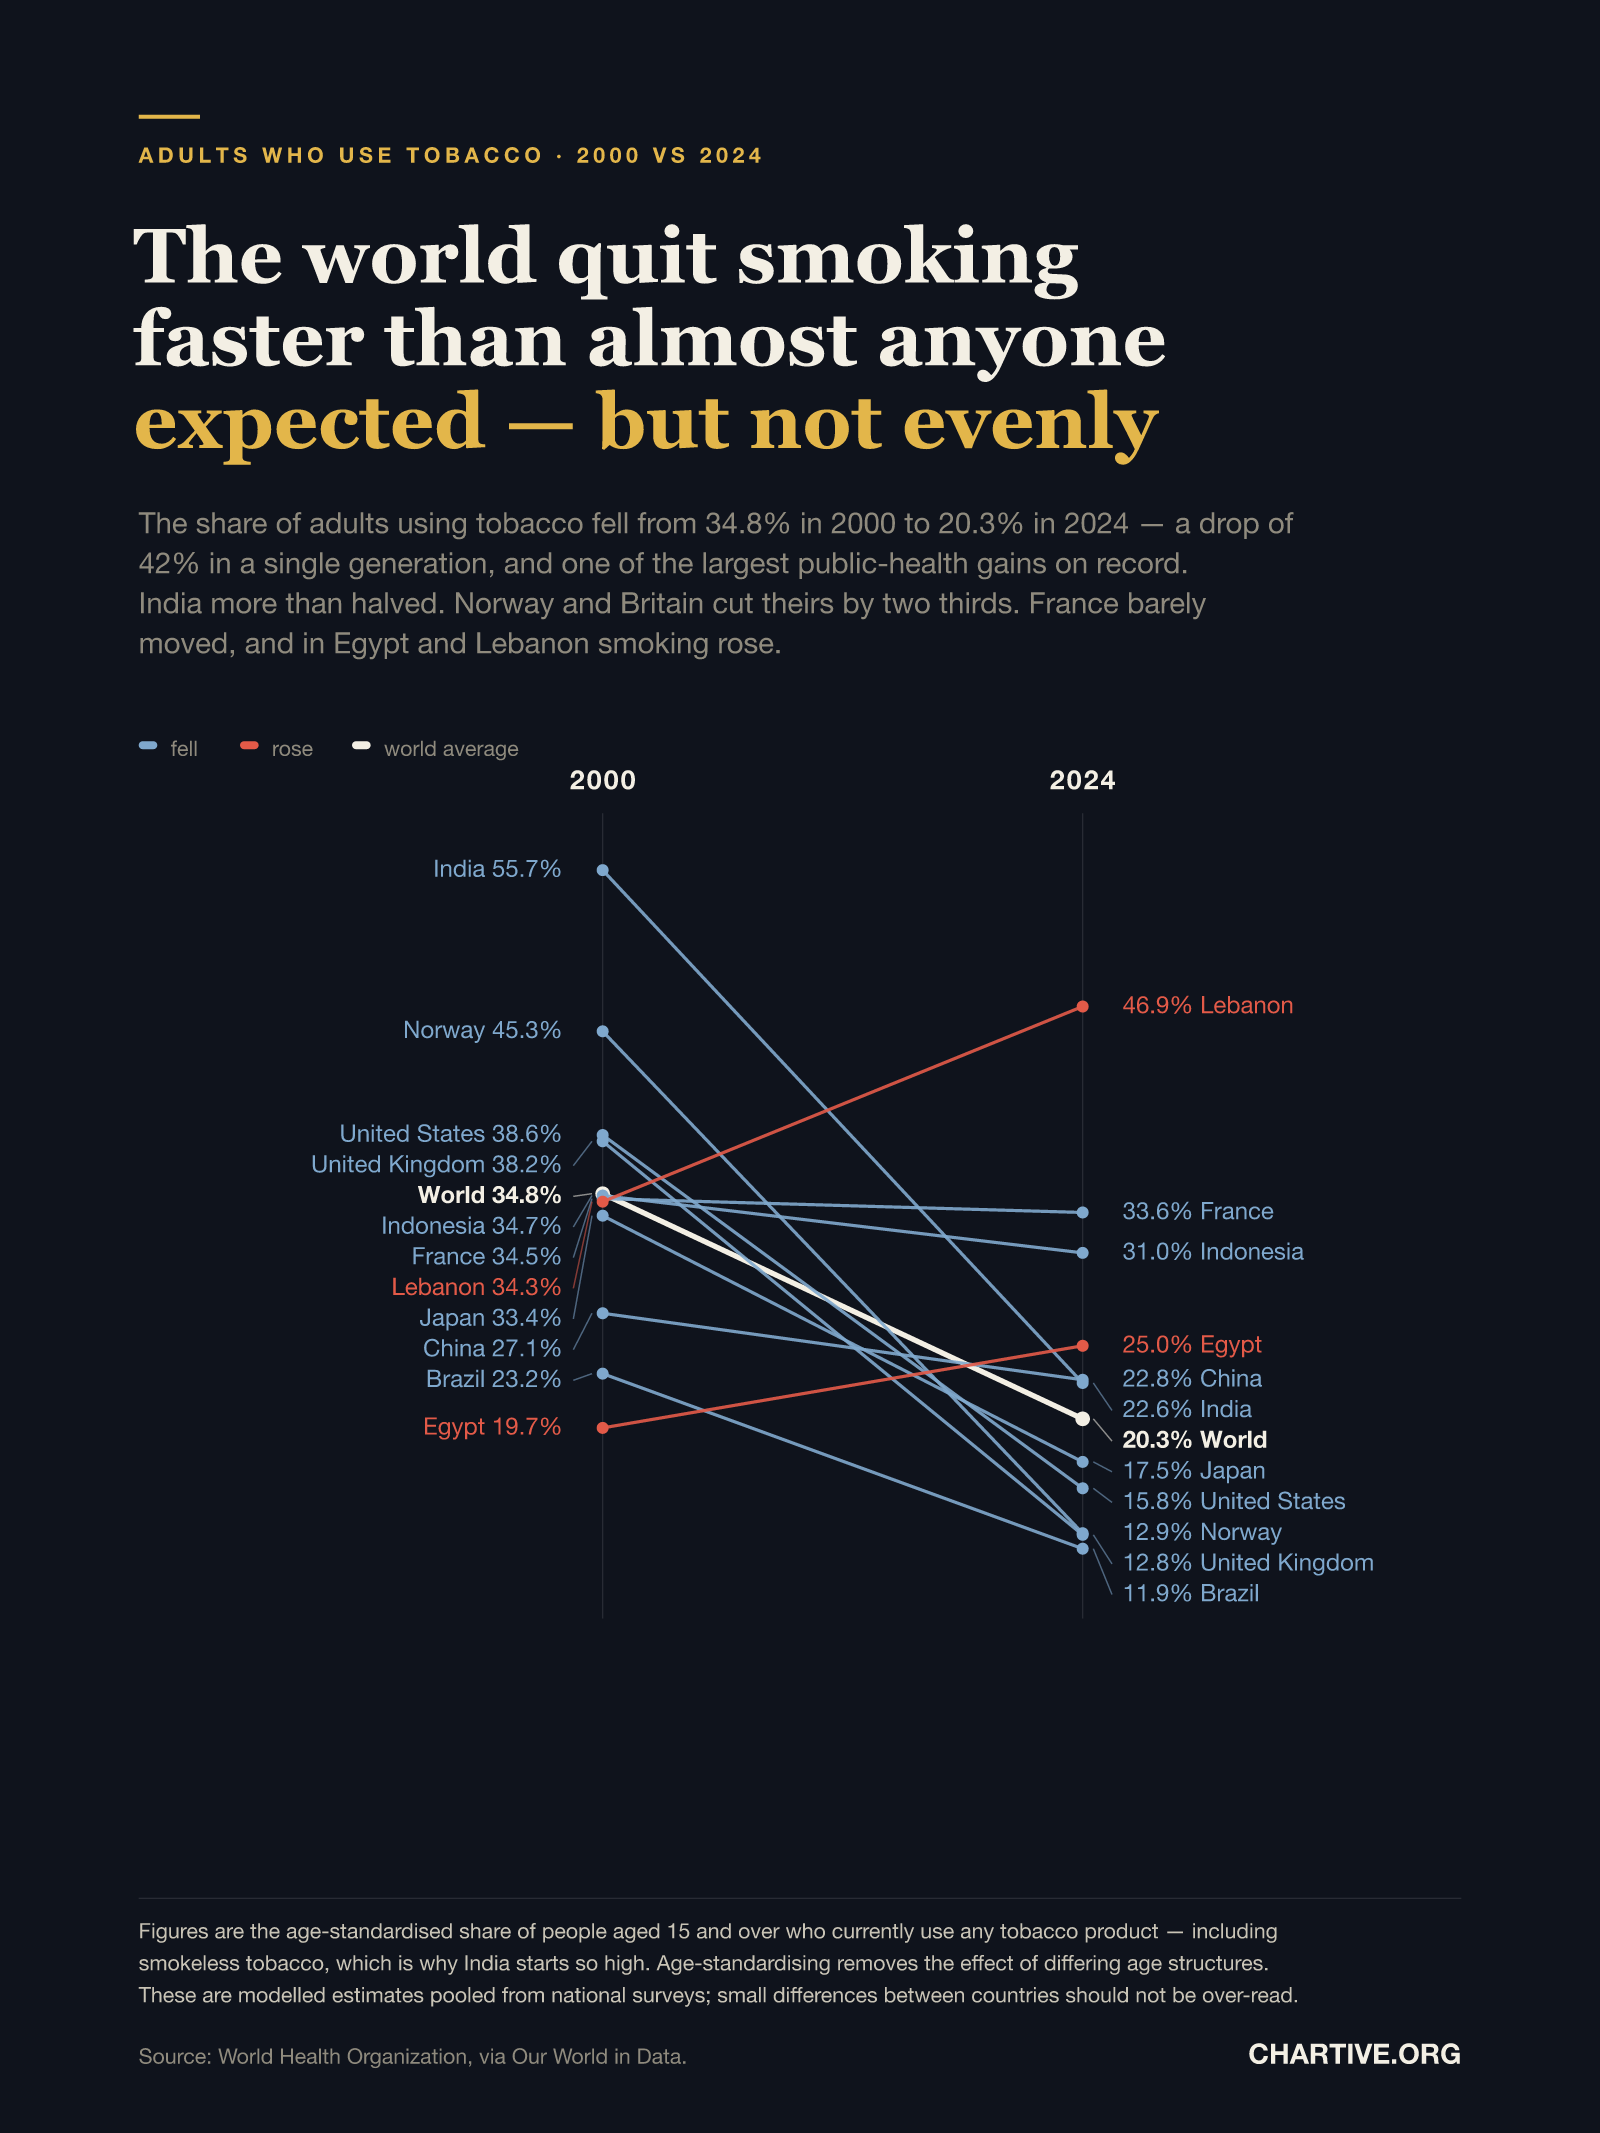
The share of adults using tobacco fell from 34.8% in 2000 to 20.3% in 2024 — a drop of 42% in a single generation. India more than halved, Norway and Britain cut theirs by two thirds, while France barely moved and smoking rose in Egypt and Lebanon.
CSV · 9 rows · 2000–2024
Global adult tobacco use fell from 34.8% to 20.3% between 2000 and 2024, a decline of 42% and one of the largest public-health gains on record. The progress is strikingly uneven: India fell from 55.7% to 22.6% and Norway from 45.3% to 12.9%, while France moved only from 34.5% to 33.6%. In Egypt tobacco use rose from 19.7% to 25.0% and in Lebanon from 34.3% to 46.9%, now the highest of the countries shown.
Key findings
- Global adult tobacco use fell from 34.8% in 2000 to 20.3% in 2024 — a decline of 42%.
- India saw the largest fall of the countries shown, from 55.7% to 22.6%.
- Norway cut its rate by 71% and the United Kingdom by 67%, both to under 13%.
- The United States fell from 38.6% to 15.8%, and Brazil to 11.9% — the lowest shown.
- France is the outlier among rich countries, moving only from 34.5% to 33.6% in 24 years.
- Tobacco use rose in Egypt (19.7% to 25.0%) and Lebanon (34.3% to 46.9%).
- Lebanon now has the highest rate of the countries shown, having overtaken India, Norway and the United States.
Explore the data
Coverage: Jan 1, 2000 – Dec 31, 2024 · World
Free to download and reuse. Get the data behind every new chart →
Sources
Primary source
Global Health Observatory
World Health Organization
Prevalence of current tobacco use, age-standardised
Accessed Aug 30, 2026
WHO age-standardised estimates for adults aged 15 and over, both sexes, with minor processing by Our World in Data.
Methodology
Figures are the World Health Organization's age-standardised estimates of current tobacco use among people aged 15 and over, accessed through Our World in Data. They cover any tobacco product, including smokeless tobacco — which is why India's starting level is so high. Age-standardising removes the effect of countries having differently aged populations, so the comparison is not distorted by demographics. The chart is a slope chart: each country is a single line between its 2000 and 2024 value on a shared scale, coloured by whether the rate fell or rose, with the world average drawn in white. Where labels would overlap they are nudged apart and connected to their point by a thin leader.
What this does not show
These are modelled estimates pooled from national surveys that differ in coverage, wording and quality, so small gaps between countries carry little meaning — the large moves over 24 years are the reliable part. Prevalence counts people, not intensity: a country where fewer people smoke but heavy smokers smoke more will still show a fall. The measure covers tobacco, so it does not capture the shift to vaping and nicotine pouches, which is substantial in several of the countries that show the steepest declines. Eleven countries were chosen to span the range of outcomes and are not a representative sample of the world.
Creator
Reuse this visualization
Cite this
License: CC BY 4.0
Embed code
<figure style="margin:0;max-width:1600px">
  <a href="https://chartive.org/visualizations/world-smoking-2000-2024" target="_blank" rel="noopener">
    <img src="https://chartive.org/infographics/world-smoking-2000-2024.png" alt="A slope chart comparing the share of adults using tobacco in 2000 and 2024. Most lines fall steeply and are drawn in blue: India from 55.7% to 22.6%, Norway 45.3% to 12.9%, the United States 38.6% to 15.8%, the United Kingdom 38.2% to 12.8%, Japan 33.4% to 17.5%, China 27.1% to 22.8% and Brazil 23.2% to 11.9%. France is almost flat at 34.5% to 33.6% and Indonesia 34.7% to 31.0%. Two red lines rise: Egypt from 19.7% to 25.0% and Lebanon from 34.3% to 46.9%. A thick white line shows the world average falling from 34.8% to 20.3%." width="1600" height="2133" style="max-width:100%;height:auto" />
  </a>
  <figcaption style="font:14px/1.4 system-ui,sans-serif;color:#57534e;margin-top:8px">
    Graphic by Chartive Editorial, using data from Global Health Observatory — via <a href="https://chartive.org/visualizations/world-smoking-2000-2024" target="_blank" rel="noopener">Chartive</a>
  </figcaption>
</figure>
Reuse is welcome — the embed keeps a link back to the source.