Health
Verified dataA family health plan costs $2,249 a month. The payslip shows $571.
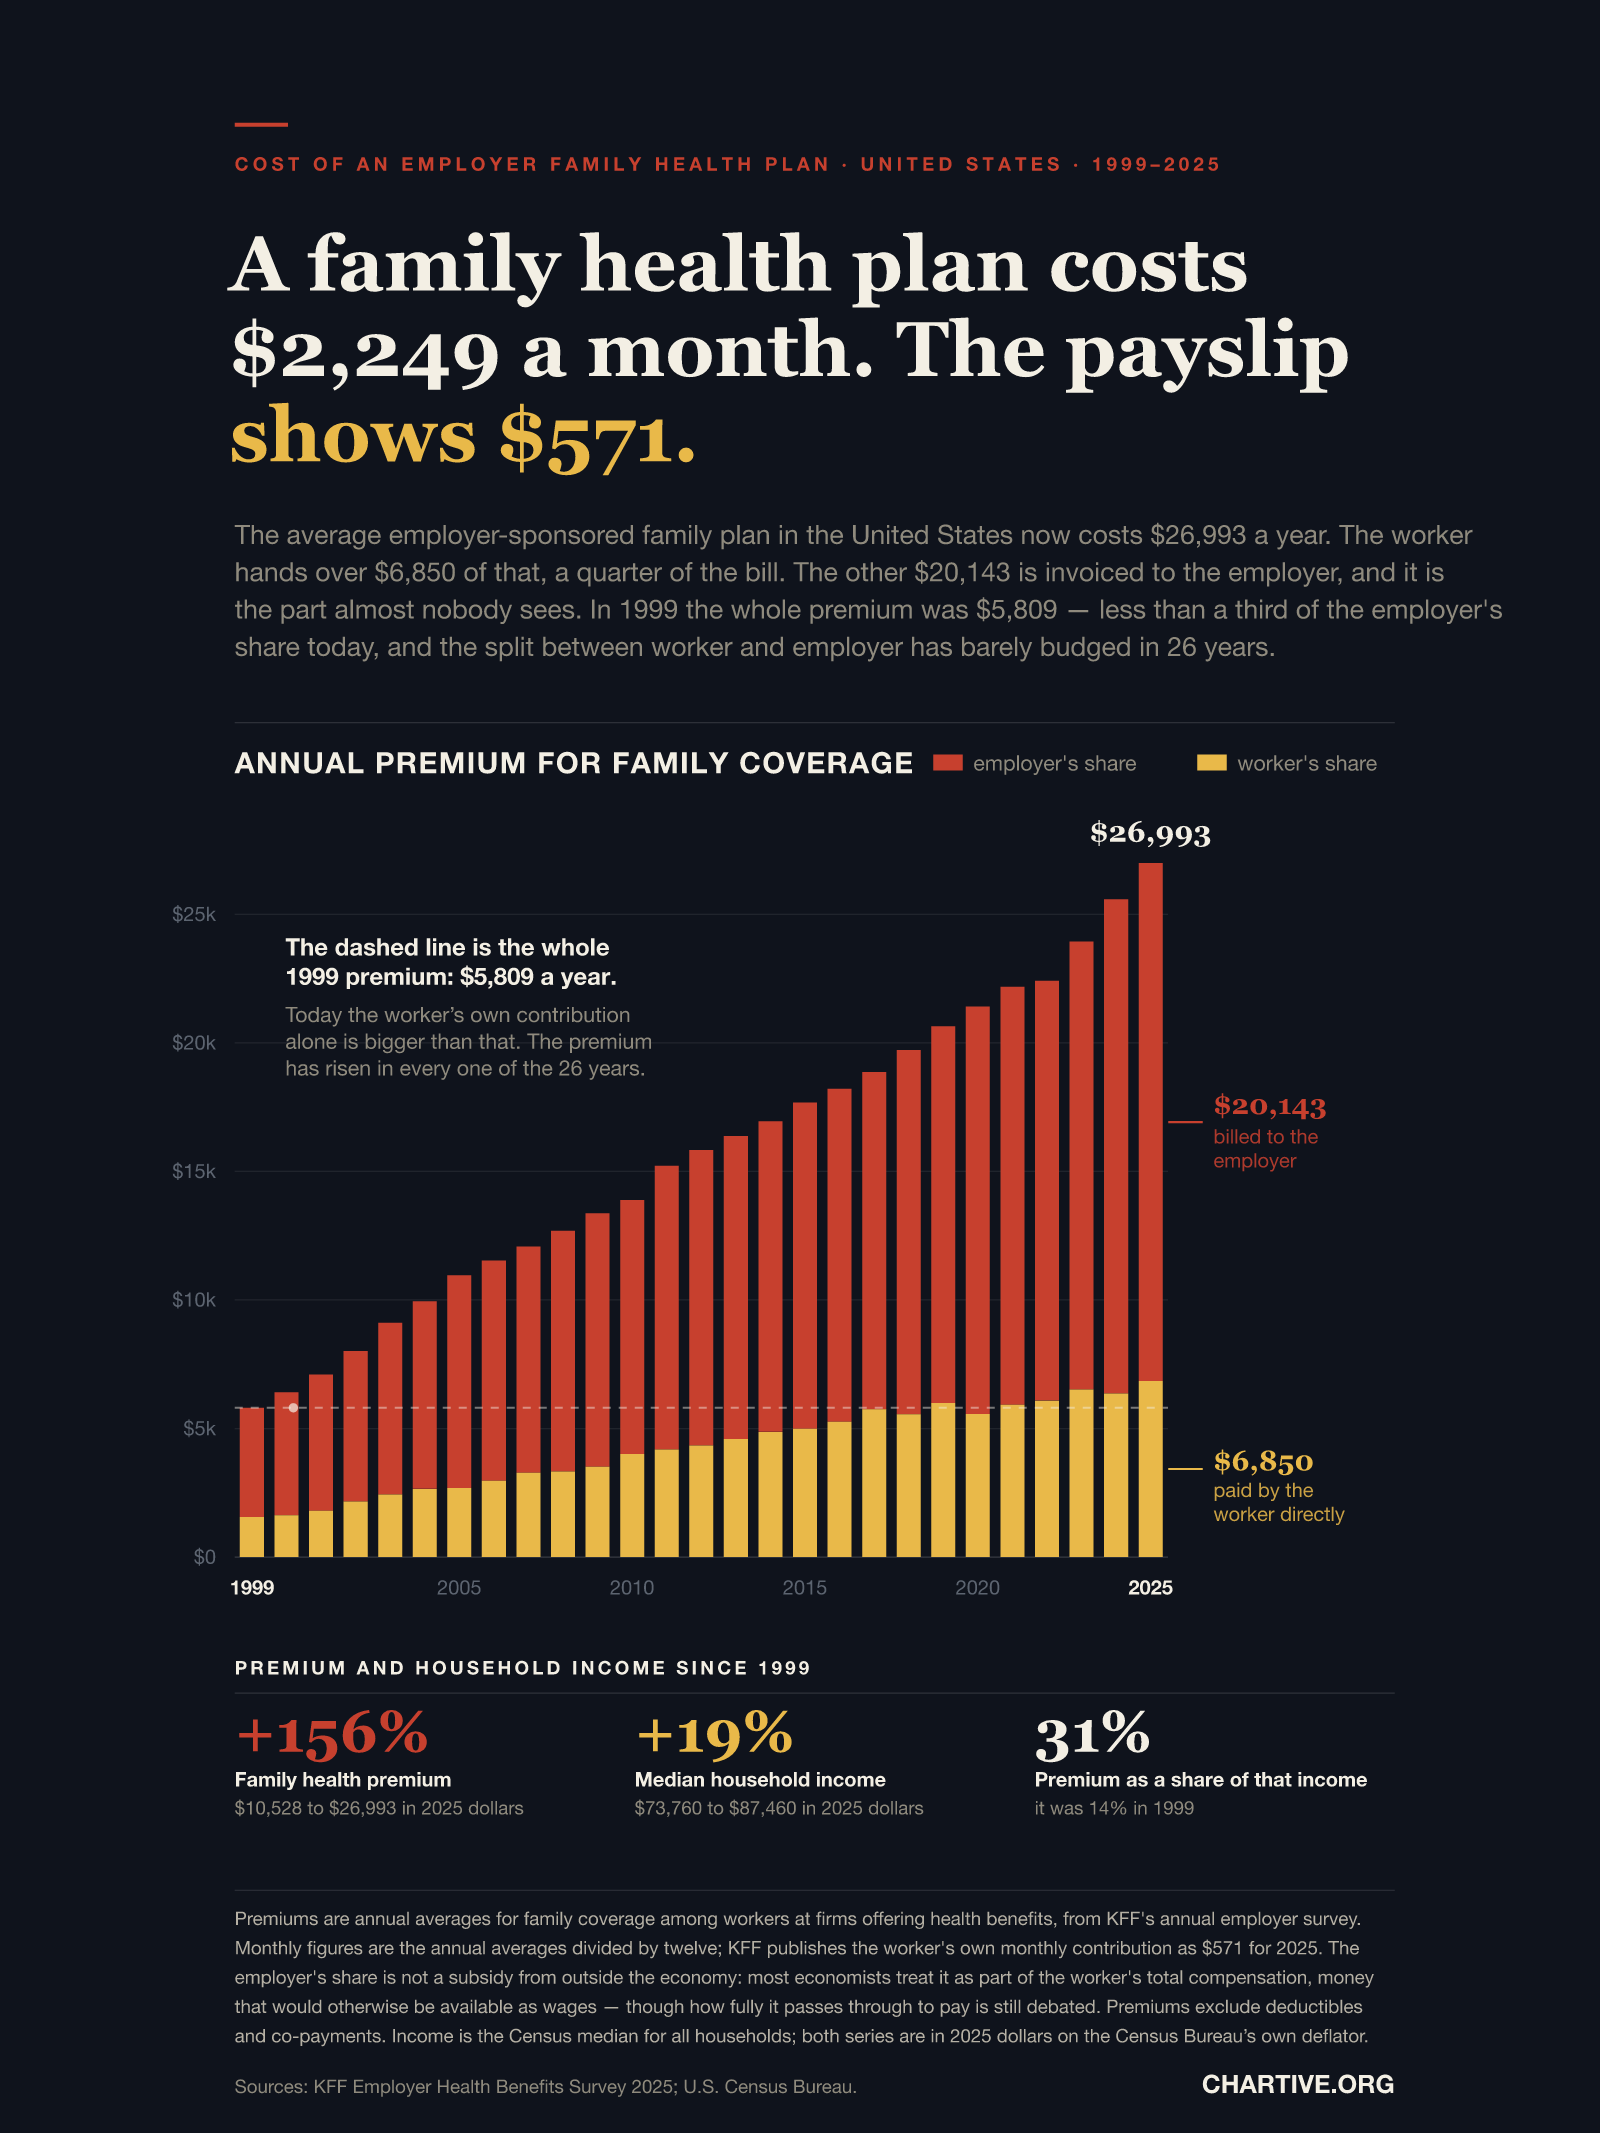
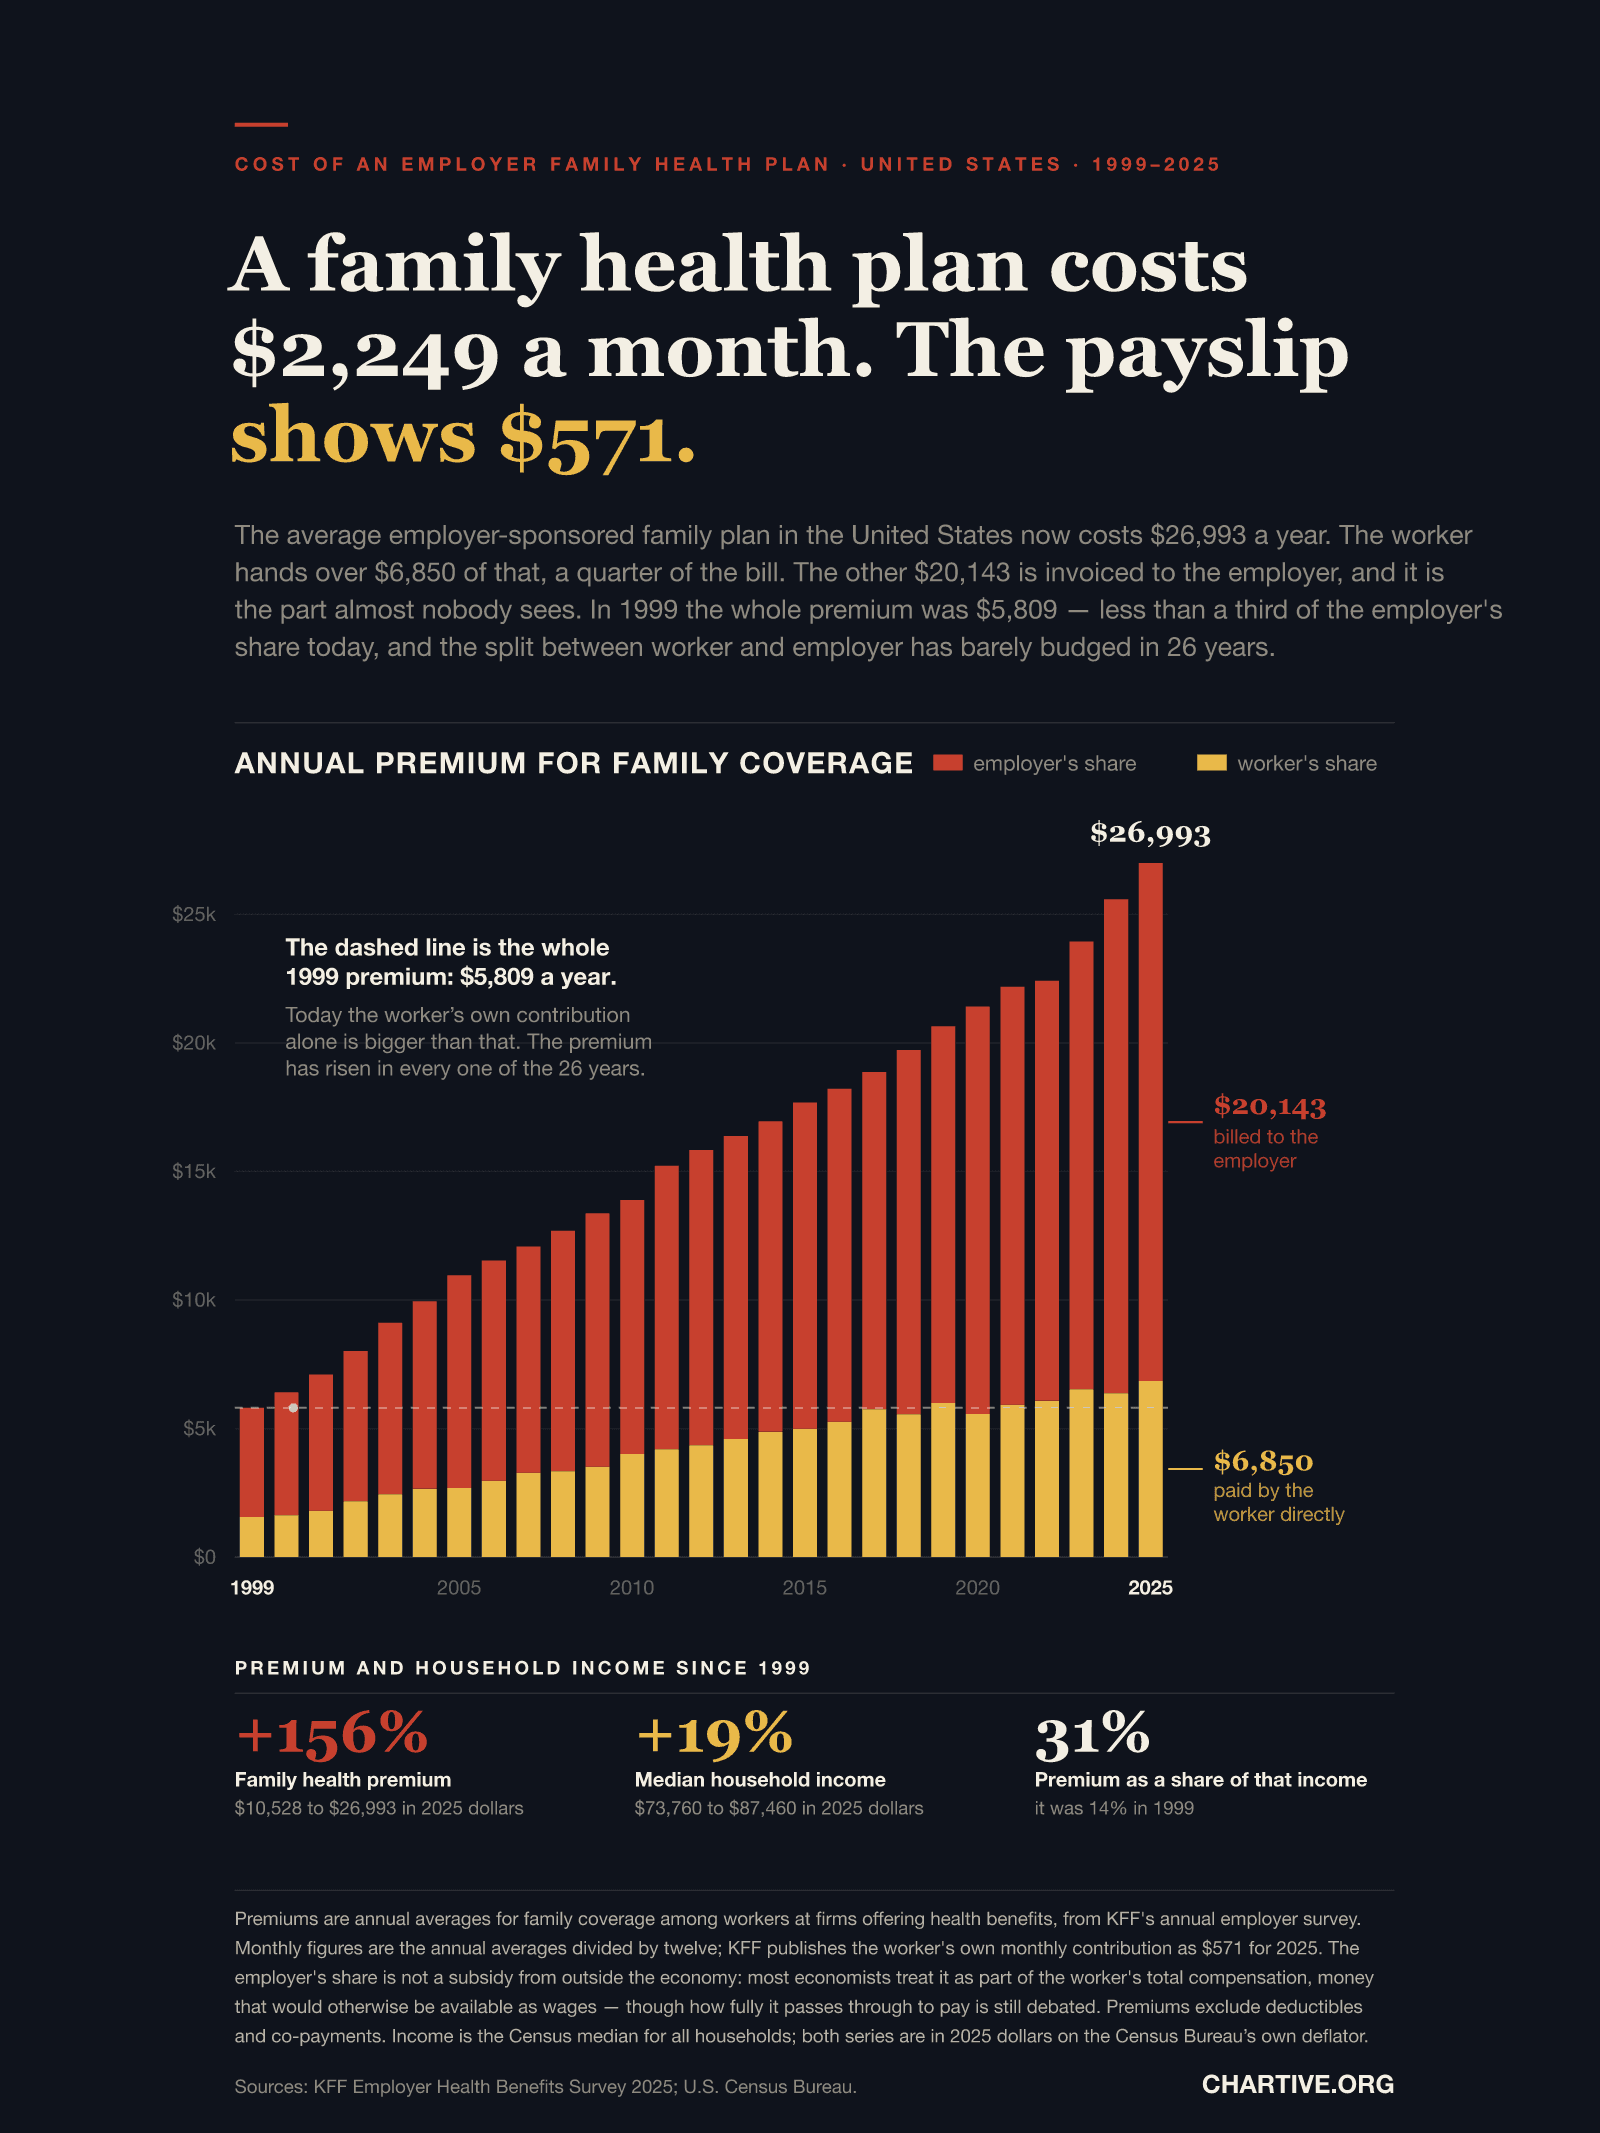
The average employer-sponsored family health plan in the United States now costs $26,993 a year. The worker hands over $6,850 of that directly; the other $20,143 is invoiced to the employer and almost nobody sees it.
CSV · 27 rows · 1999–2025
An employer family health plan in the United States cost $26,993 in 2025, or $2,249 a month. The worker's own contribution was $6,850 a year — $571 a month, the only part that appears on a payslip. The remaining $20,143 goes to the insurer on the employer's invoice. In 1999 the entire premium was $5,809, less than a third of today's employer share, and the worker's own contribution today is larger than that whole 1999 premium. Expressed in 2025 dollars the premium has risen 156% since 1999 while the median household's income rose 19%. The premium now equals 31% of the median household income; in 1999 it was 14%.
Key findings
- The average employer family health plan cost $26,993 in 2025 — $2,249 a month.
- The worker's own share was $6,850 a year, or $571 a month, the only part visible on a payslip.
- The remaining $20,143 a year, $1,679 a month, is billed to the employer.
- In 1999 the entire premium was $5,809, less than a third of today's employer share alone.
- The worker's own contribution today is larger than the whole premium was in 1999.
- In 2025 dollars the premium rose 156% between 1999 and 2025; median household income rose 19%.
- The premium equals 31% of the median household's income, against 14% in 1999.
- The premium has risen in every one of the 26 years, without a single pause.
- The split has barely moved: workers paid 27% of the family premium in 1999 and 26% in 2025.
Explore the data
Coverage: Jan 1, 1999 – Dec 31, 2025 · United States
Free to download and reuse. Get the data behind every new chart →
Sources
Primary source
KFF
KFF (Kaiser Family Foundation)
2025 Employer Health Benefits Survey
Accessed Oct 11, 2026
Worker and employer contributions and total premiums for family coverage, 1999–2025, from the Section 6 data tables (Figure 6.5), cross-checked against the Section 1 tables (Figure 1.12). Figures for 1999–2017 come from the Kaiser/HRET Survey of Employer-Sponsored Health Benefits.
Primary source
U.S. Census Bureau
U.S. Census Bureau
Median household income in the United States
Accessed Oct 11, 2026
Nominal and real median household income, used for the share-of-income figures and as the source of the price adjustment that puts both series in 2025 dollars.
Methodology
Each column is one year's average annual premium for family coverage among workers at firms that offer health benefits, taken from KFF's annual employer survey (Figure 6.5 of the 2025 edition; the 1999–2017 figures come from the predecessor Kaiser/HRET survey). The column is stacked: the worker's own premium contribution sits at the base and the part billed to the employer above it. Monthly figures divide the annual averages by twelve; KFF separately publishes the worker's monthly contribution as $571 for 2025, which matches. Because the axis is a dollar amount starting at zero, no part of the scale is cut off. For the inflation comparison both the premium and median household income are expressed in 2025 dollars using the Census Bureau's own price adjustment, derived from its published nominal and real median-income series, so the income figures match the Census release exactly rather than a deflator of our own choosing.
What this does not show
A premium is not the whole cost of care: deductibles, co-payments and anything out of network sit on top, so the chart understates what a family actually spends. The employer's share is not money from outside the economy — most economists treat it as part of the worker's total compensation, money that would otherwise be available as wages — but how fully it passes through to pay is still debated, and the chart does not settle that. These are averages across plans that differ widely in generosity, and a richer plan costing more is not the same as the same plan costing more. The survey covers firms that offer health benefits, so it says nothing about workers at firms that offer none. Figures are national averages; premiums vary by region, firm size and industry. KFF's components are rounded independently, so in a few years the worker and employer shares sum to one dollar away from the published total.
Creator
Reuse this visualization
Cite this
License: CC BY 4.0
Embed code
<figure style="margin:0;max-width:1600px">
  <a href="https://chartive.org/visualizations/us-family-health-premium-1999-2025" target="_blank" rel="noopener">
    <img src="https://chartive.org/infographics/us-family-health-premium-1999-2025.png" alt="Stacked column chart of the average annual premium for employer-sponsored family health coverage in the United States from 1999 to 2025. Each column is split into the worker's own contribution at the base and the employer's share above it. The total rises every year without exception, from $5,809 in 1999 to $26,993 in 2025. A dashed line marks the 1999 total and shows that the worker's own 2025 contribution of $6,850 already exceeds it. The final column is labelled $26,993, with $20,143 billed to the employer and $6,850 paid by the worker directly. Below the chart: the premium rose 156% in real terms since 1999, median household income rose 19%, and the premium now equals 31% of that income against 14% in 1999." width="1600" height="2133" style="max-width:100%;height:auto" />
  </a>
  <figcaption style="font:14px/1.4 system-ui,sans-serif;color:#57534e;margin-top:8px">
    Graphic by Chartive Editorial, using data from KFF — via <a href="https://chartive.org/visualizations/us-family-health-premium-1999-2025" target="_blank" rel="noopener">Chartive</a>
  </figcaption>
</figure>
Reuse is welcome — the embed keeps a link back to the source.