Health
Verified dataAmerica spends the most on health — but avoidable deaths stay high
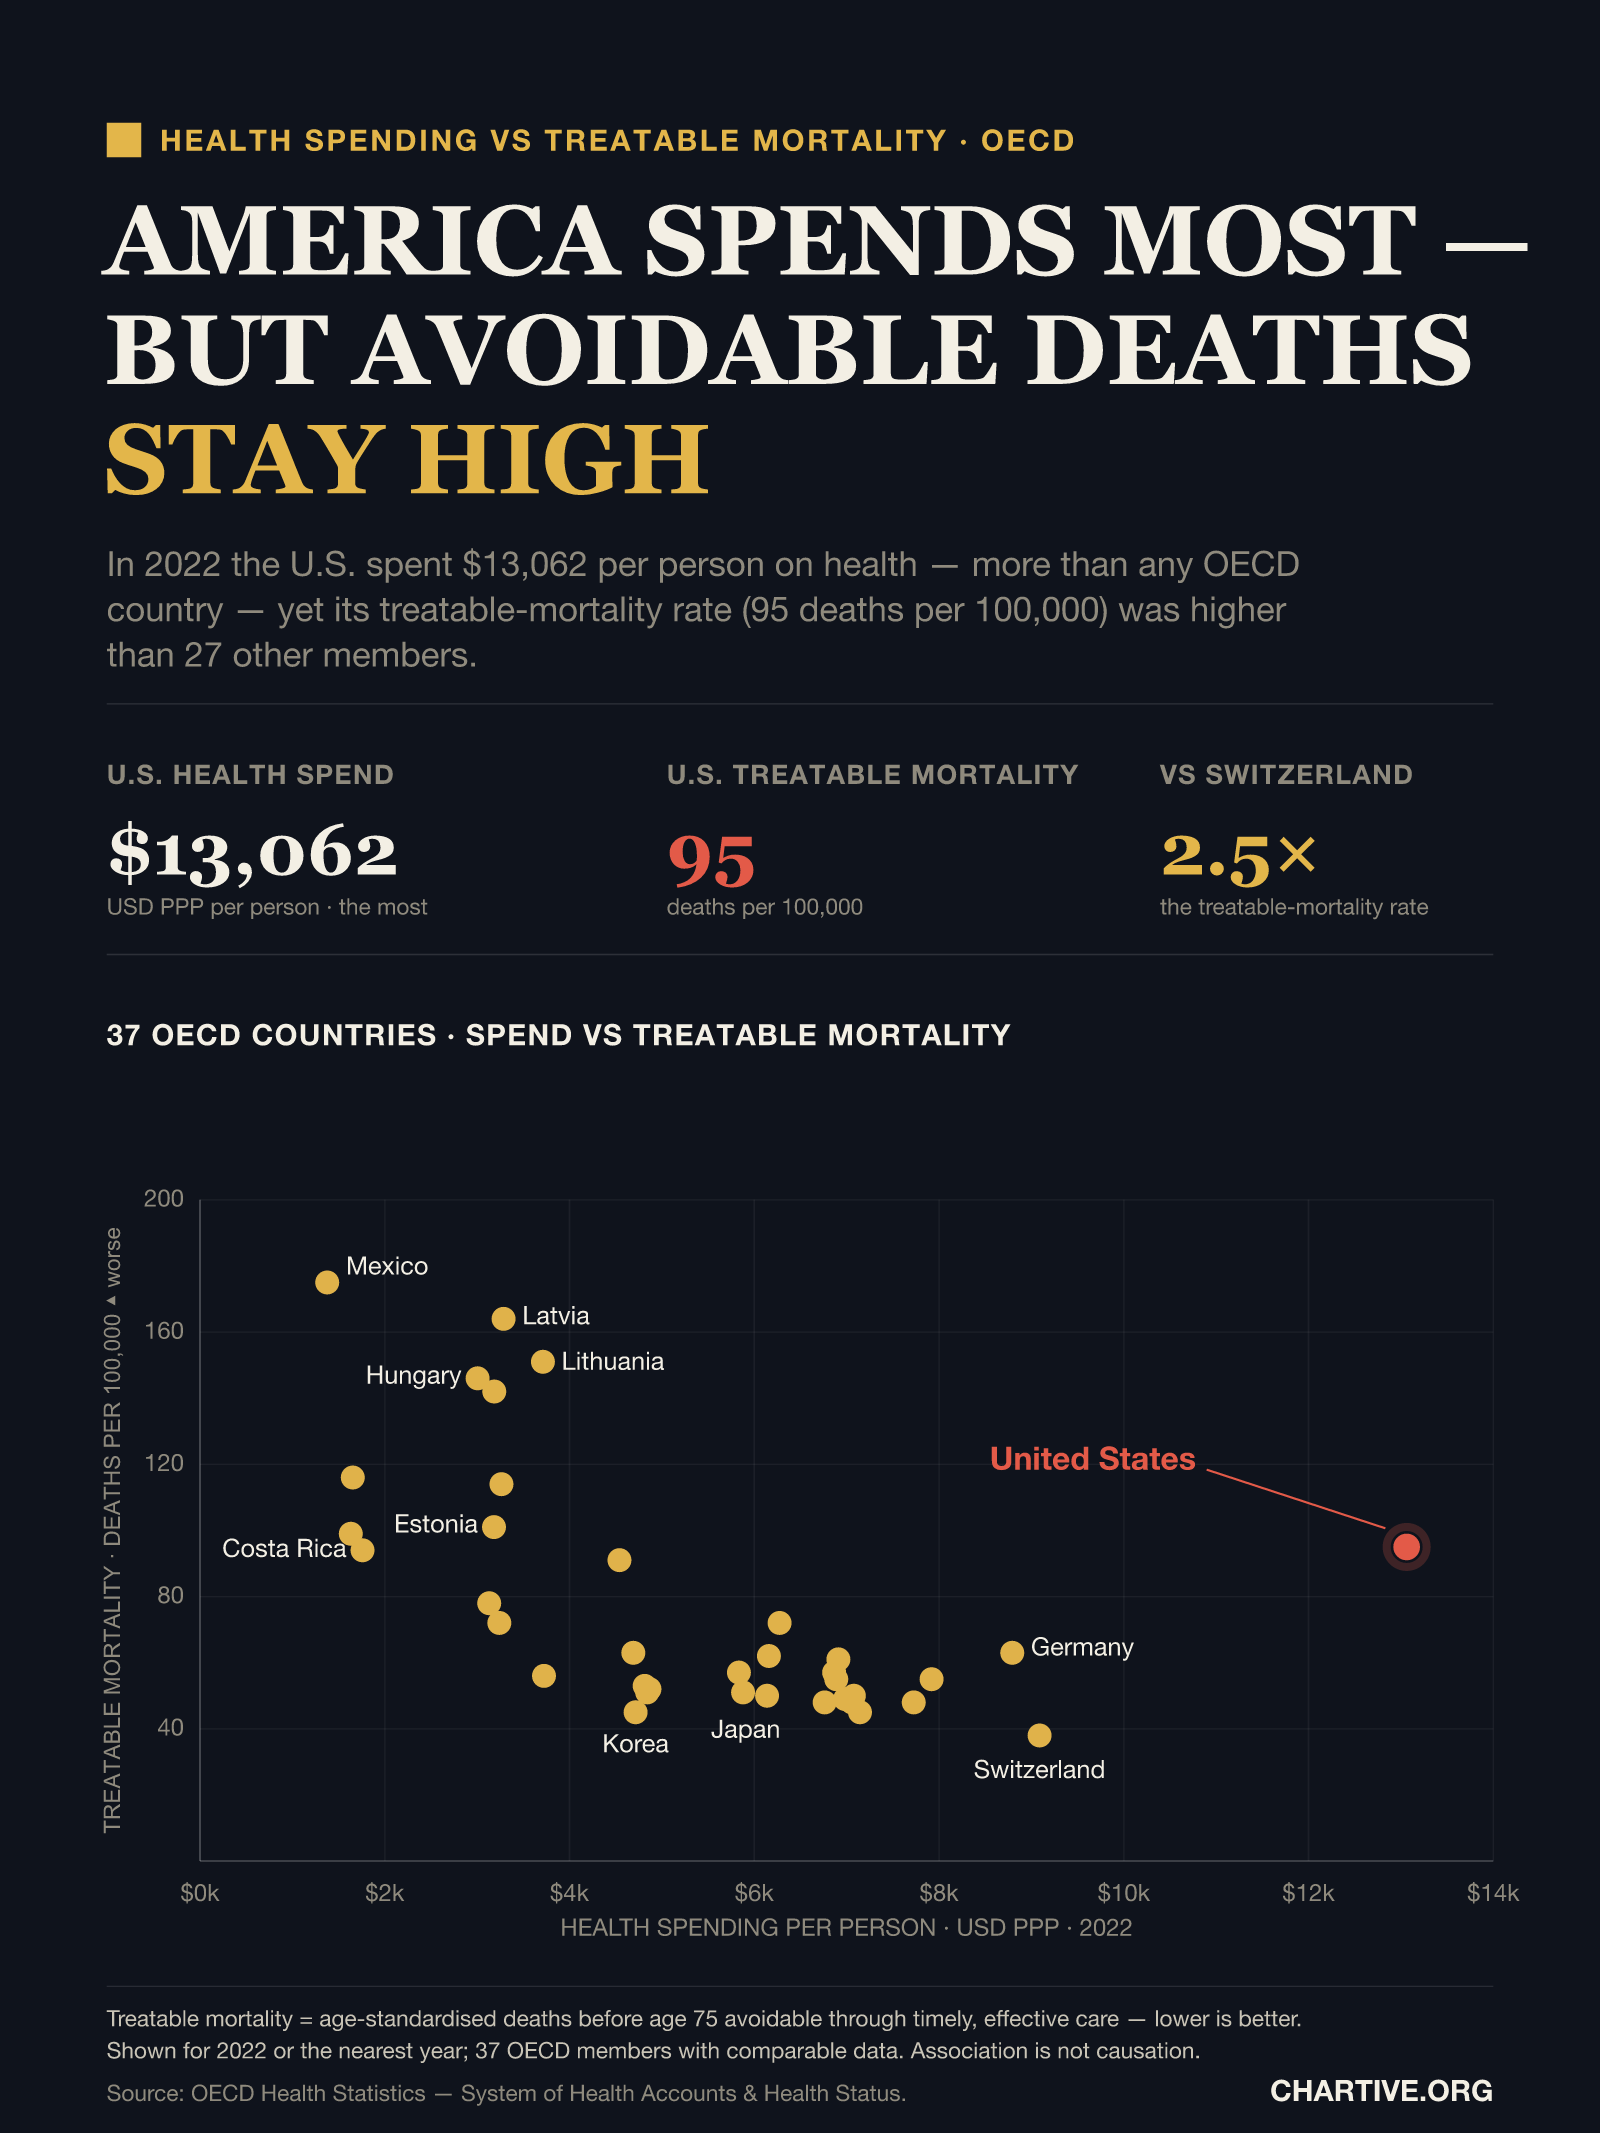
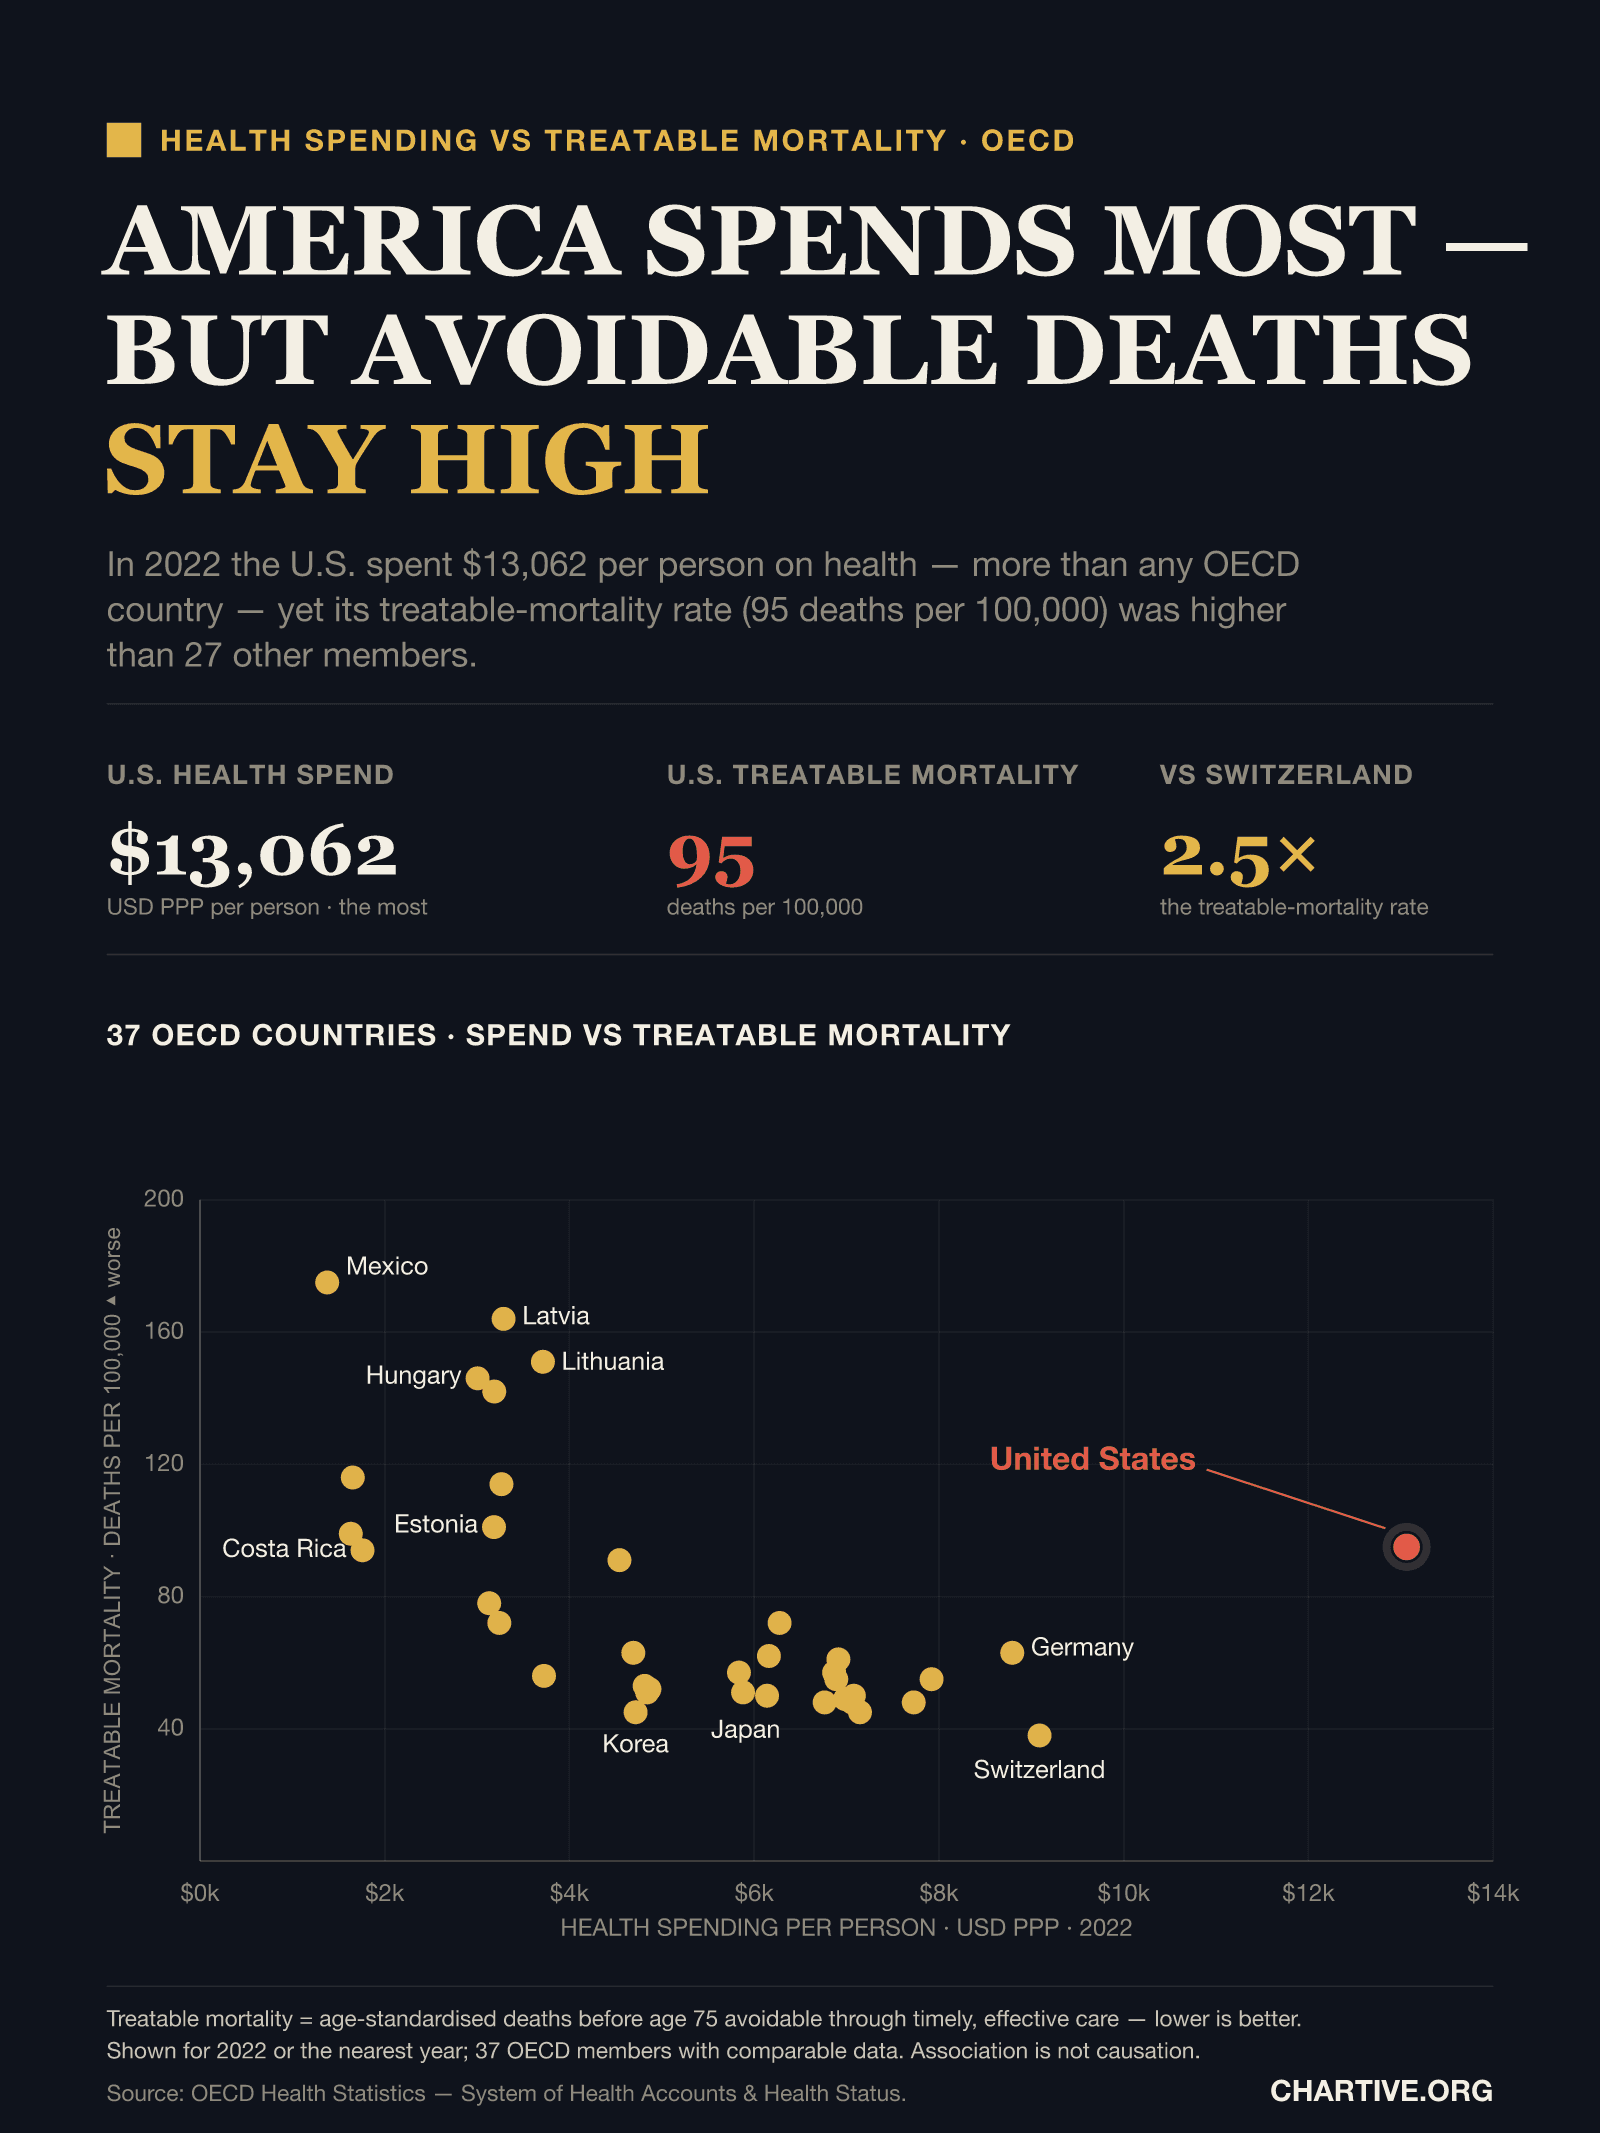
In 2022 the U.S. spent $13,062 per person on health — more than any OECD country — yet its treatable-mortality rate (95 deaths per 100,000) was higher than 27 other members.
CSV · 37 rows · 2022
The United States spent $13,062 per person on health in 2022 — the most in the OECD — but its treatable mortality (deaths before 75 avoidable through timely care) was 95 per 100,000, about 2.5 times Switzerland's rate and higher than 27 of the 37 members with comparable data.
Key findings
- The U.S. spent $13,062 per person on health in 2022 — the most of any OECD country.
- Yet its treatable mortality (95 per 100,000) was higher than 27 of the 37 members with data — about 2.5 times Switzerland's.
- Countries spending far less — Japan, Korea, Australia — record much lower avoidable-death rates.
Explore the data
Coverage: Jan 1, 2022 – Dec 31, 2022 · OECD
Free to download and reuse. Get the data behind every new chart →
Sources
Primary source
OECD Health Statistics
System of Health Accounts; Health Status
Health expenditure and treatable mortality
Accessed Aug 22, 2026
Current health expenditure per capita (USD PPP, current prices) and treatable mortality (age-standardised, per 100 000), 2022 or nearest year.
Methodology
Each point is an OECD member country. Health spending is total current health expenditure per person in US dollars adjusted for purchasing power (current prices), from the OECD System of Health Accounts. Treatable mortality is the age-standardised rate of deaths before age 75 from causes mainly avoidable through timely, effective healthcare, from OECD health-status statistics. Both are for 2022 or the nearest available year.
What this does not show
Treatable mortality reflects deaths avoidable through timely care (lower is better) and is only one measure of a health system; spending per person captures inputs, not outcomes. Figures are for 2022 or the nearest year; 37 of the 38 OECD members had comparable data (Norway's treatable-mortality figure was unavailable). Association is not causation — the chart does not prove that spending causes, or fails to prevent, these deaths.
Creator
Reuse this visualization
Cite this
License: CC BY 4.0
Embed code
<figure style="margin:0;max-width:1600px">
  <a href="https://chartive.org/visualizations/us-health-spend-vs-treatable-mortality" target="_blank" rel="noopener">
    <img src="https://chartive.org/infographics/oecd-health-spend-vs-treatable-mortality.png" alt="Scatter chart of OECD countries: health spending per person versus treatable mortality per 100,000. The United States is a red outlier on the far right, spending about $13,062 per person — the most — with a treatable-mortality rate of 95, higher than most countries. Switzerland spends about $9,089 with a rate of 38." width="1600" height="2133" style="max-width:100%;height:auto" />
  </a>
  <figcaption style="font:14px/1.4 system-ui,sans-serif;color:#57534e;margin-top:8px">
    Graphic by Chartive Editorial, using data from OECD Health Statistics — via <a href="https://chartive.org/visualizations/us-health-spend-vs-treatable-mortality" target="_blank" rel="noopener">Chartive</a>
  </figcaption>
</figure>
Reuse is welcome — the embed keeps a link back to the source.