Society
Verified dataThe path to adulthood looks very different now
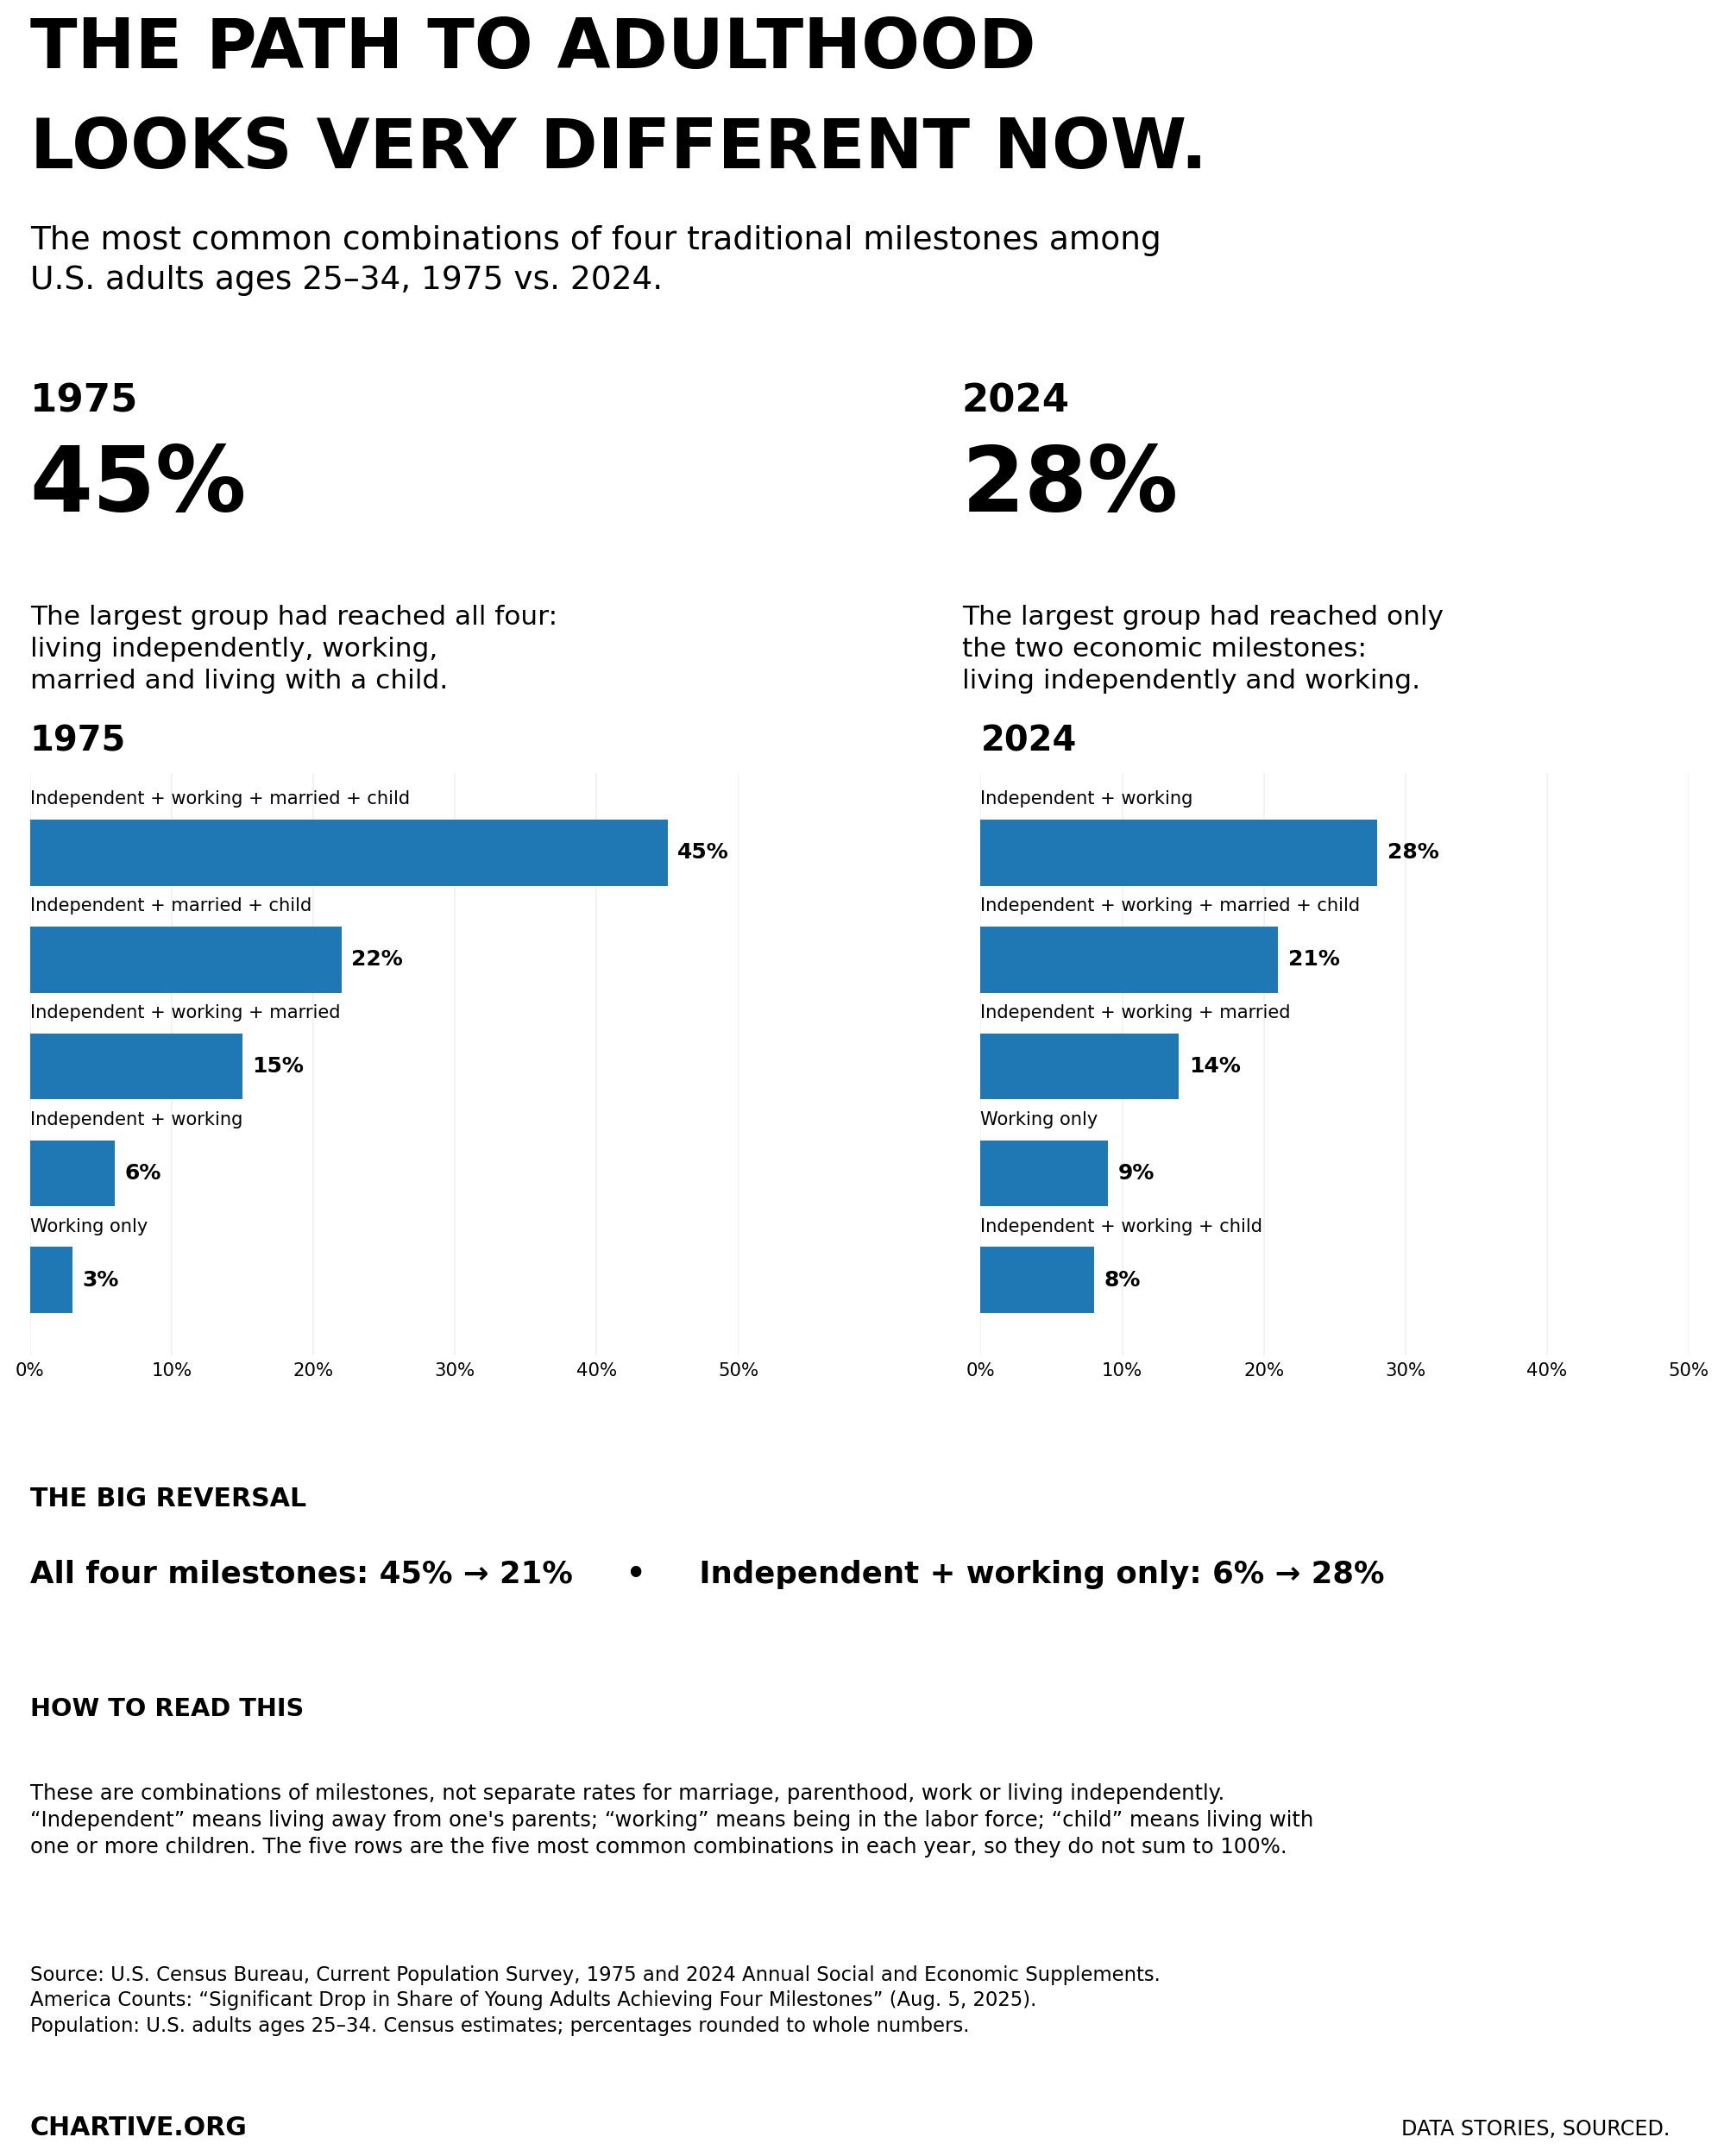
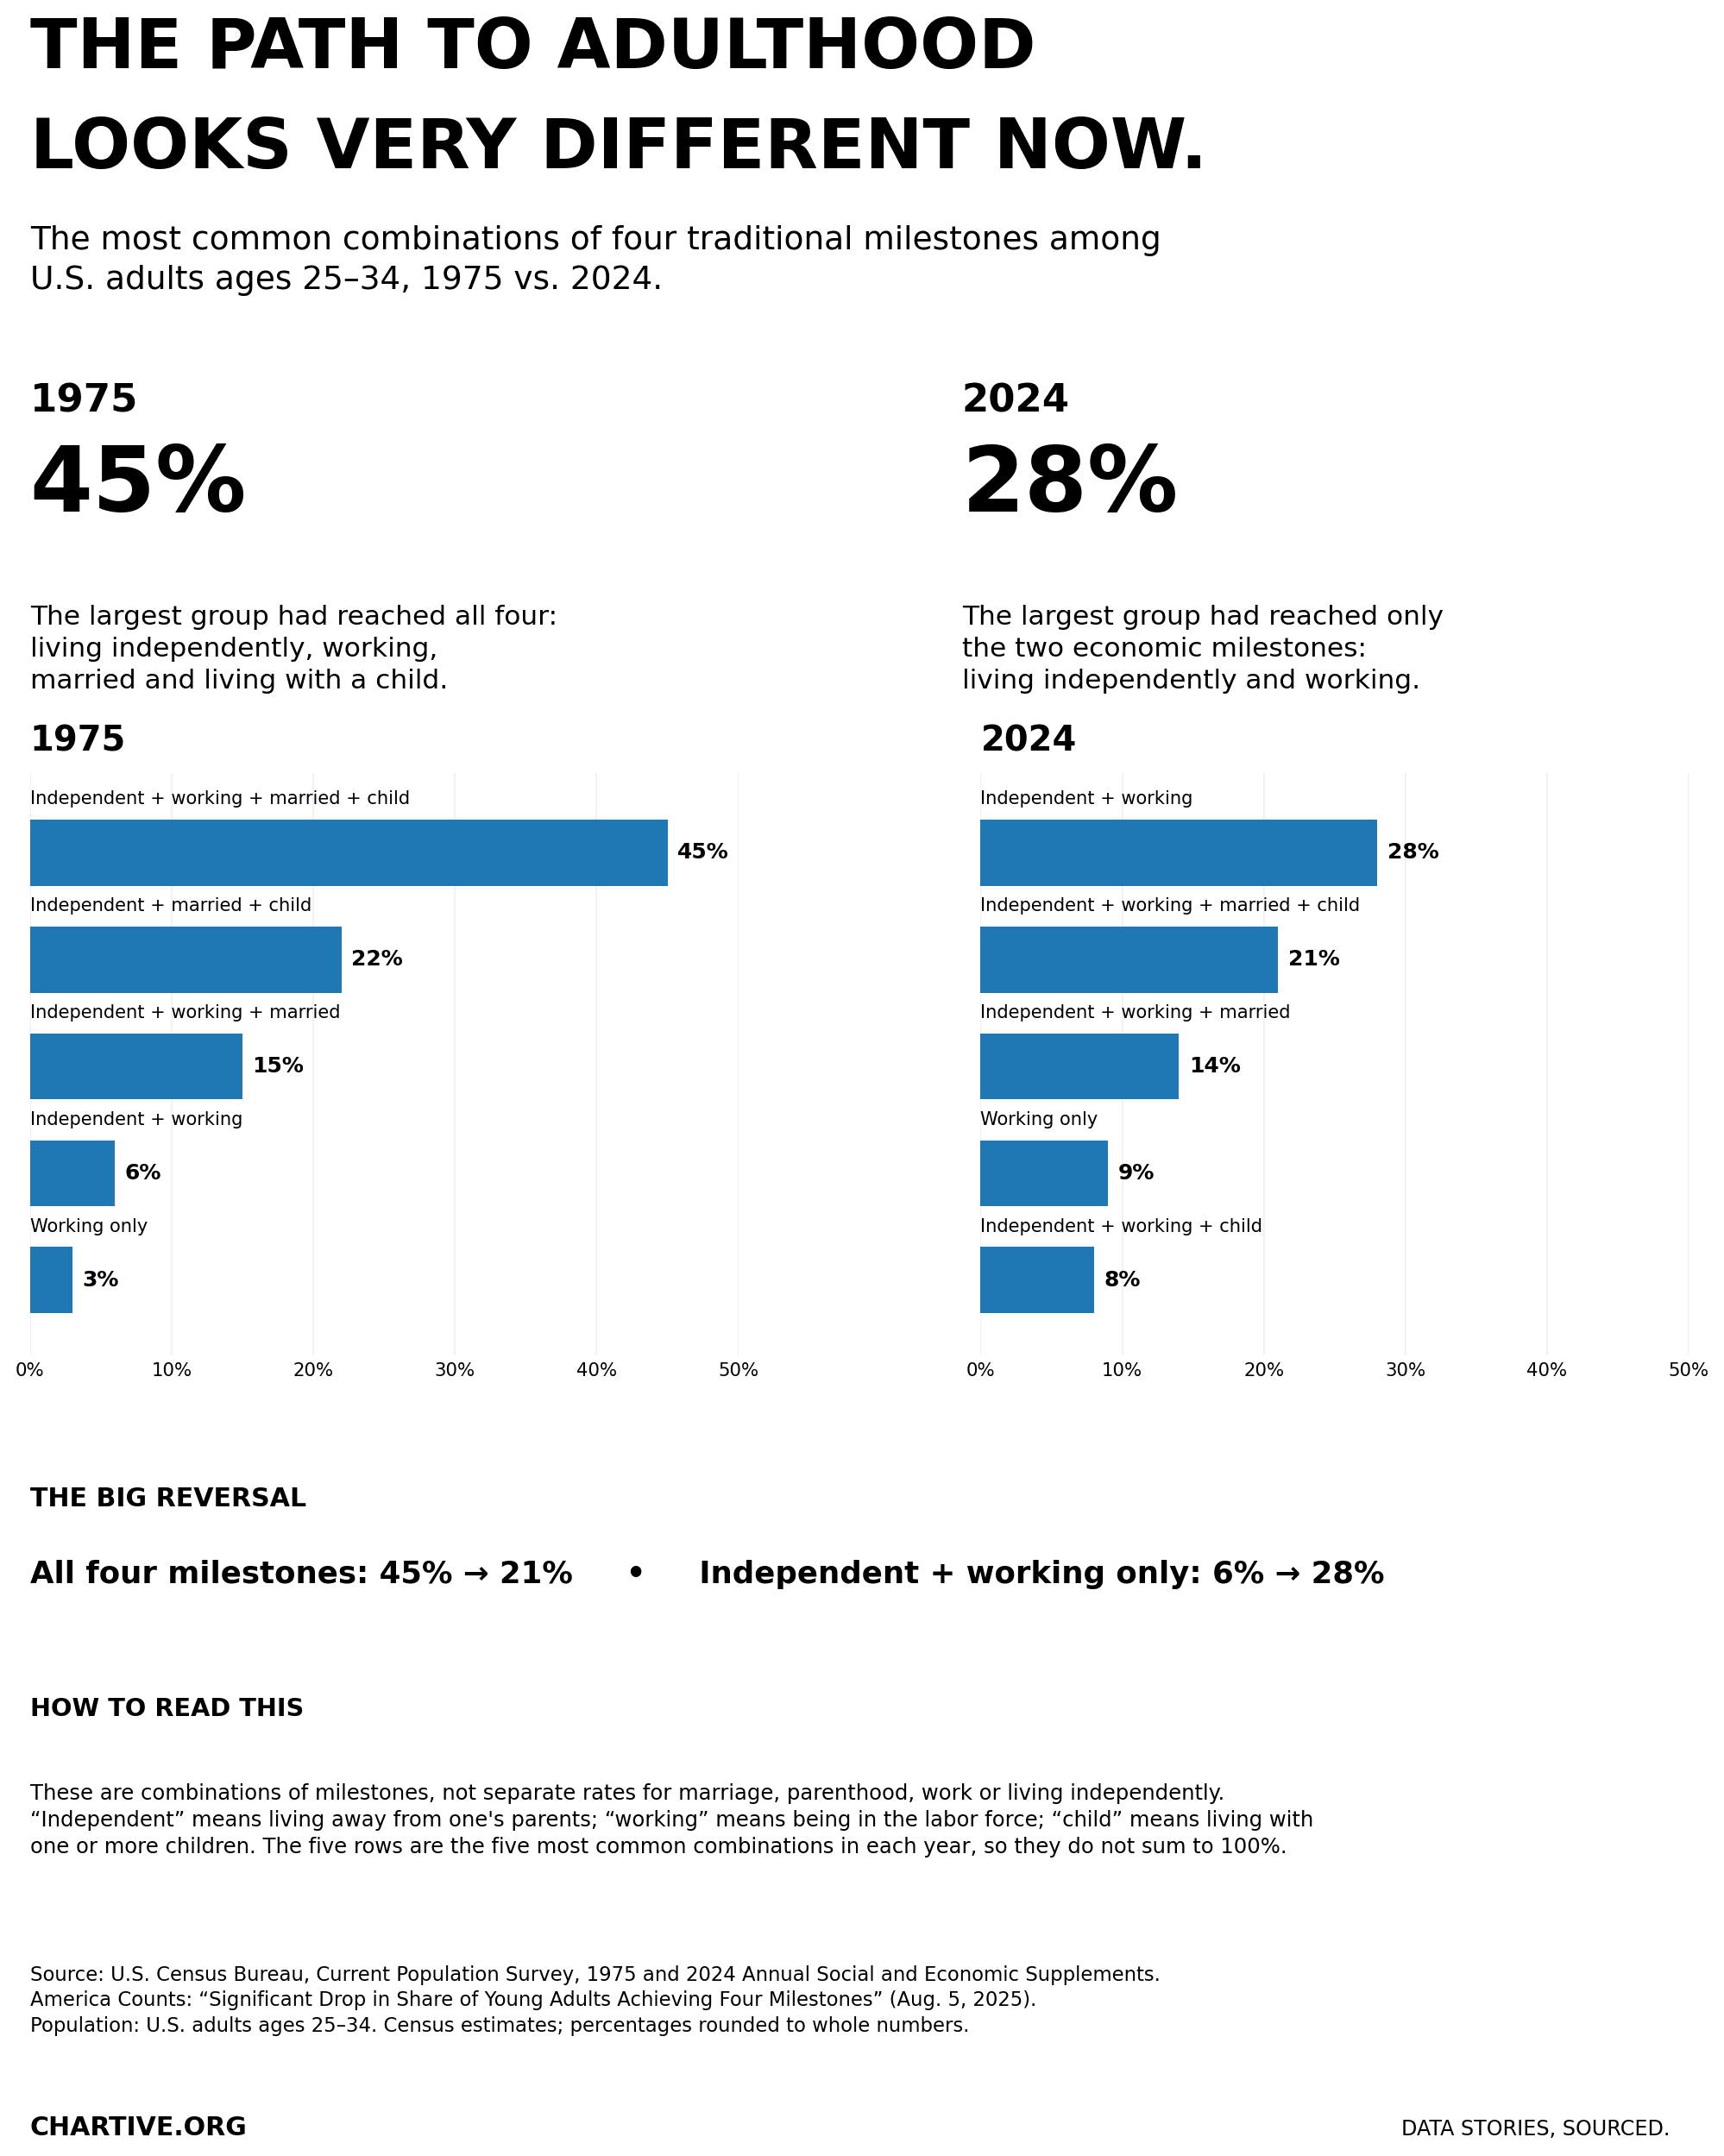
The most common combinations of four traditional milestones among U.S. adults ages 25–34, 1975 vs. 2024.
CSV · 10 rows · 1975–2024
In 1975 the single most common situation for 25–34-year-olds was having reached all four milestones — independent, working, married and living with a child (45%). By 2024 the most common was just two: independent and working (28%).
Key findings
- Reaching all four milestones fell from 45% of young adults in 1975 to 21% in 2024.
- Being independent and working only rose from 6% to 28% — now the single most common combination.
- By 2024, ‘independent + working + married + child’ had slipped to the second most common group (21%).
Explore the data
Coverage: Jan 1, 1975 – Dec 31, 2024 · United States
Free to download and reuse. Get the data behind every new chart →
Sources
Primary source
U.S. Census Bureau
U.S. Census Bureau
Current Population Survey, 1975 & 2024 Annual Social and Economic Supplements — America Counts: “Significant Drop in Share of Young Adults Achieving Four Milestones” (Aug 5, 2025)
Accessed Aug 14, 2026
Population: U.S. adults ages 25–34. Census estimates.
Methodology
Shares are the most common combinations of four milestones — living independently, being in the labor force, being married, and living with a child — among U.S. adults ages 25–34, from the Current Population Survey Annual Social and Economic Supplements for 1975 and 2024. Percentages are rounded to whole numbers.
What this does not show
These are combinations of milestones, not separate rates for marriage, parenthood, work or living independently. The five rows shown are the five most common combinations in each year, so they do not sum to 100%.
Creator
Reuse this visualization
Cite this
License: CC BY 4.0
Embed code
<figure style="margin:0;max-width:1998px">
  <a href="https://chartive.org/visualizations/path-to-adulthood-1975-vs-2024" target="_blank" rel="noopener">
    <img src="https://chartive.org/infographics/path-to-adulthood-1975-2024.png" alt="Comparison bar charts of the most common milestone combinations for U.S. adults ages 25–34 in 1975 versus 2024." width="1998" height="2499" style="max-width:100%;height:auto" />
  </a>
  <figcaption style="font:14px/1.4 system-ui,sans-serif;color:#57534e;margin-top:8px">
    Graphic by Chartive Editorial, using data from U.S. Census Bureau — via <a href="https://chartive.org/visualizations/path-to-adulthood-1975-vs-2024" target="_blank" rel="noopener">Chartive</a>
  </figcaption>
</figure>
Reuse is welcome — the embed keeps a link back to the source.