Country
United States
Economy
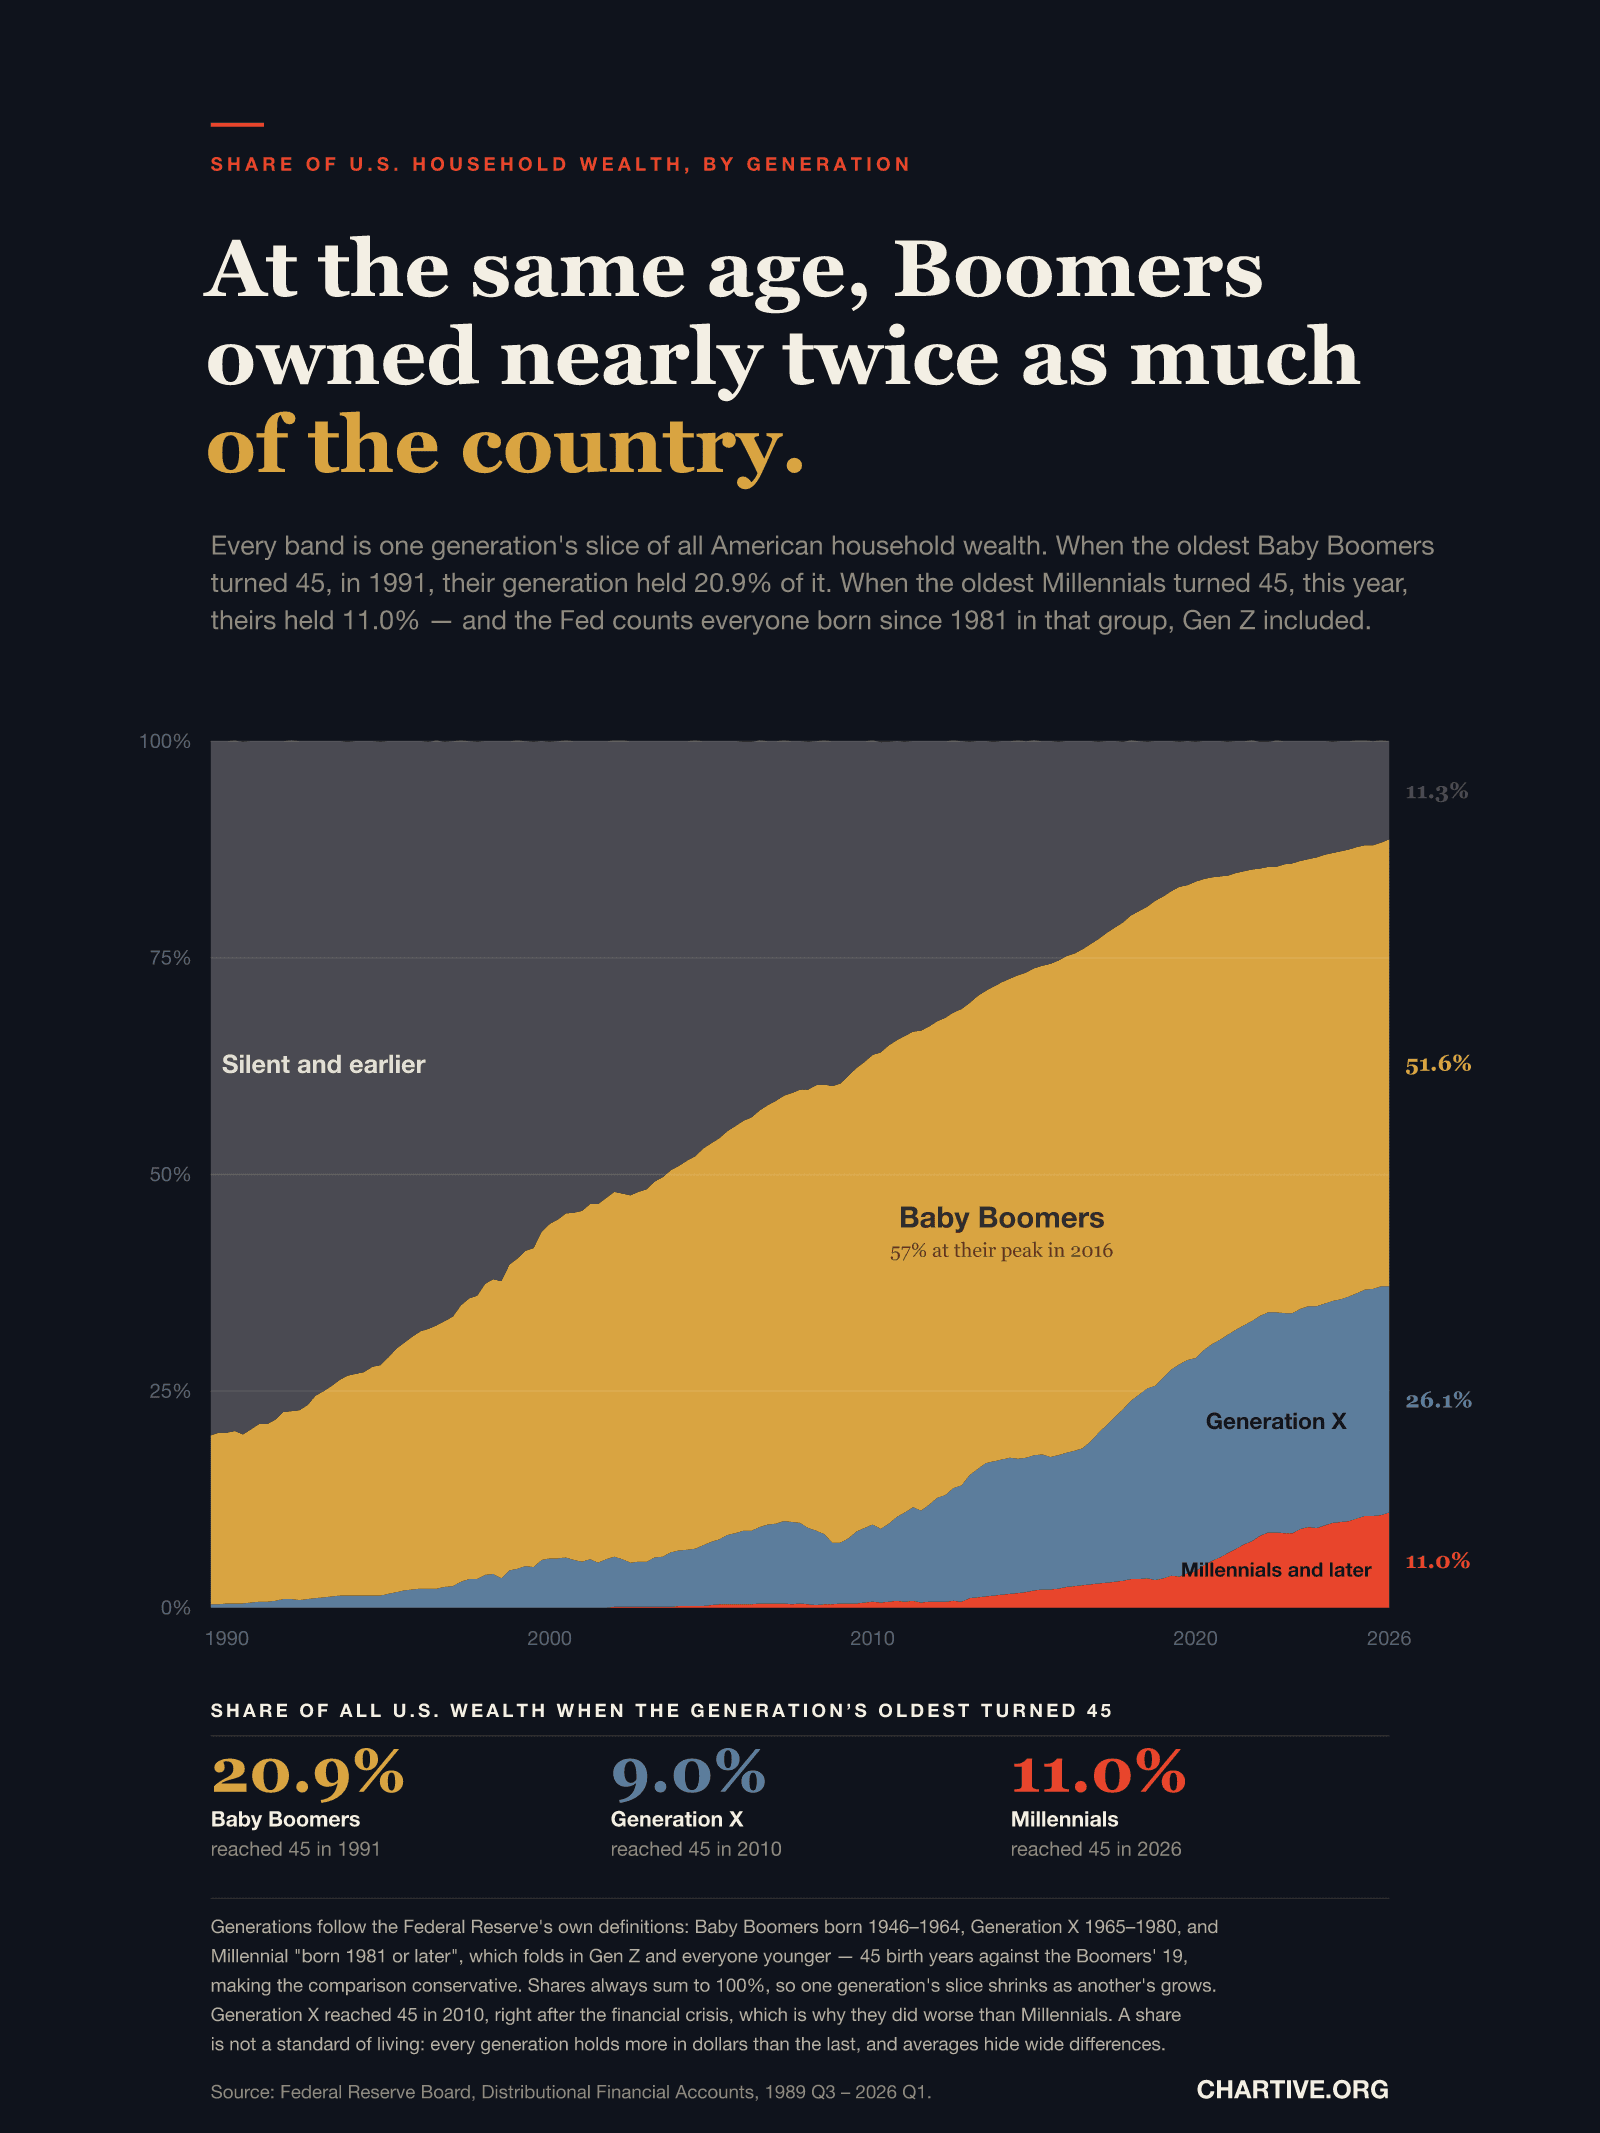
At the same age, Boomers owned nearly twice as much of the country
When the oldest Baby Boomers turned 45, in 1991, their generation held 20.9% of all US household wealth. When the oldest Millennials turned 45, in 2026, theirs held 11.0%.
Chartive Editorial
Climate
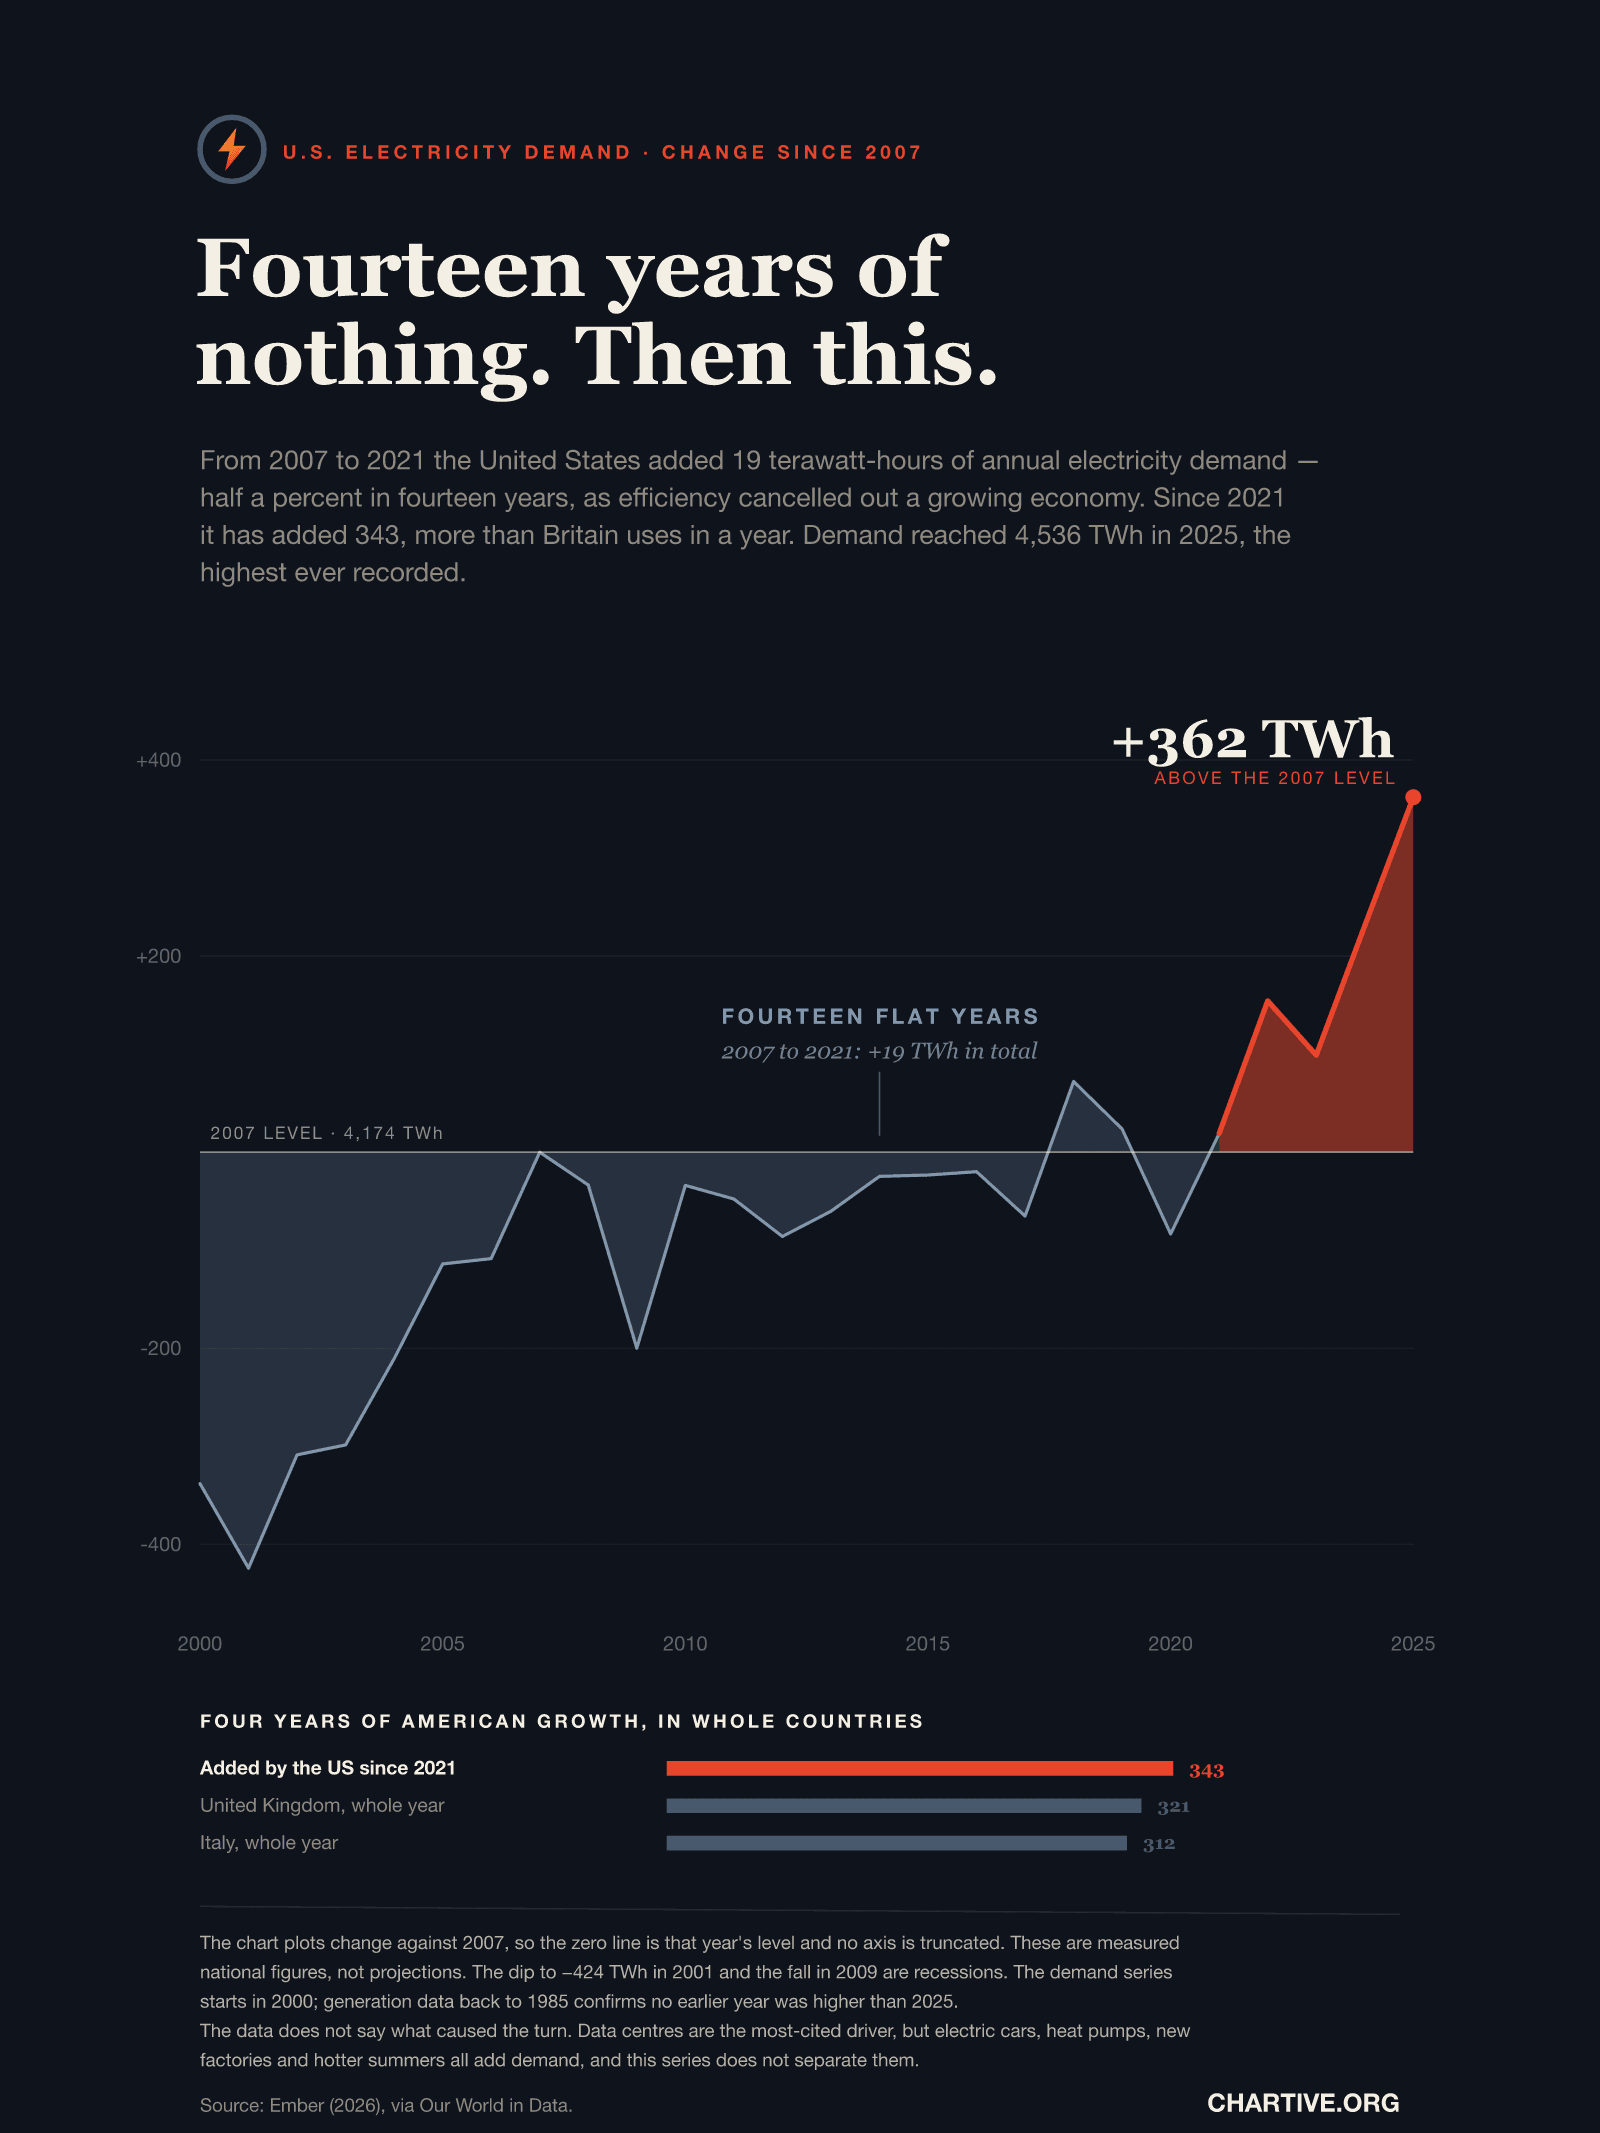
Fourteen years of nothing. Then this.
From 2007 to 2021 the United States added 19 terawatt-hours of annual electricity demand — half a percent in fourteen years. Since 2021 it has added 343, more than Britain uses in a year.
Chartive Editorial
Economy
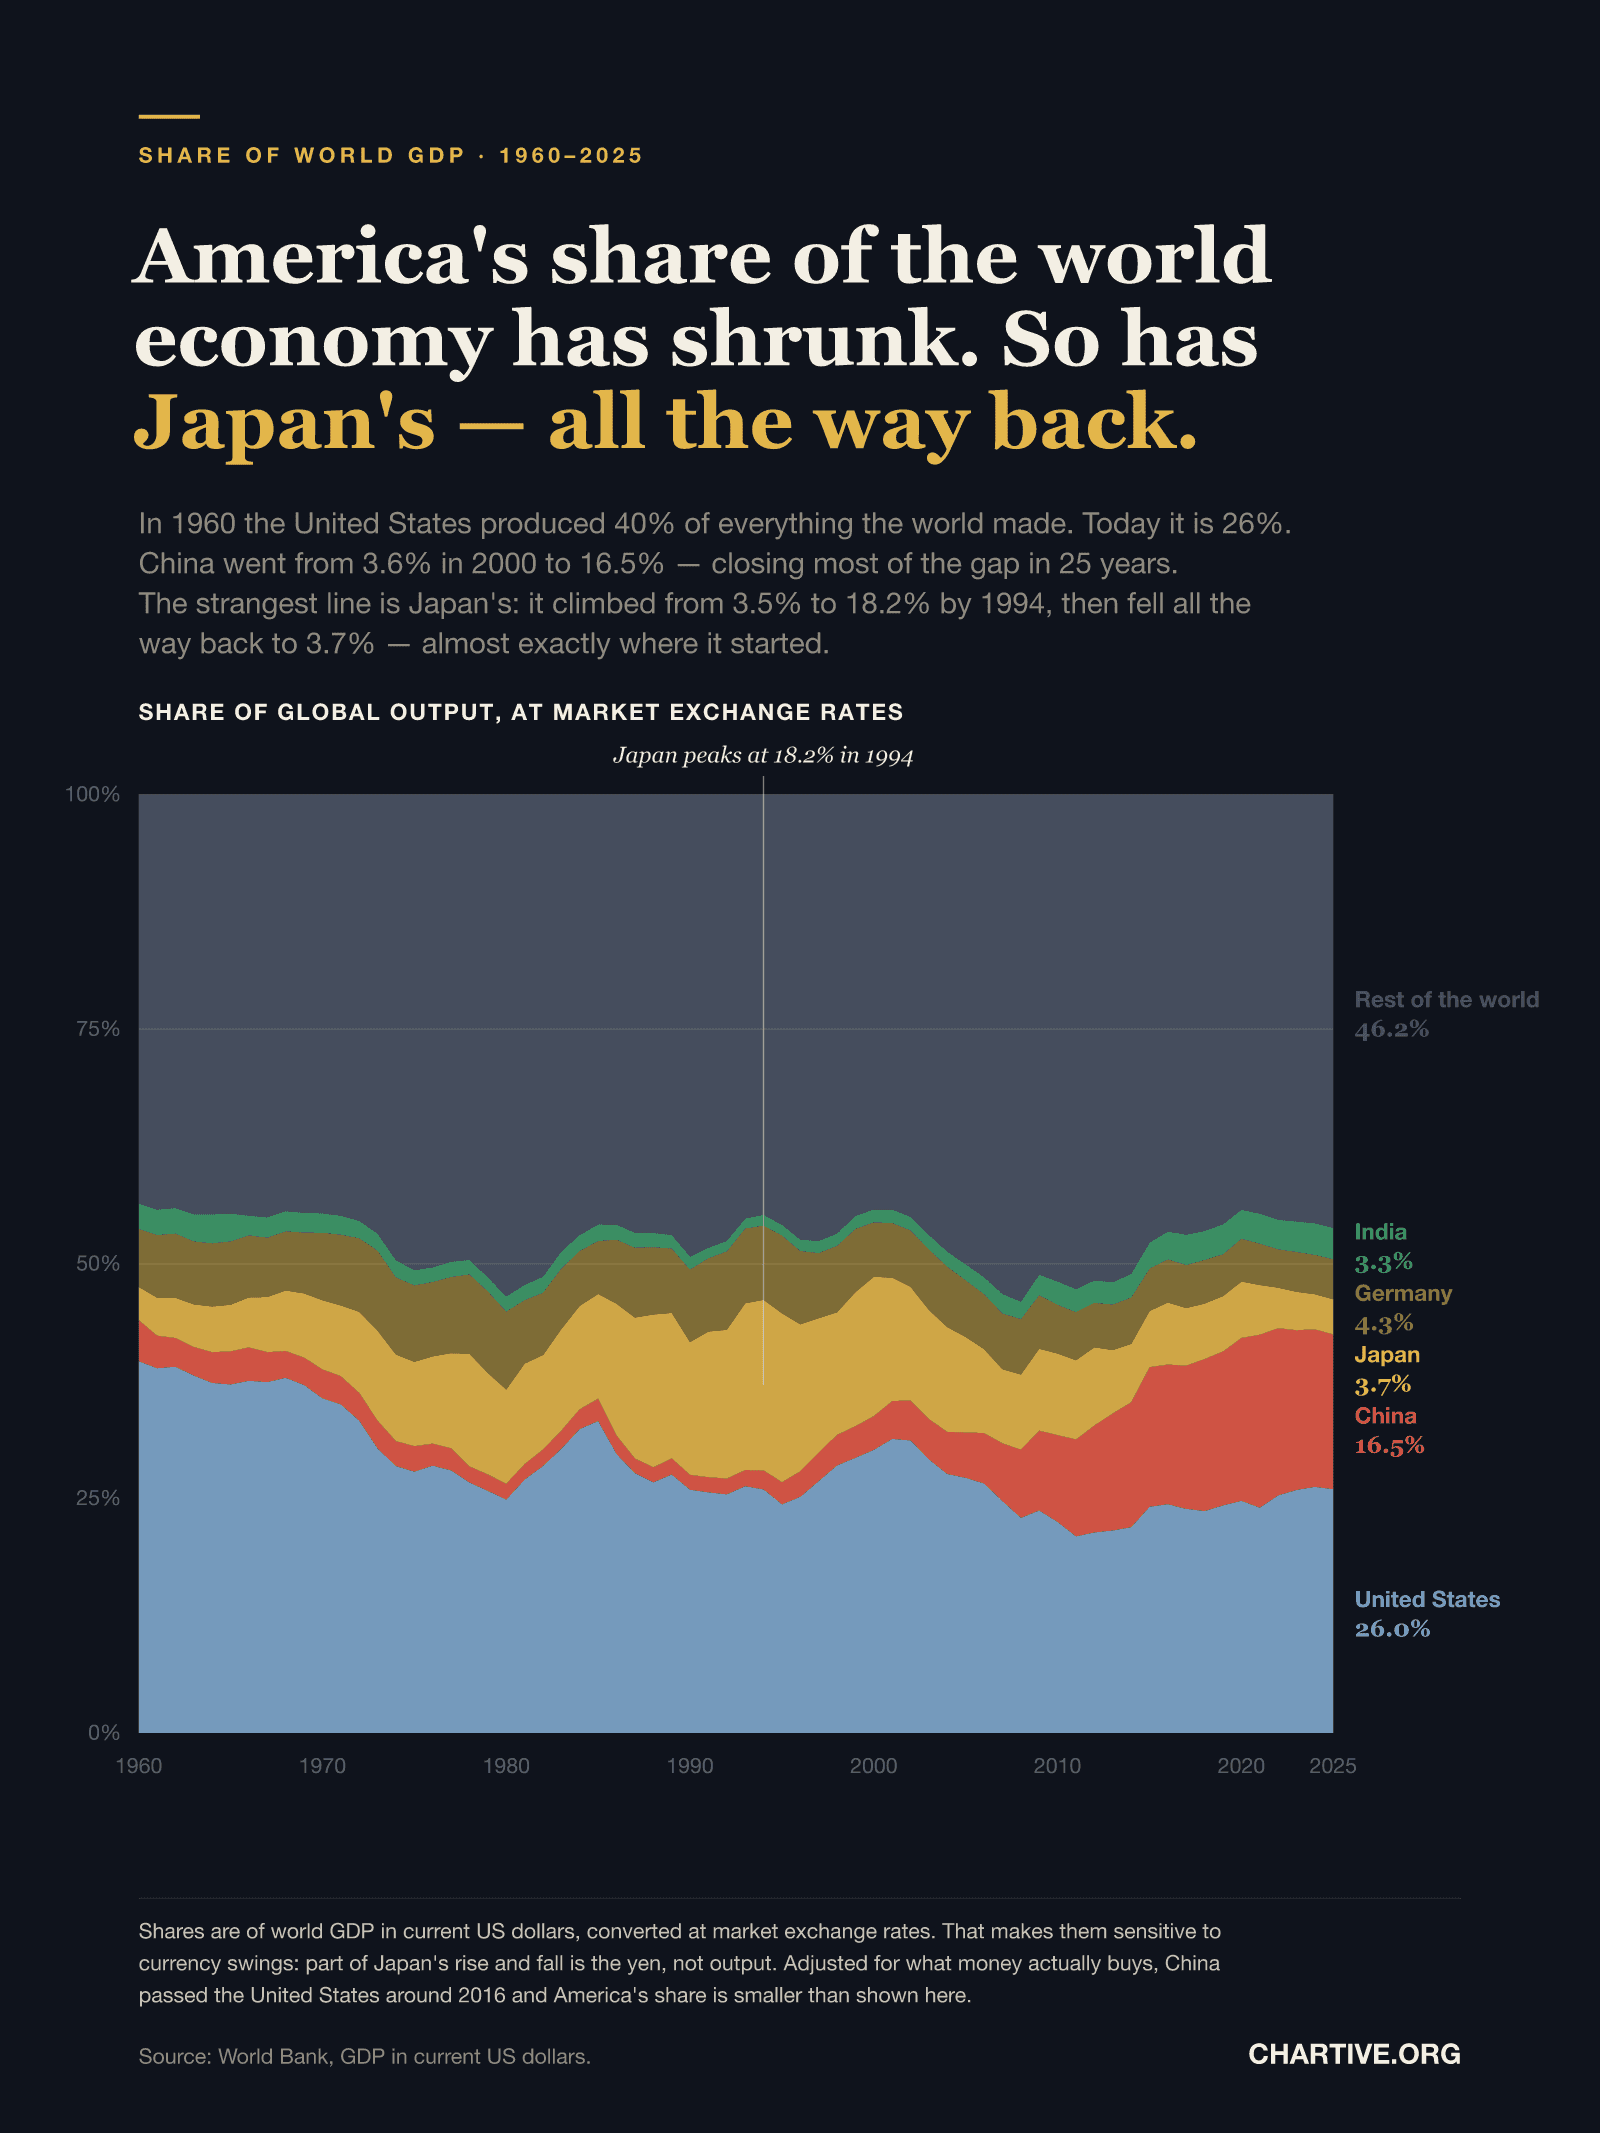
America's share of the world economy has shrunk. So has Japan's — all the way back.
In 1960 the United States produced 40% of everything the world made; today it is 26%. China went from 3.6% in 2000 to 16.5%. Japan climbed to 18.2% by 1994 and then fell back to 3.7% — almost exactly where it started.
Chartive Editorial
Economy
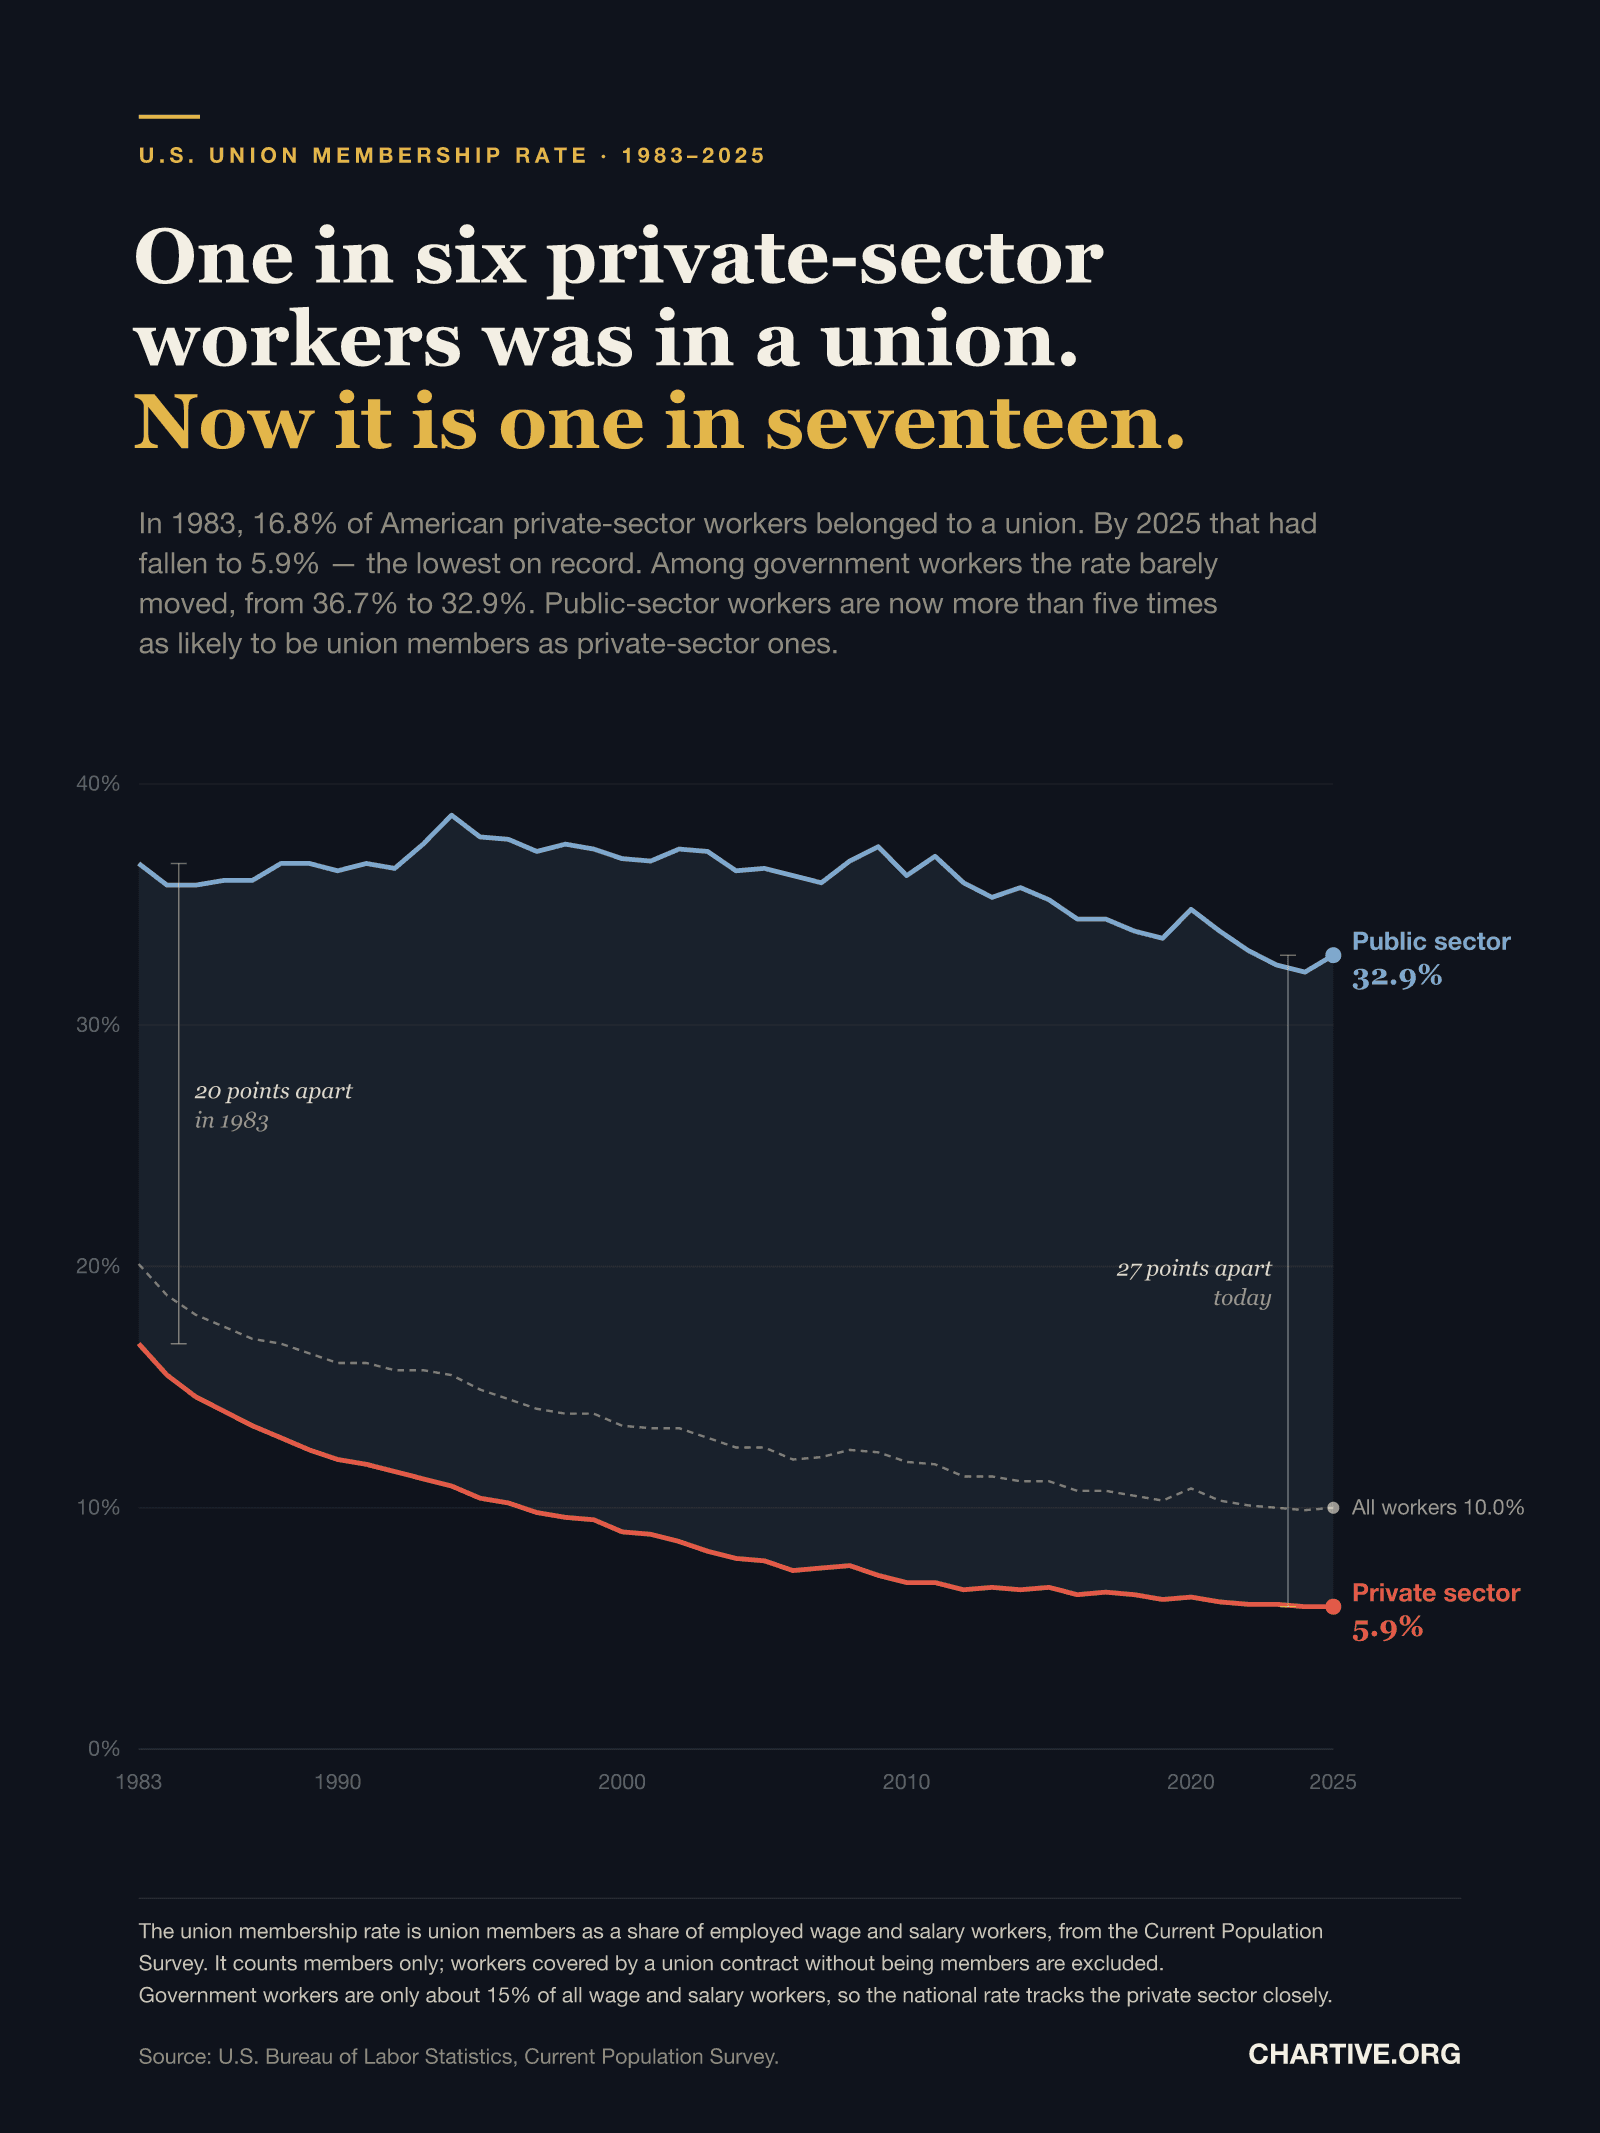
One in six private-sector workers was in a union. Now it is one in seventeen.
In 1983, 16.8% of American private-sector workers belonged to a union. By 2025 that had fallen to 5.9% — the lowest on record — while the rate among government workers barely moved.
Chartive Editorial
Economy
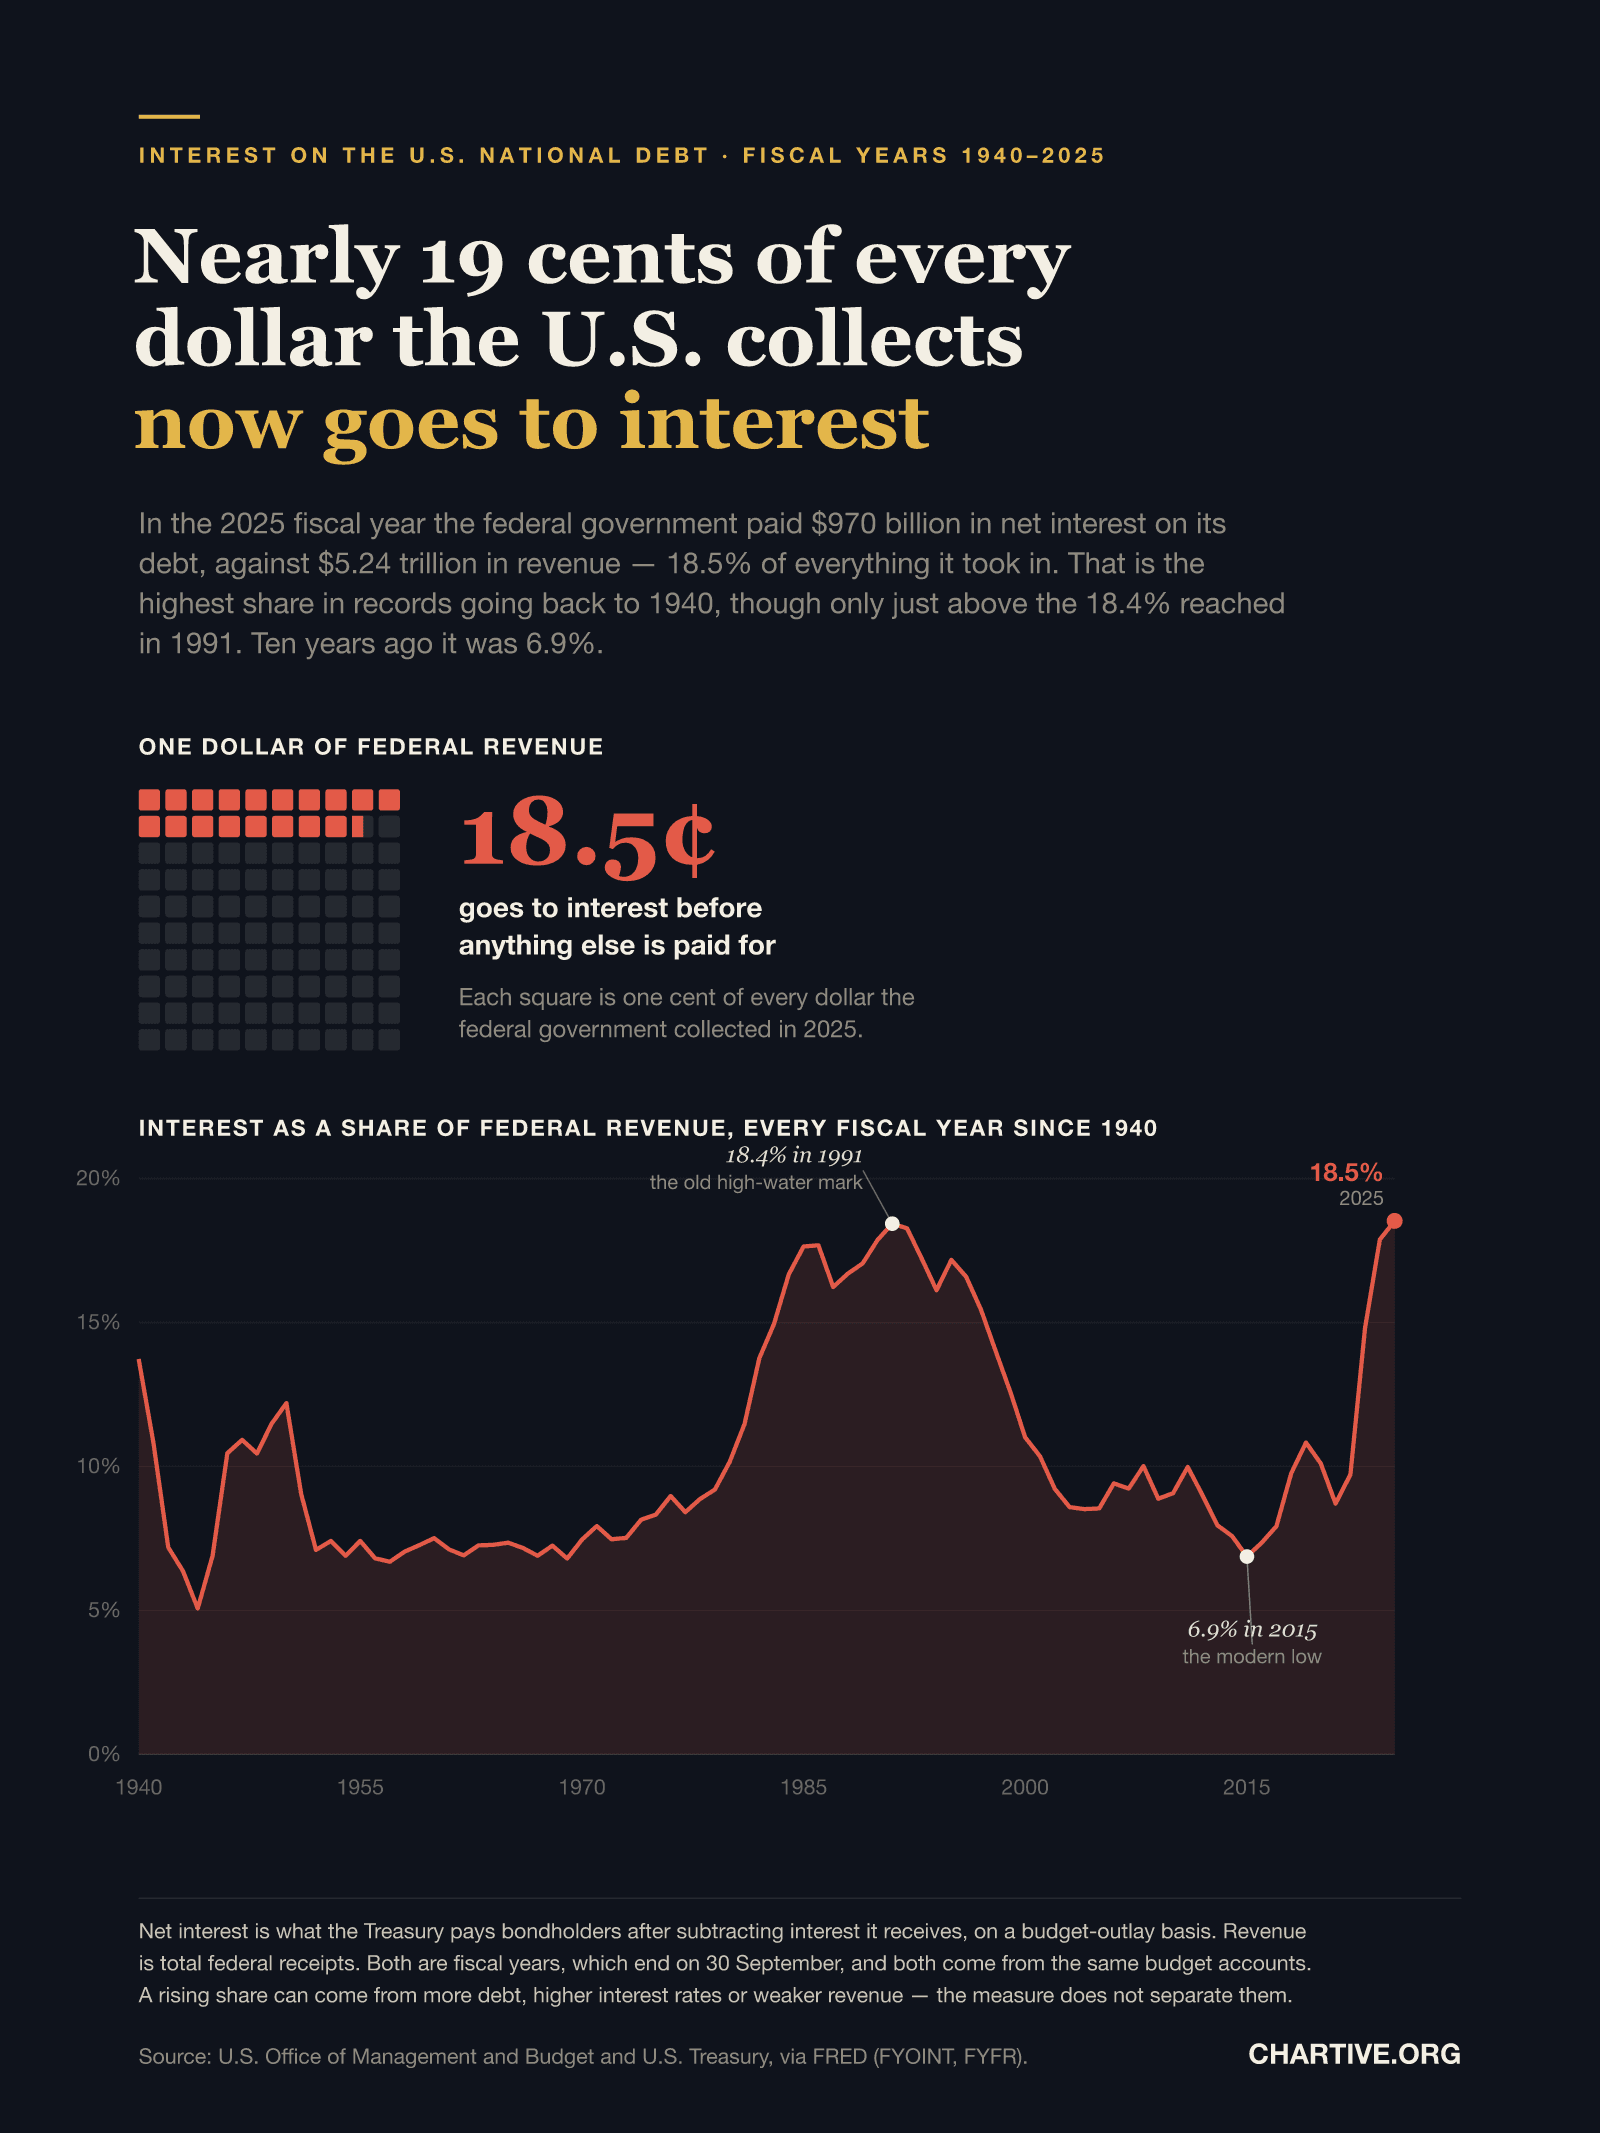
Nearly 19 cents of every dollar the U.S. collects now goes to interest
In the 2025 fiscal year the federal government paid $970 billion in net interest on its debt, against $5.24 trillion in revenue — 18.5% of everything it took in, the highest share in records going back to 1940.
Chartive Editorial
Economy
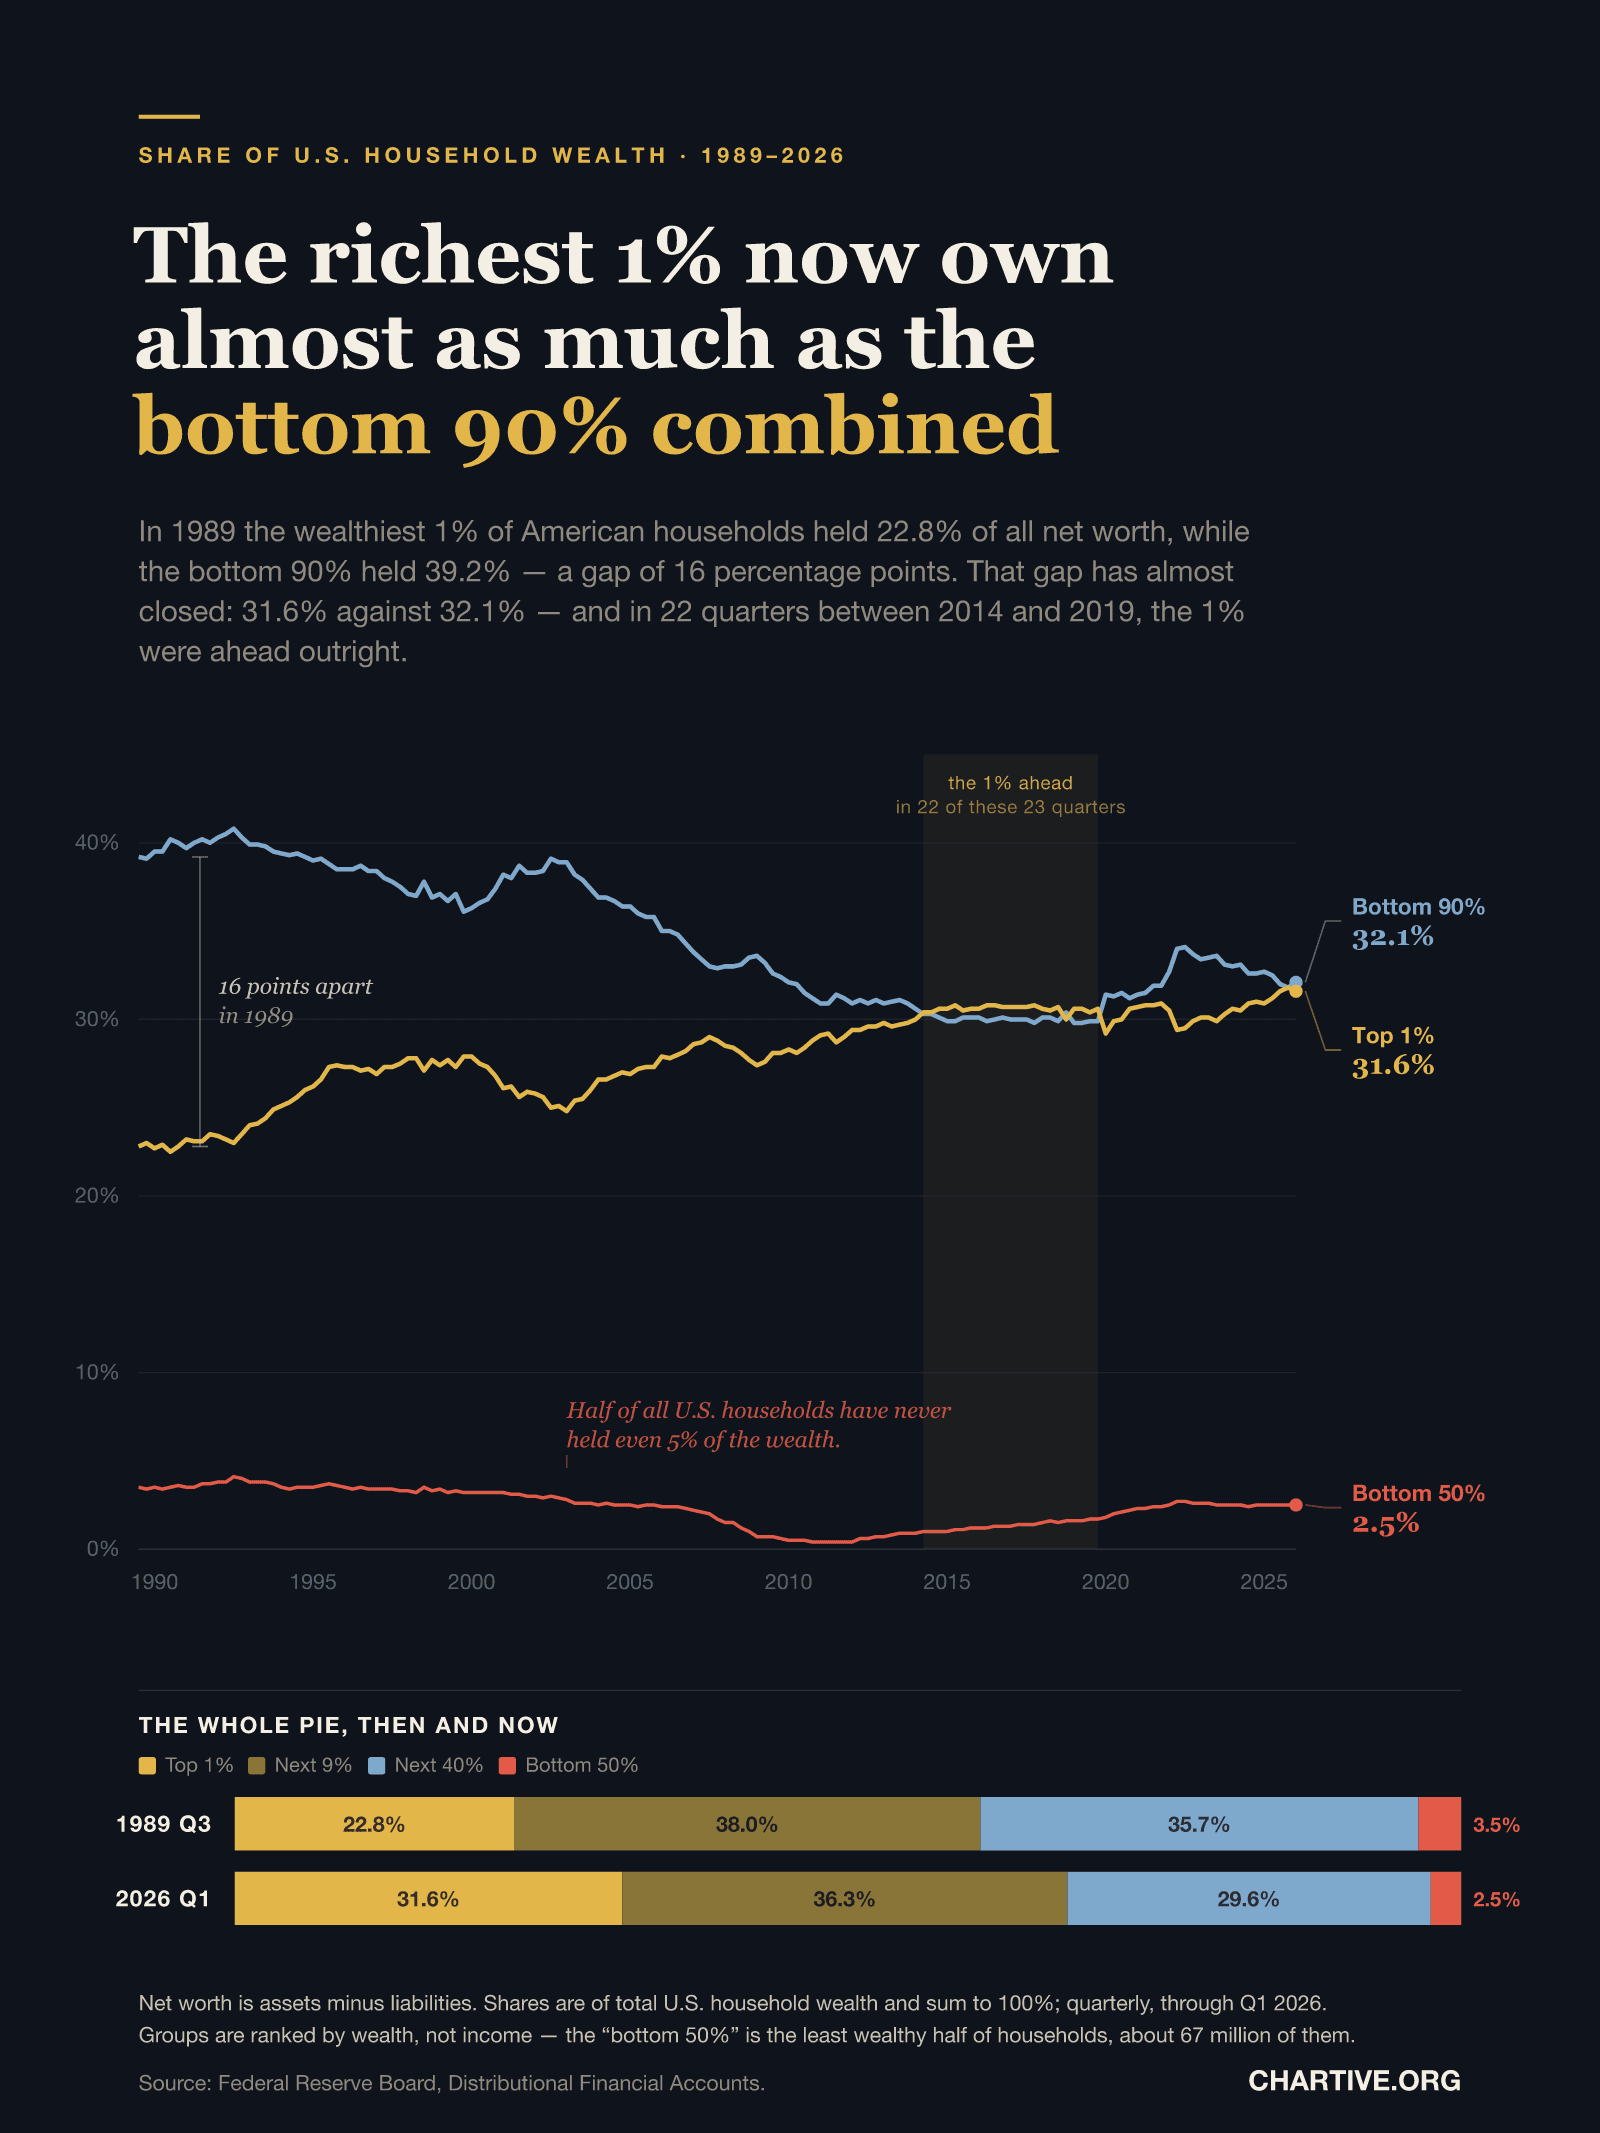
The richest 1% now own almost as much as the bottom 90% combined
In 1989 the wealthiest 1% of American households held 22.8% of all net worth and the bottom 90% held 39.2% — a gap of 16 percentage points. That gap has almost closed: 31.6% against 32.1%.
Chartive Editorial
Society
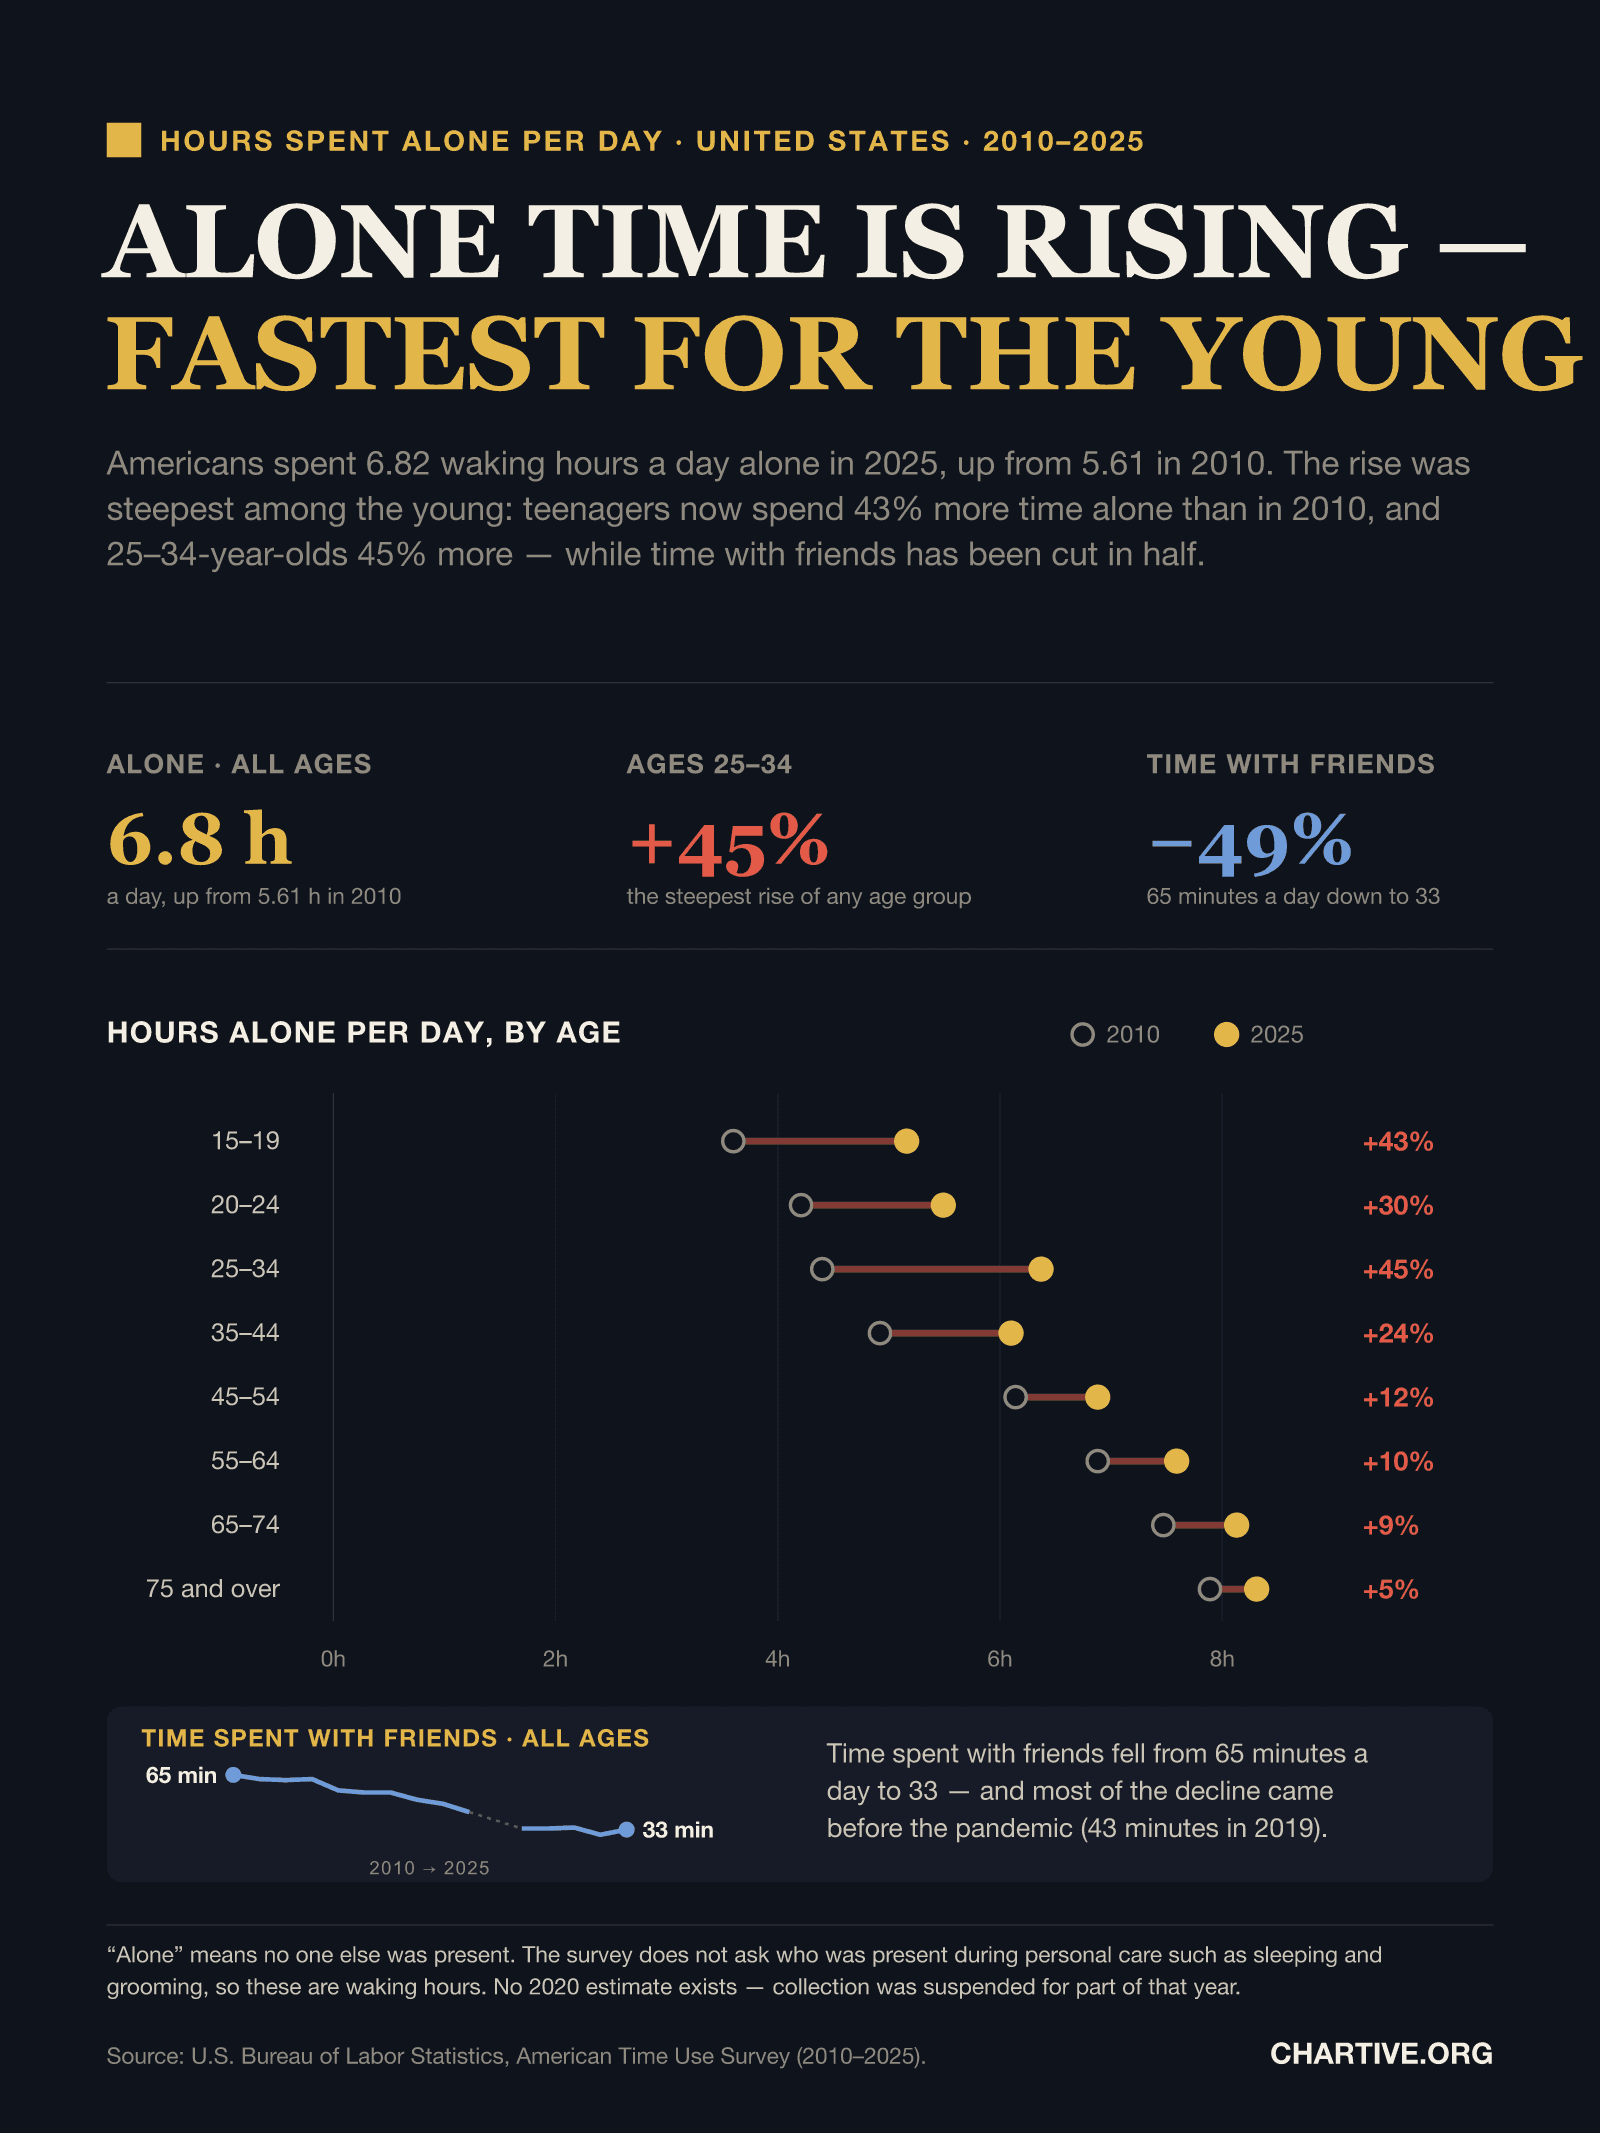
Alone time is rising — fastest for the young
Americans spent 6.82 waking hours a day alone in 2025, up from 5.61 in 2010. Teenagers now spend 43% more time alone than they did in 2010, and 25–34-year-olds 45% more — while time with friends has been cut in half.
Chartive Editorial
Economy
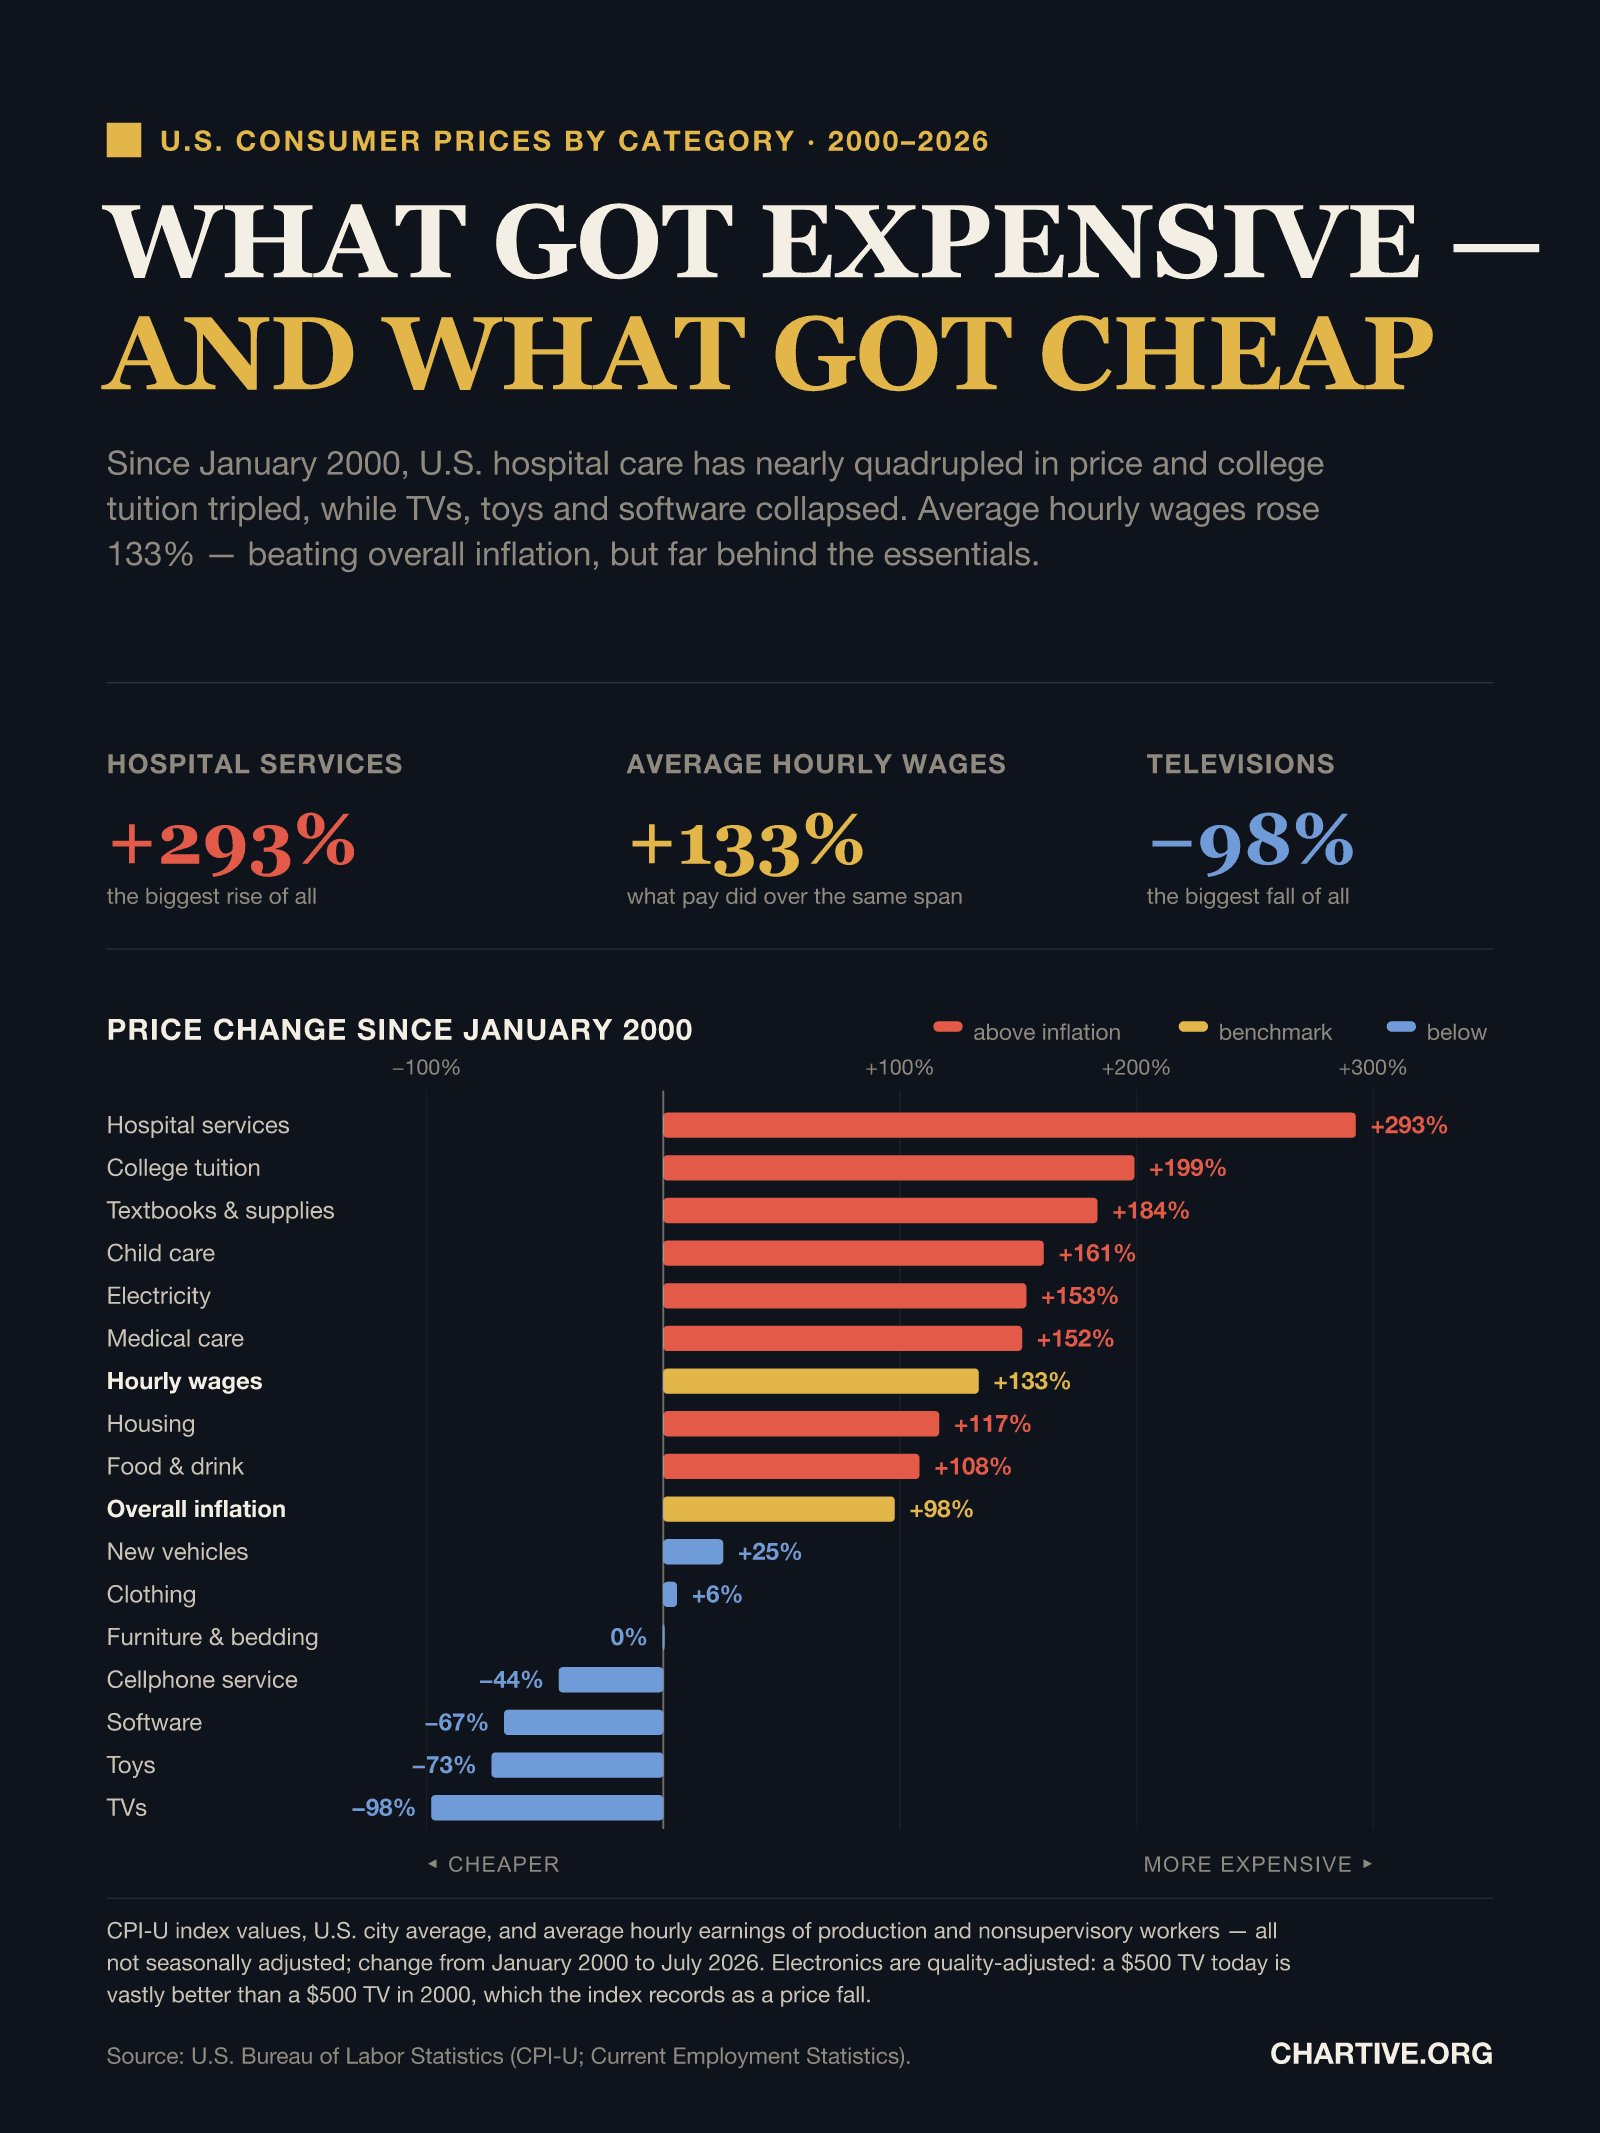
What got expensive — and what got cheap
Since January 2000, U.S. hospital care has nearly quadrupled in price and college tuition tripled, while TVs, toys and software collapsed. Average hourly wages rose 133% — beating overall inflation, but far behind the essentials.
Chartive Editorial
Economy
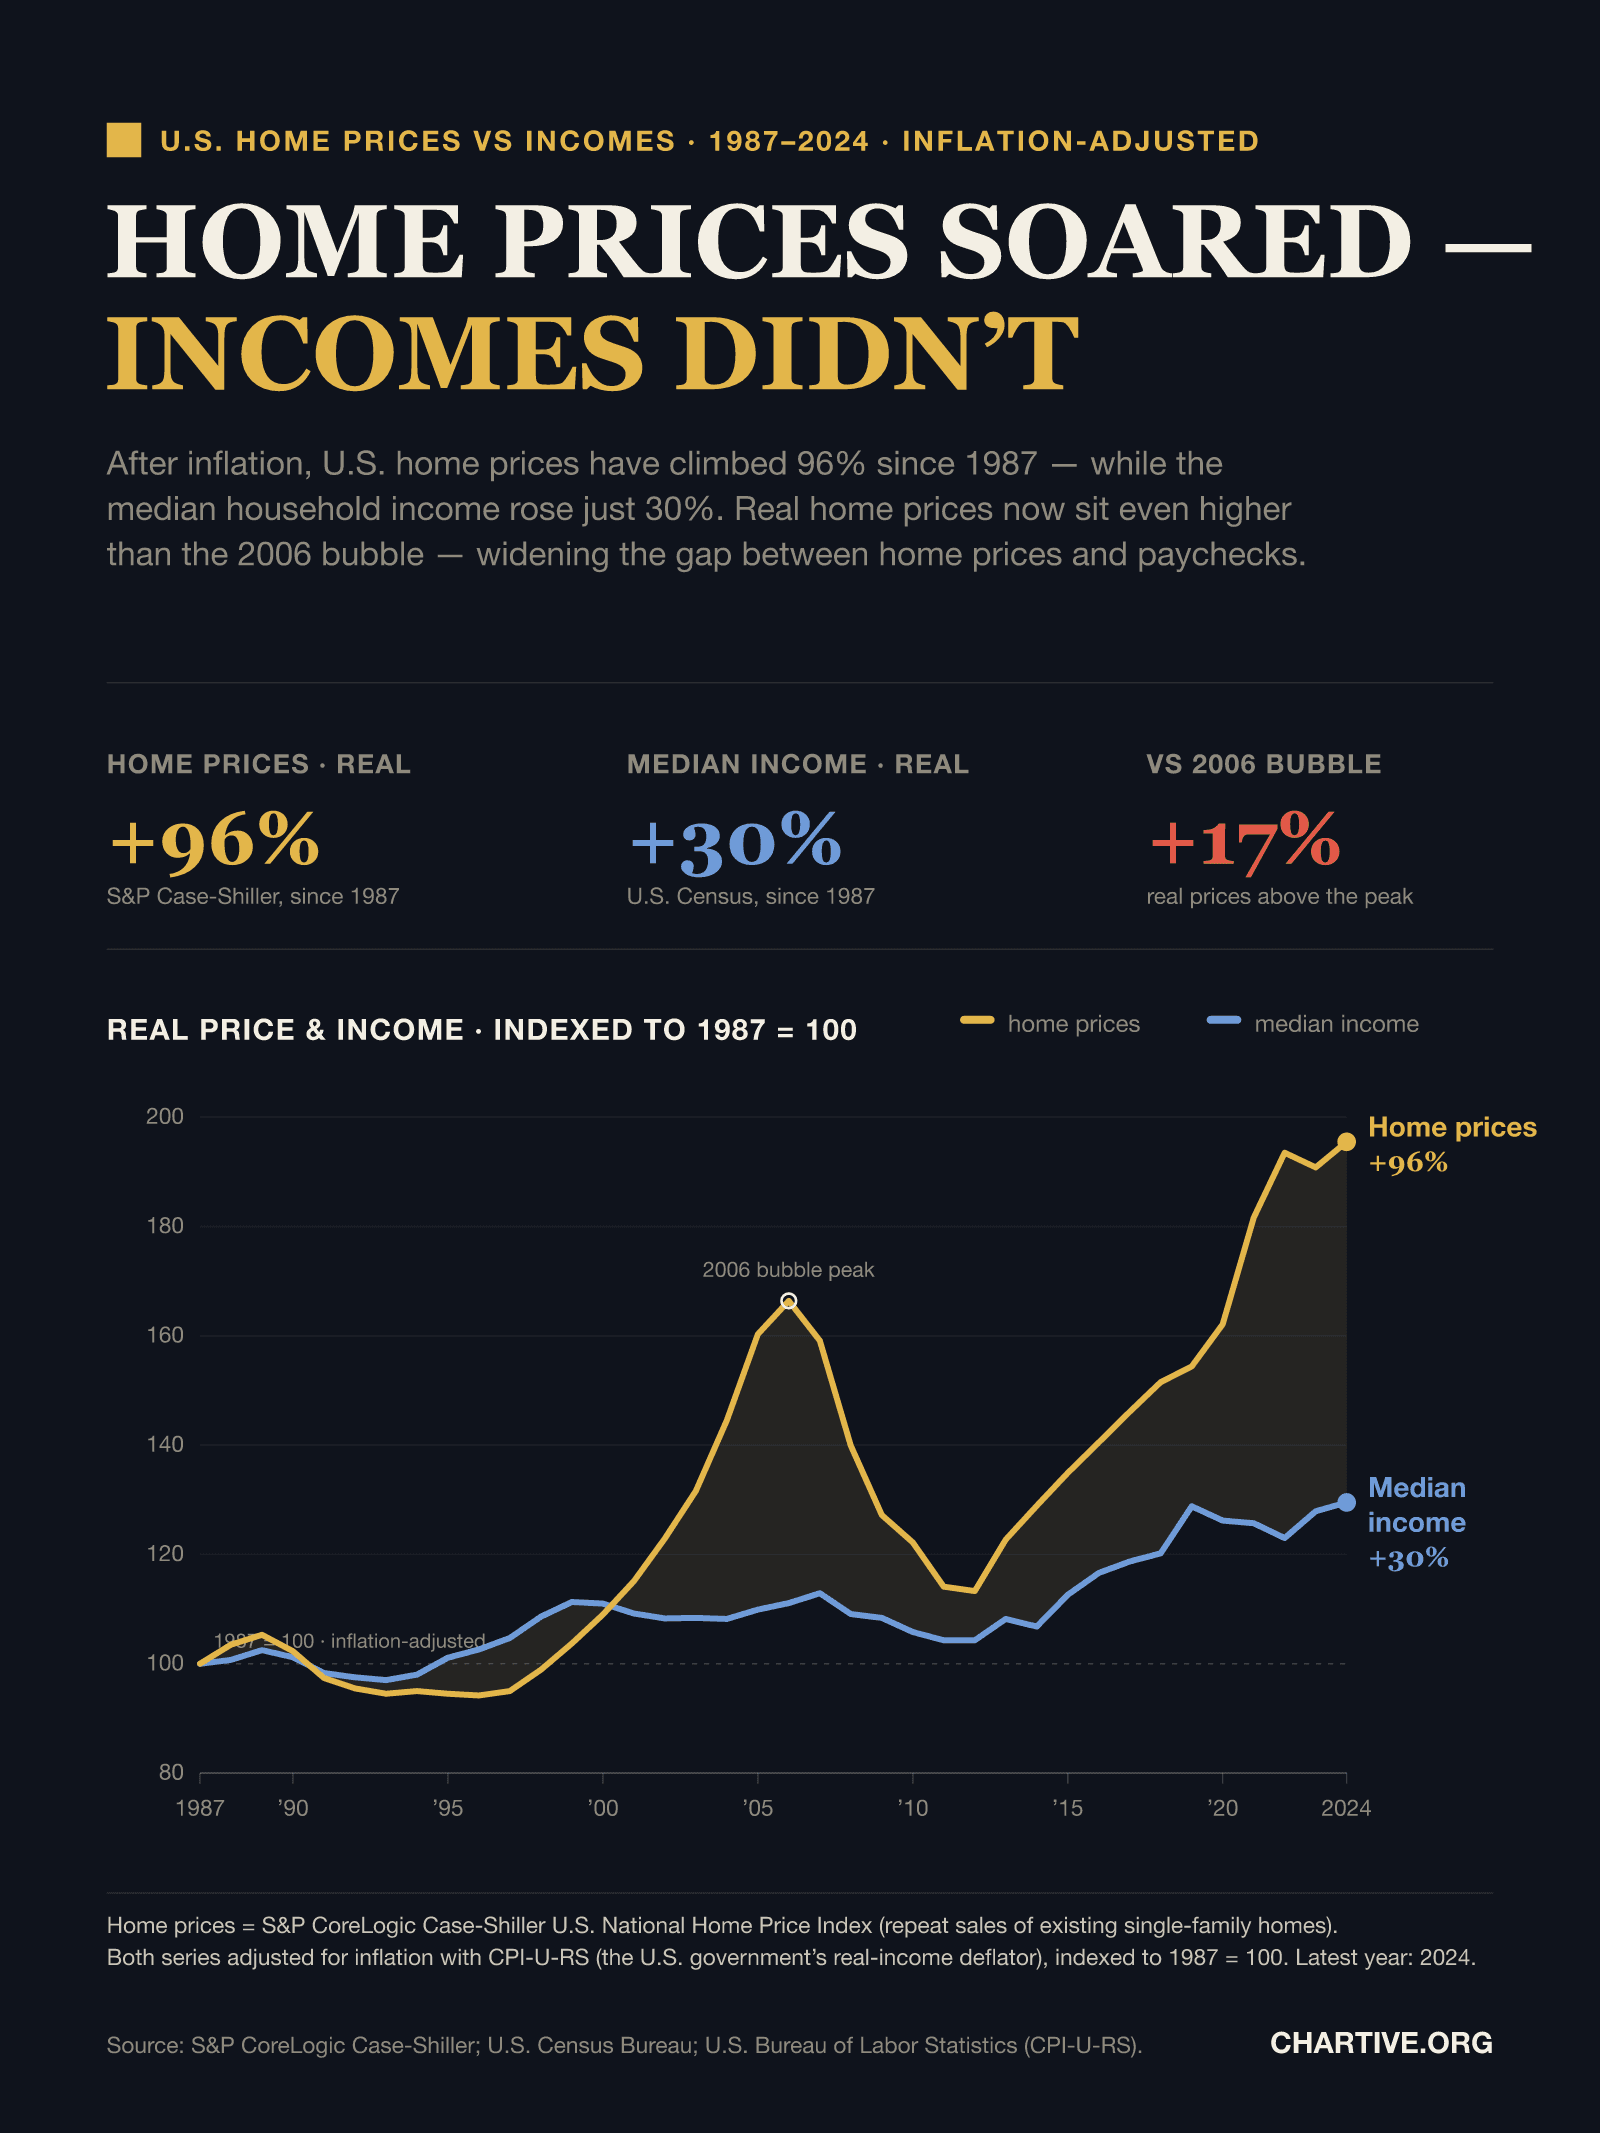
Home prices soared — incomes didn't
After inflation, U.S. home prices climbed 96% between 1987 and 2024 while the median household income rose just 30% — pushing real prices above even the 2006 bubble.
Chartive Editorial
Health
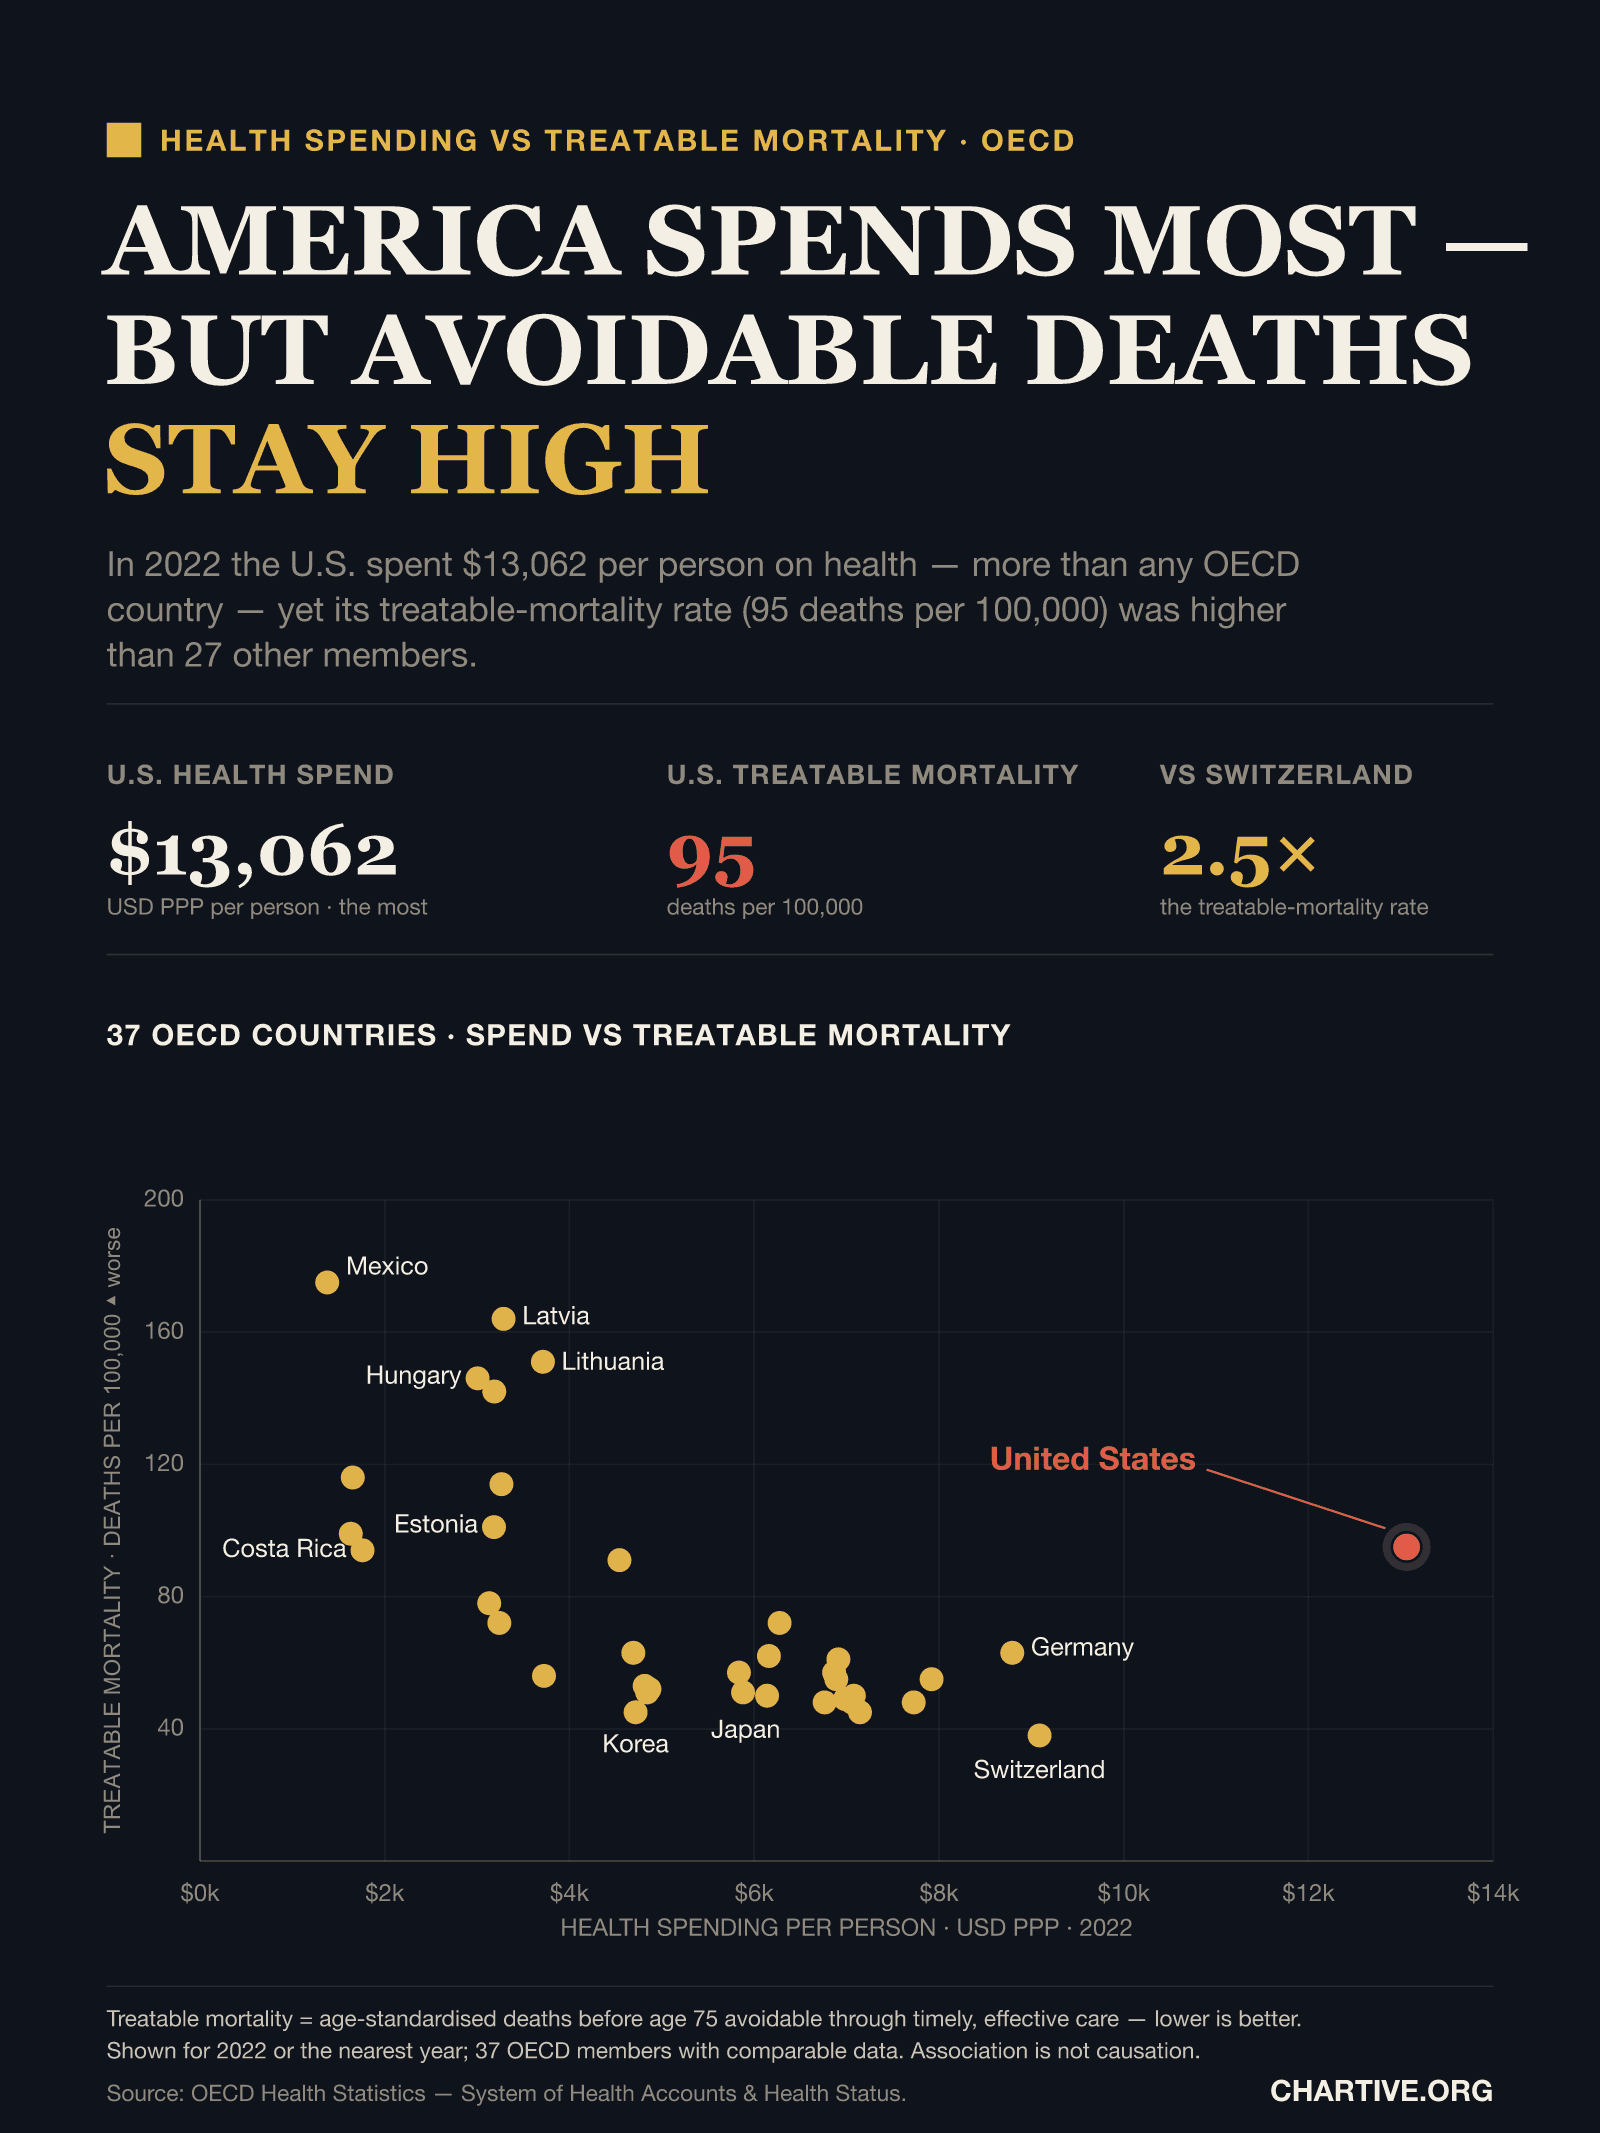
America spends the most on health — but avoidable deaths stay high
In 2022 the U.S. spent $13,062 per person on health — more than any OECD country — yet its treatable-mortality rate (95 deaths per 100,000) was higher than 27 other members.
Chartive Editorial
Society
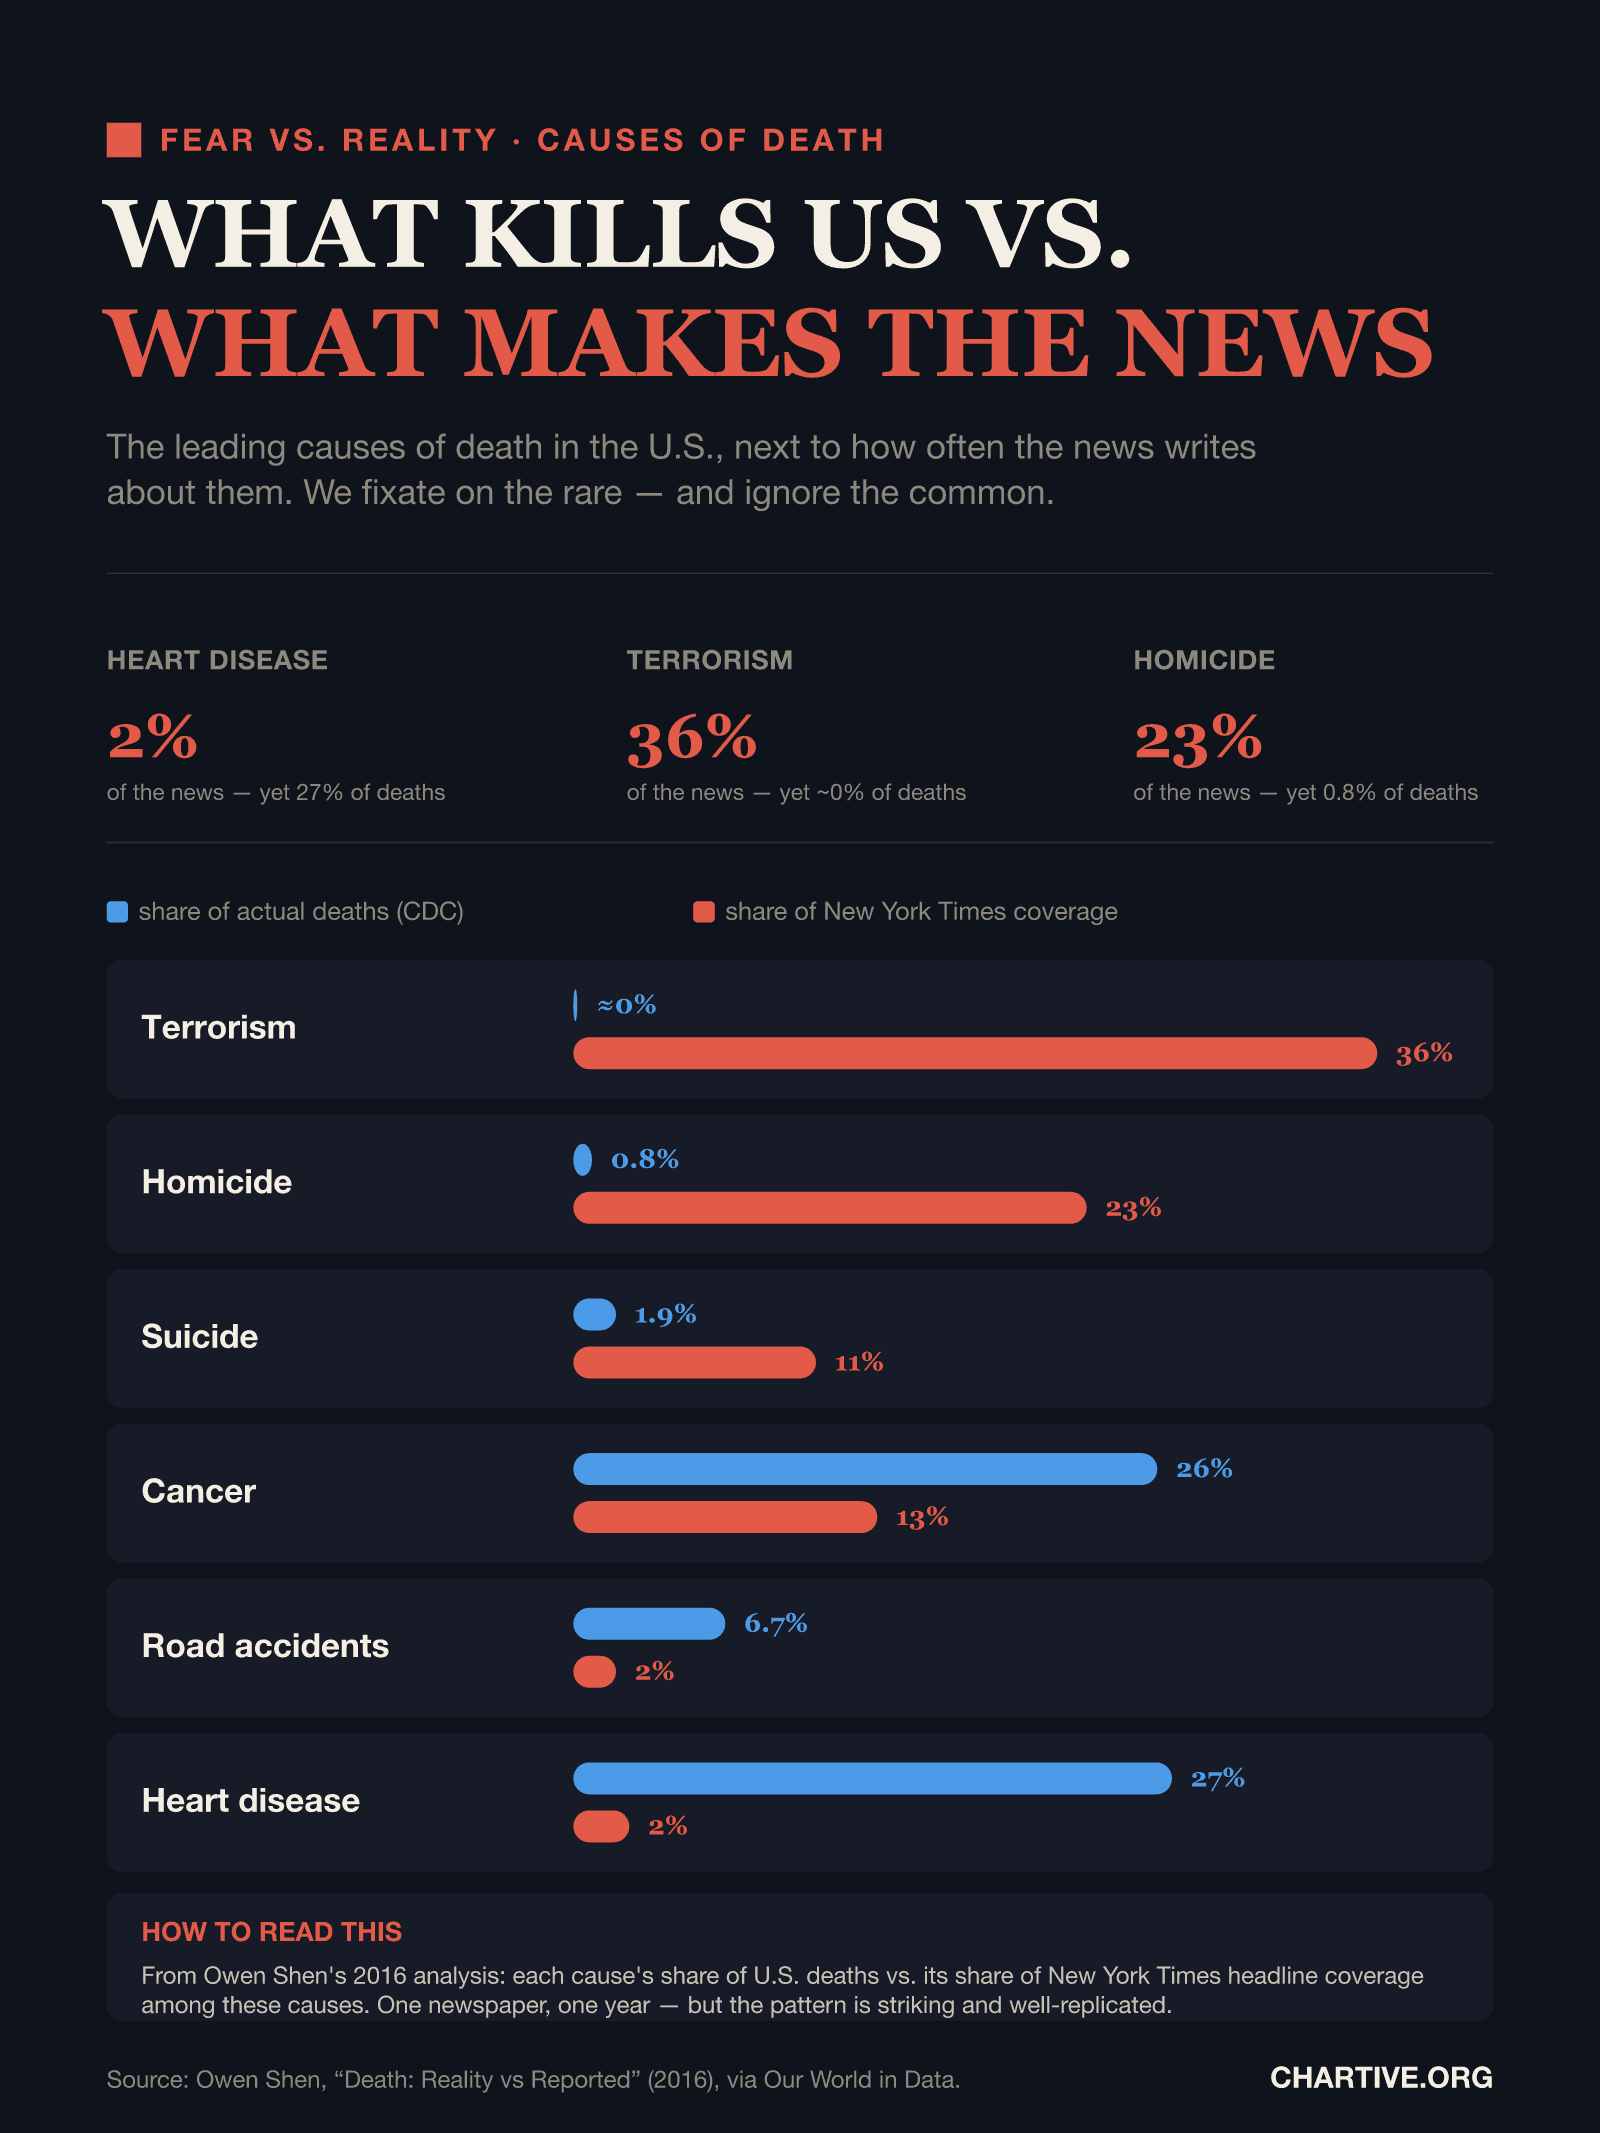
What kills us vs. what makes the news
The leading causes of death in the U.S., next to how often the news writes about them. We fixate on the rare — and ignore the common.
Chartive Editorial
Society
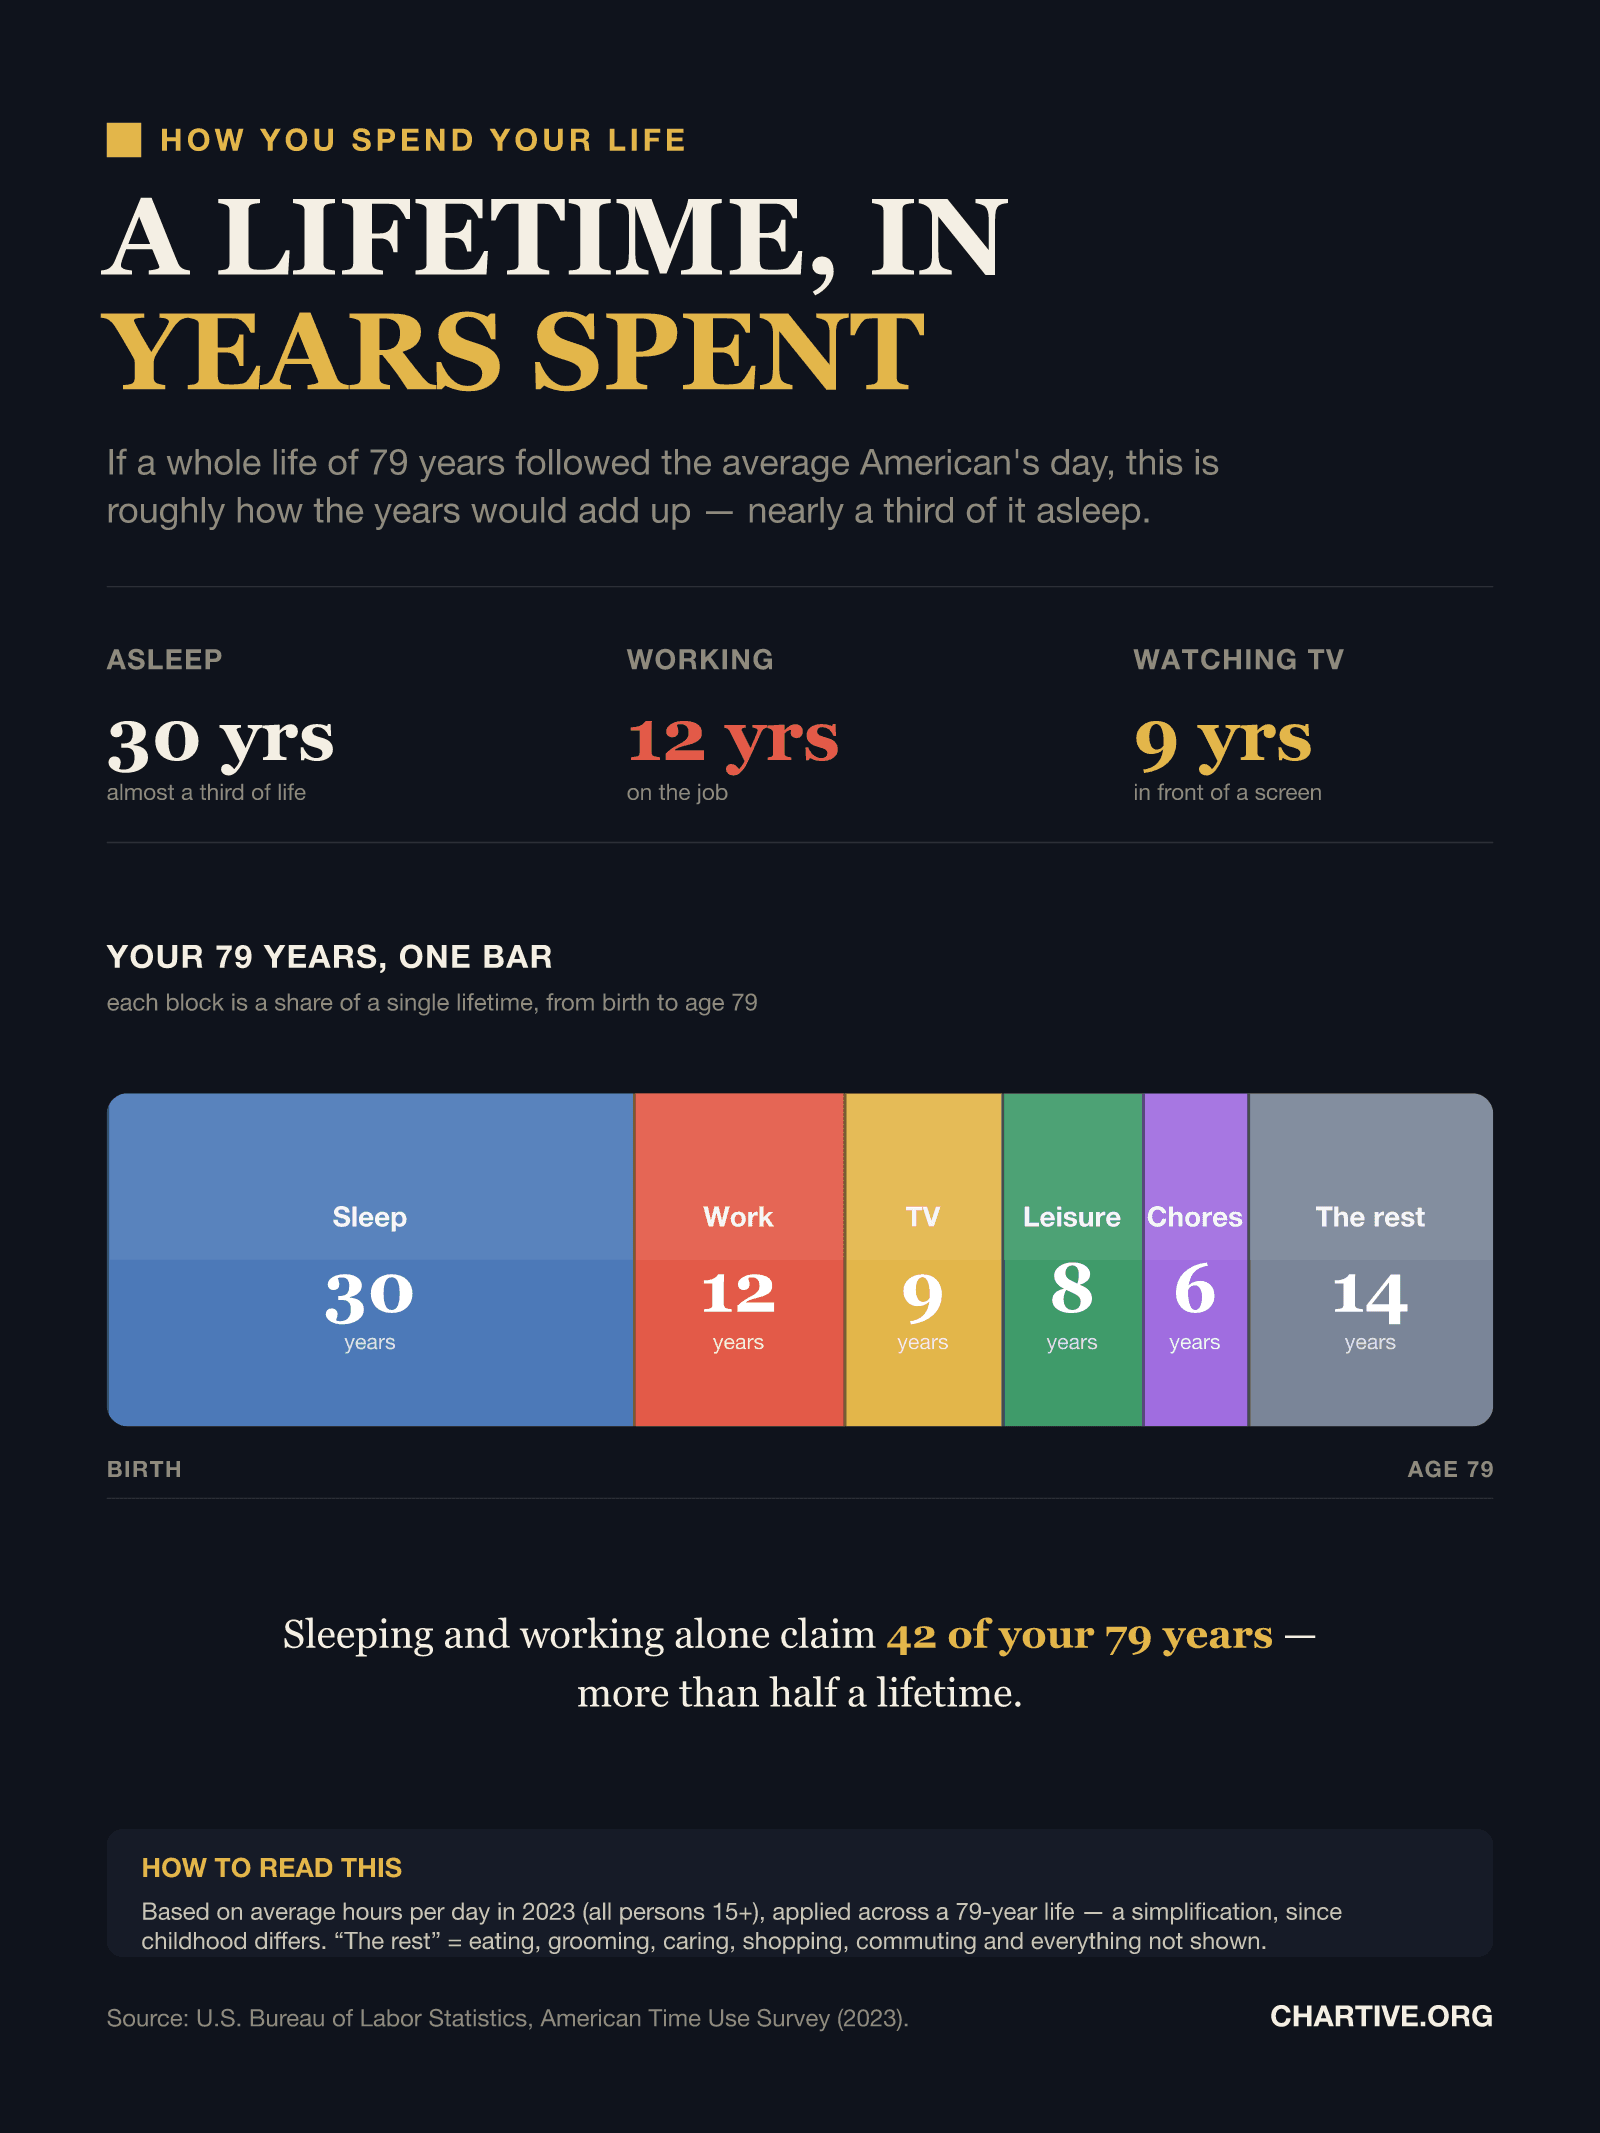
How you'll spend a 79-year life
If a whole life of 79 years followed the average American's day, this is roughly how the years add up — nearly a third of it asleep, and more than half sleeping or working.
Chartive Editorial
Health
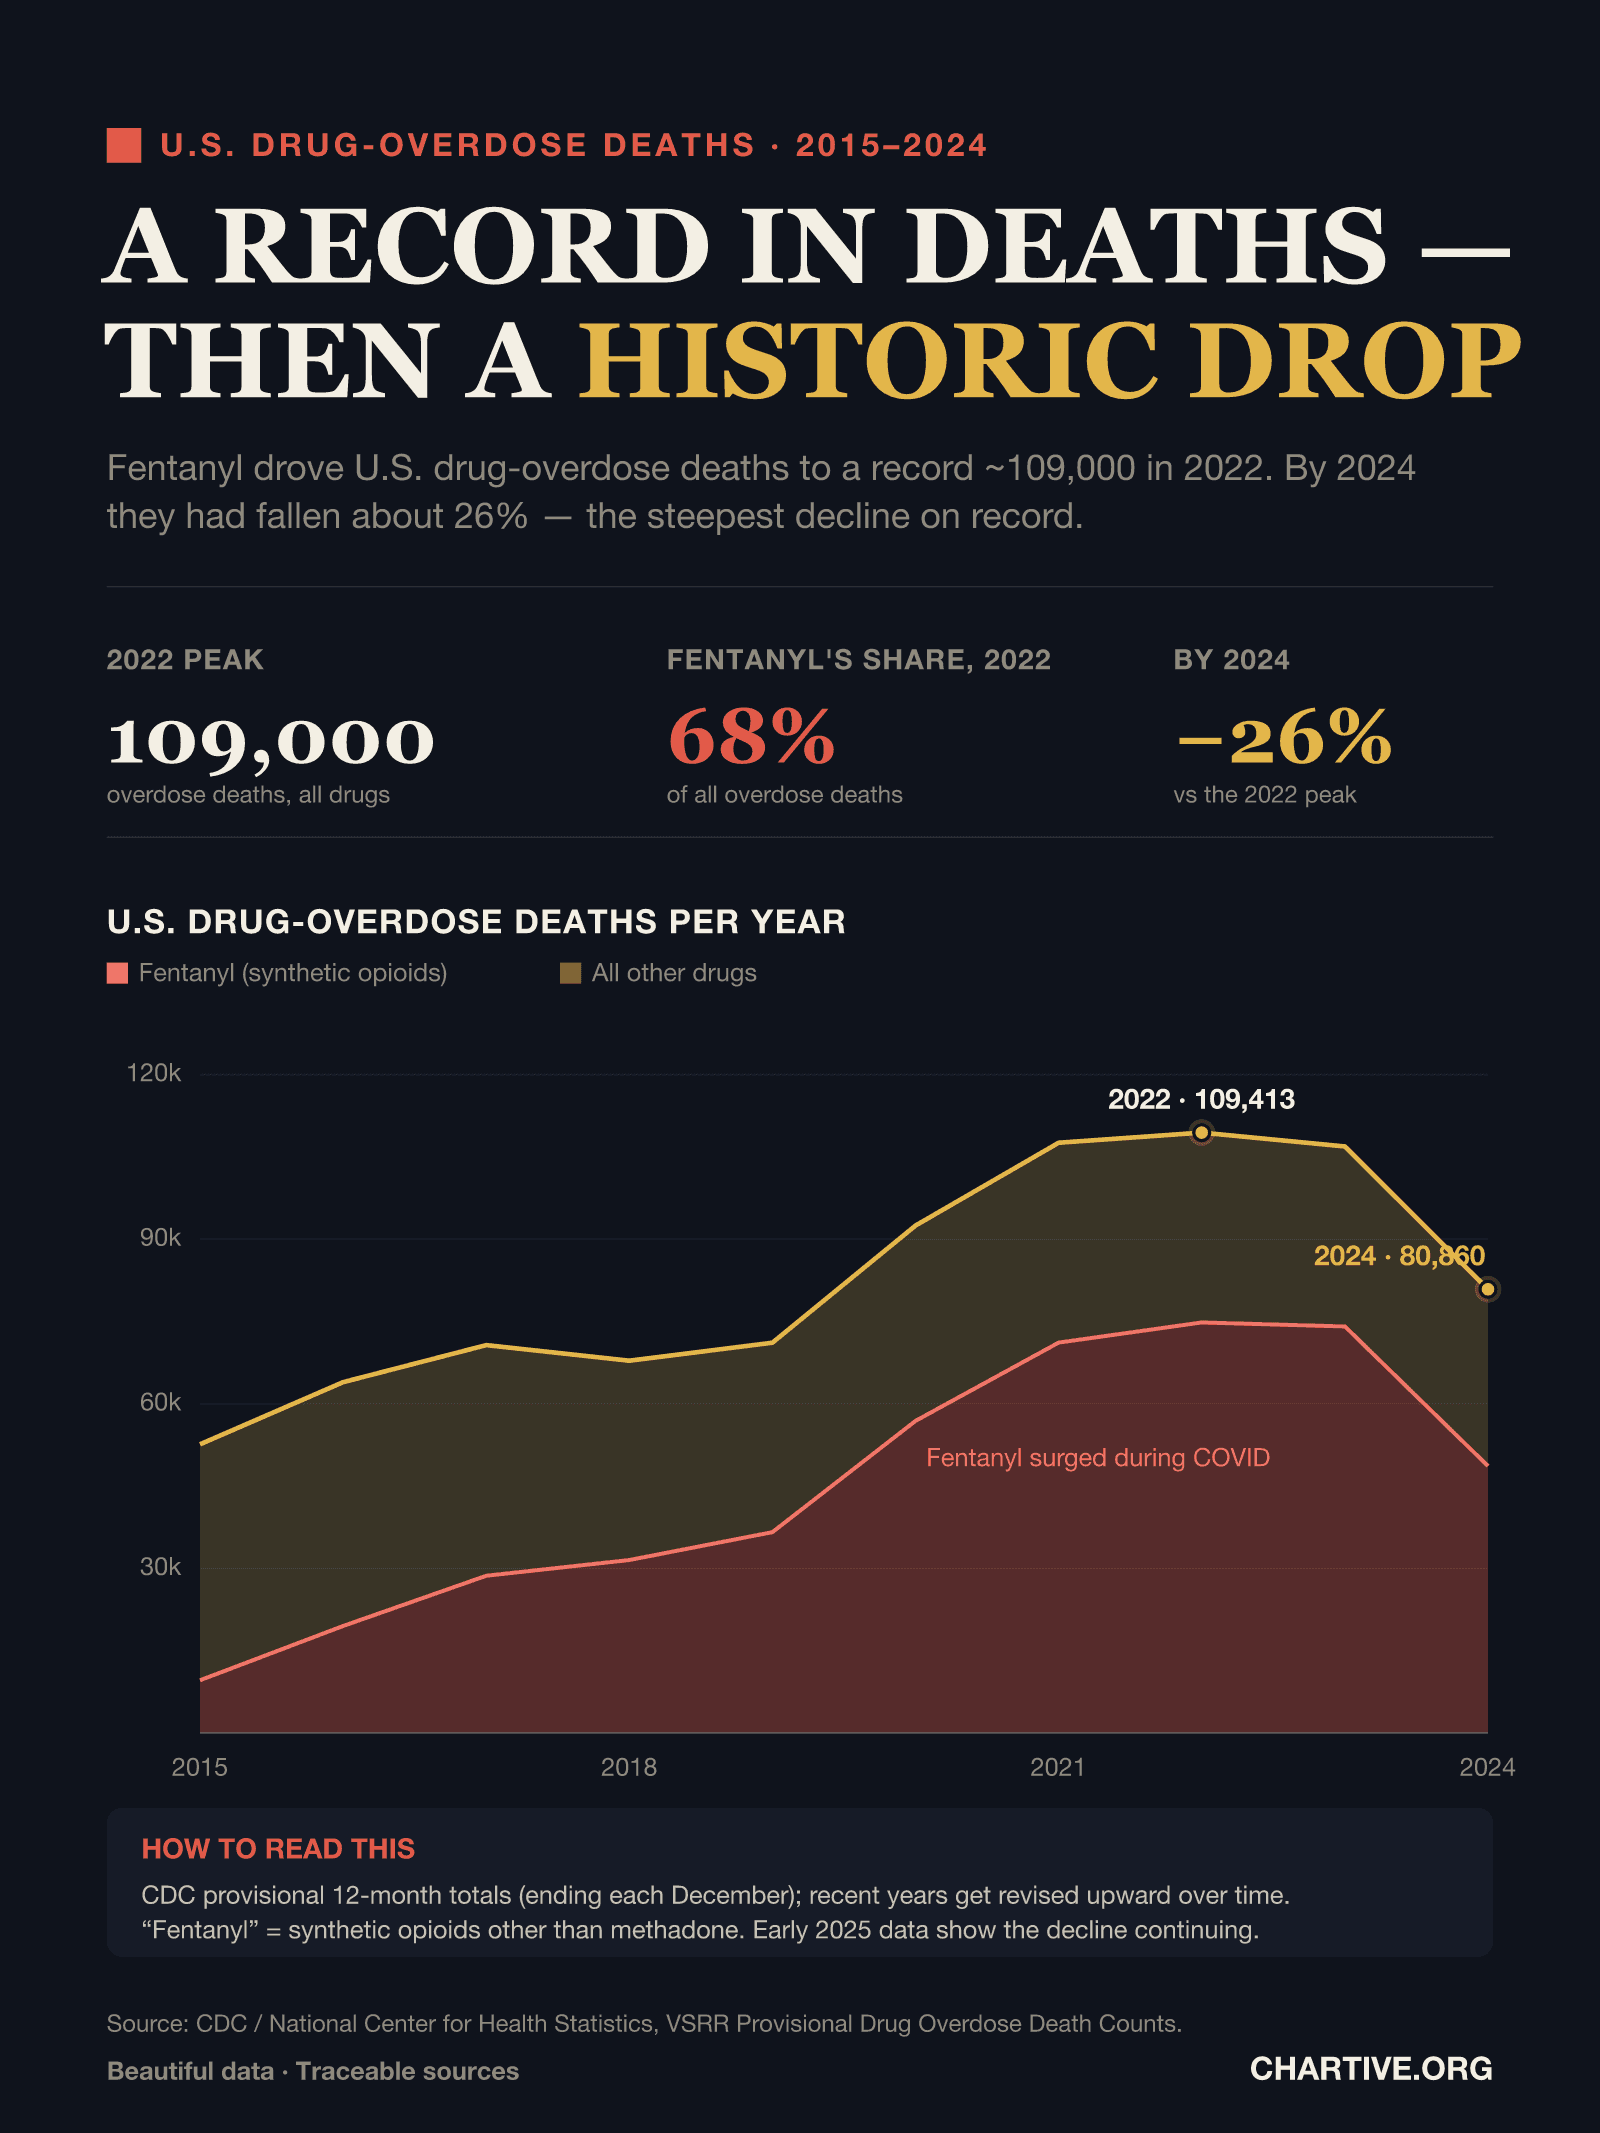
U.S. overdose deaths hit a record — then a historic drop
Fentanyl drove U.S. drug-overdose deaths to a record of about 109,000 in 2022. By 2024 they had fallen roughly 26% — the steepest decline on record.
Chartive Editorial
Health
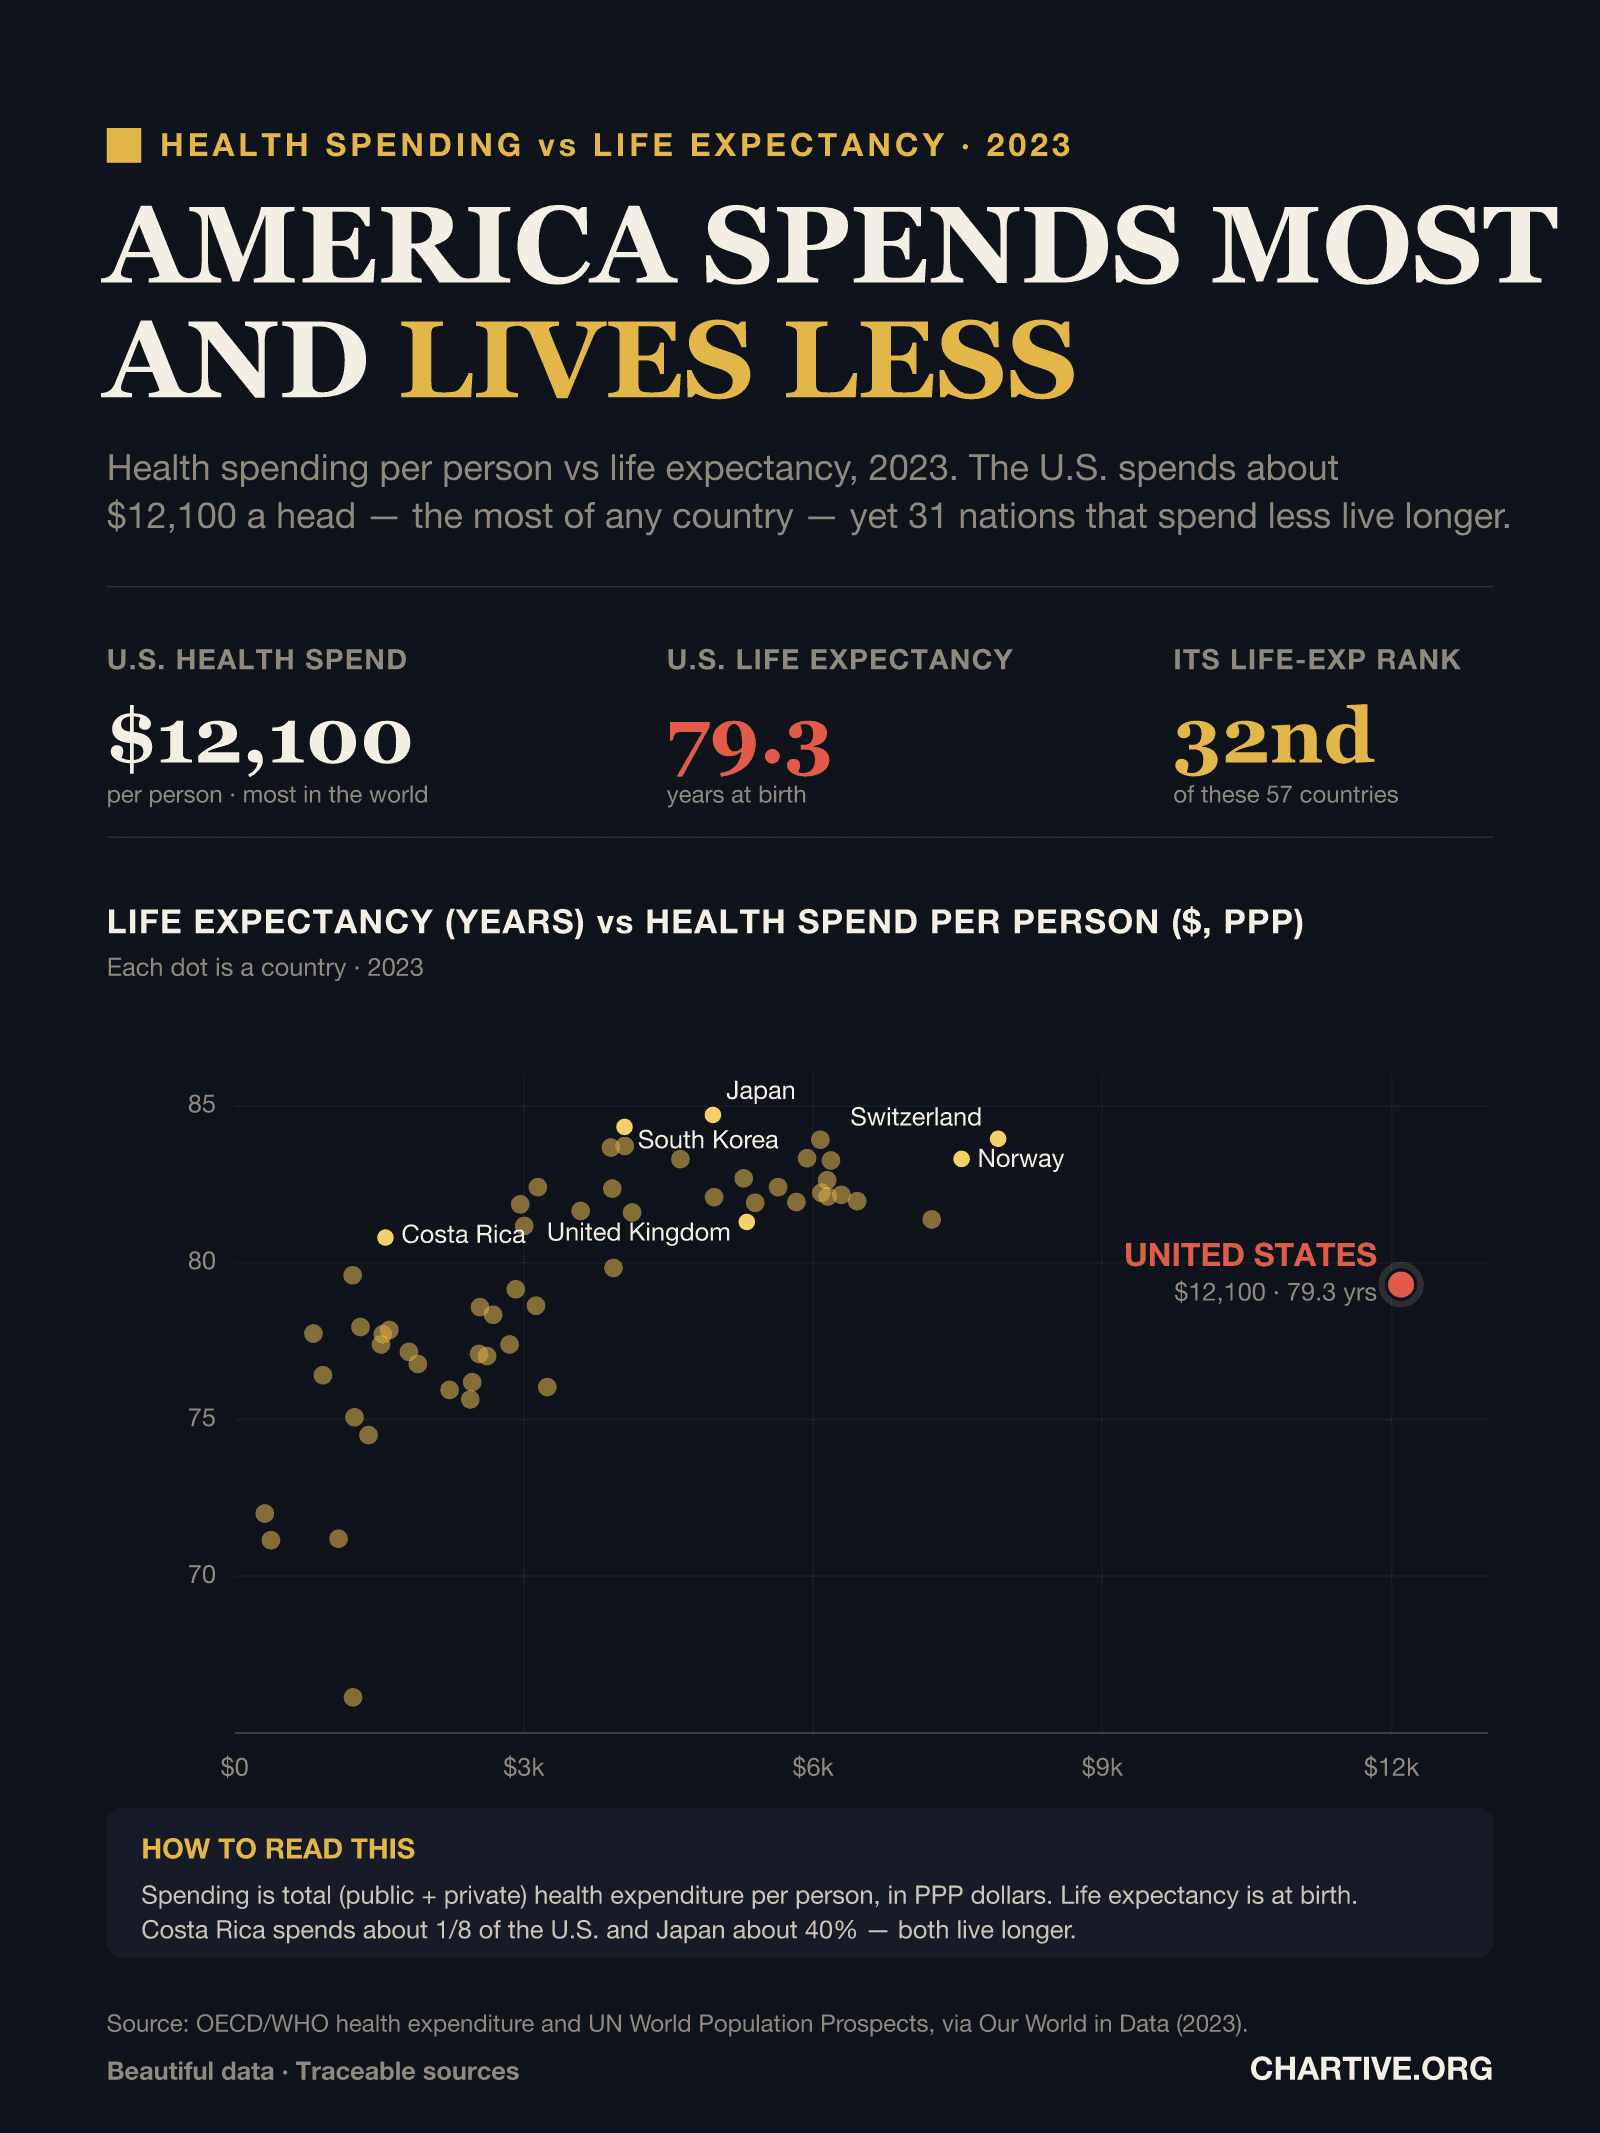
America spends the most on health — and lives less
Health spending per person vs life expectancy across 57 countries in 2023. The U.S. spends about $12,100 a head — the most of any country — yet 31 nations that spend less live longer.
Chartive Editorial
Economy
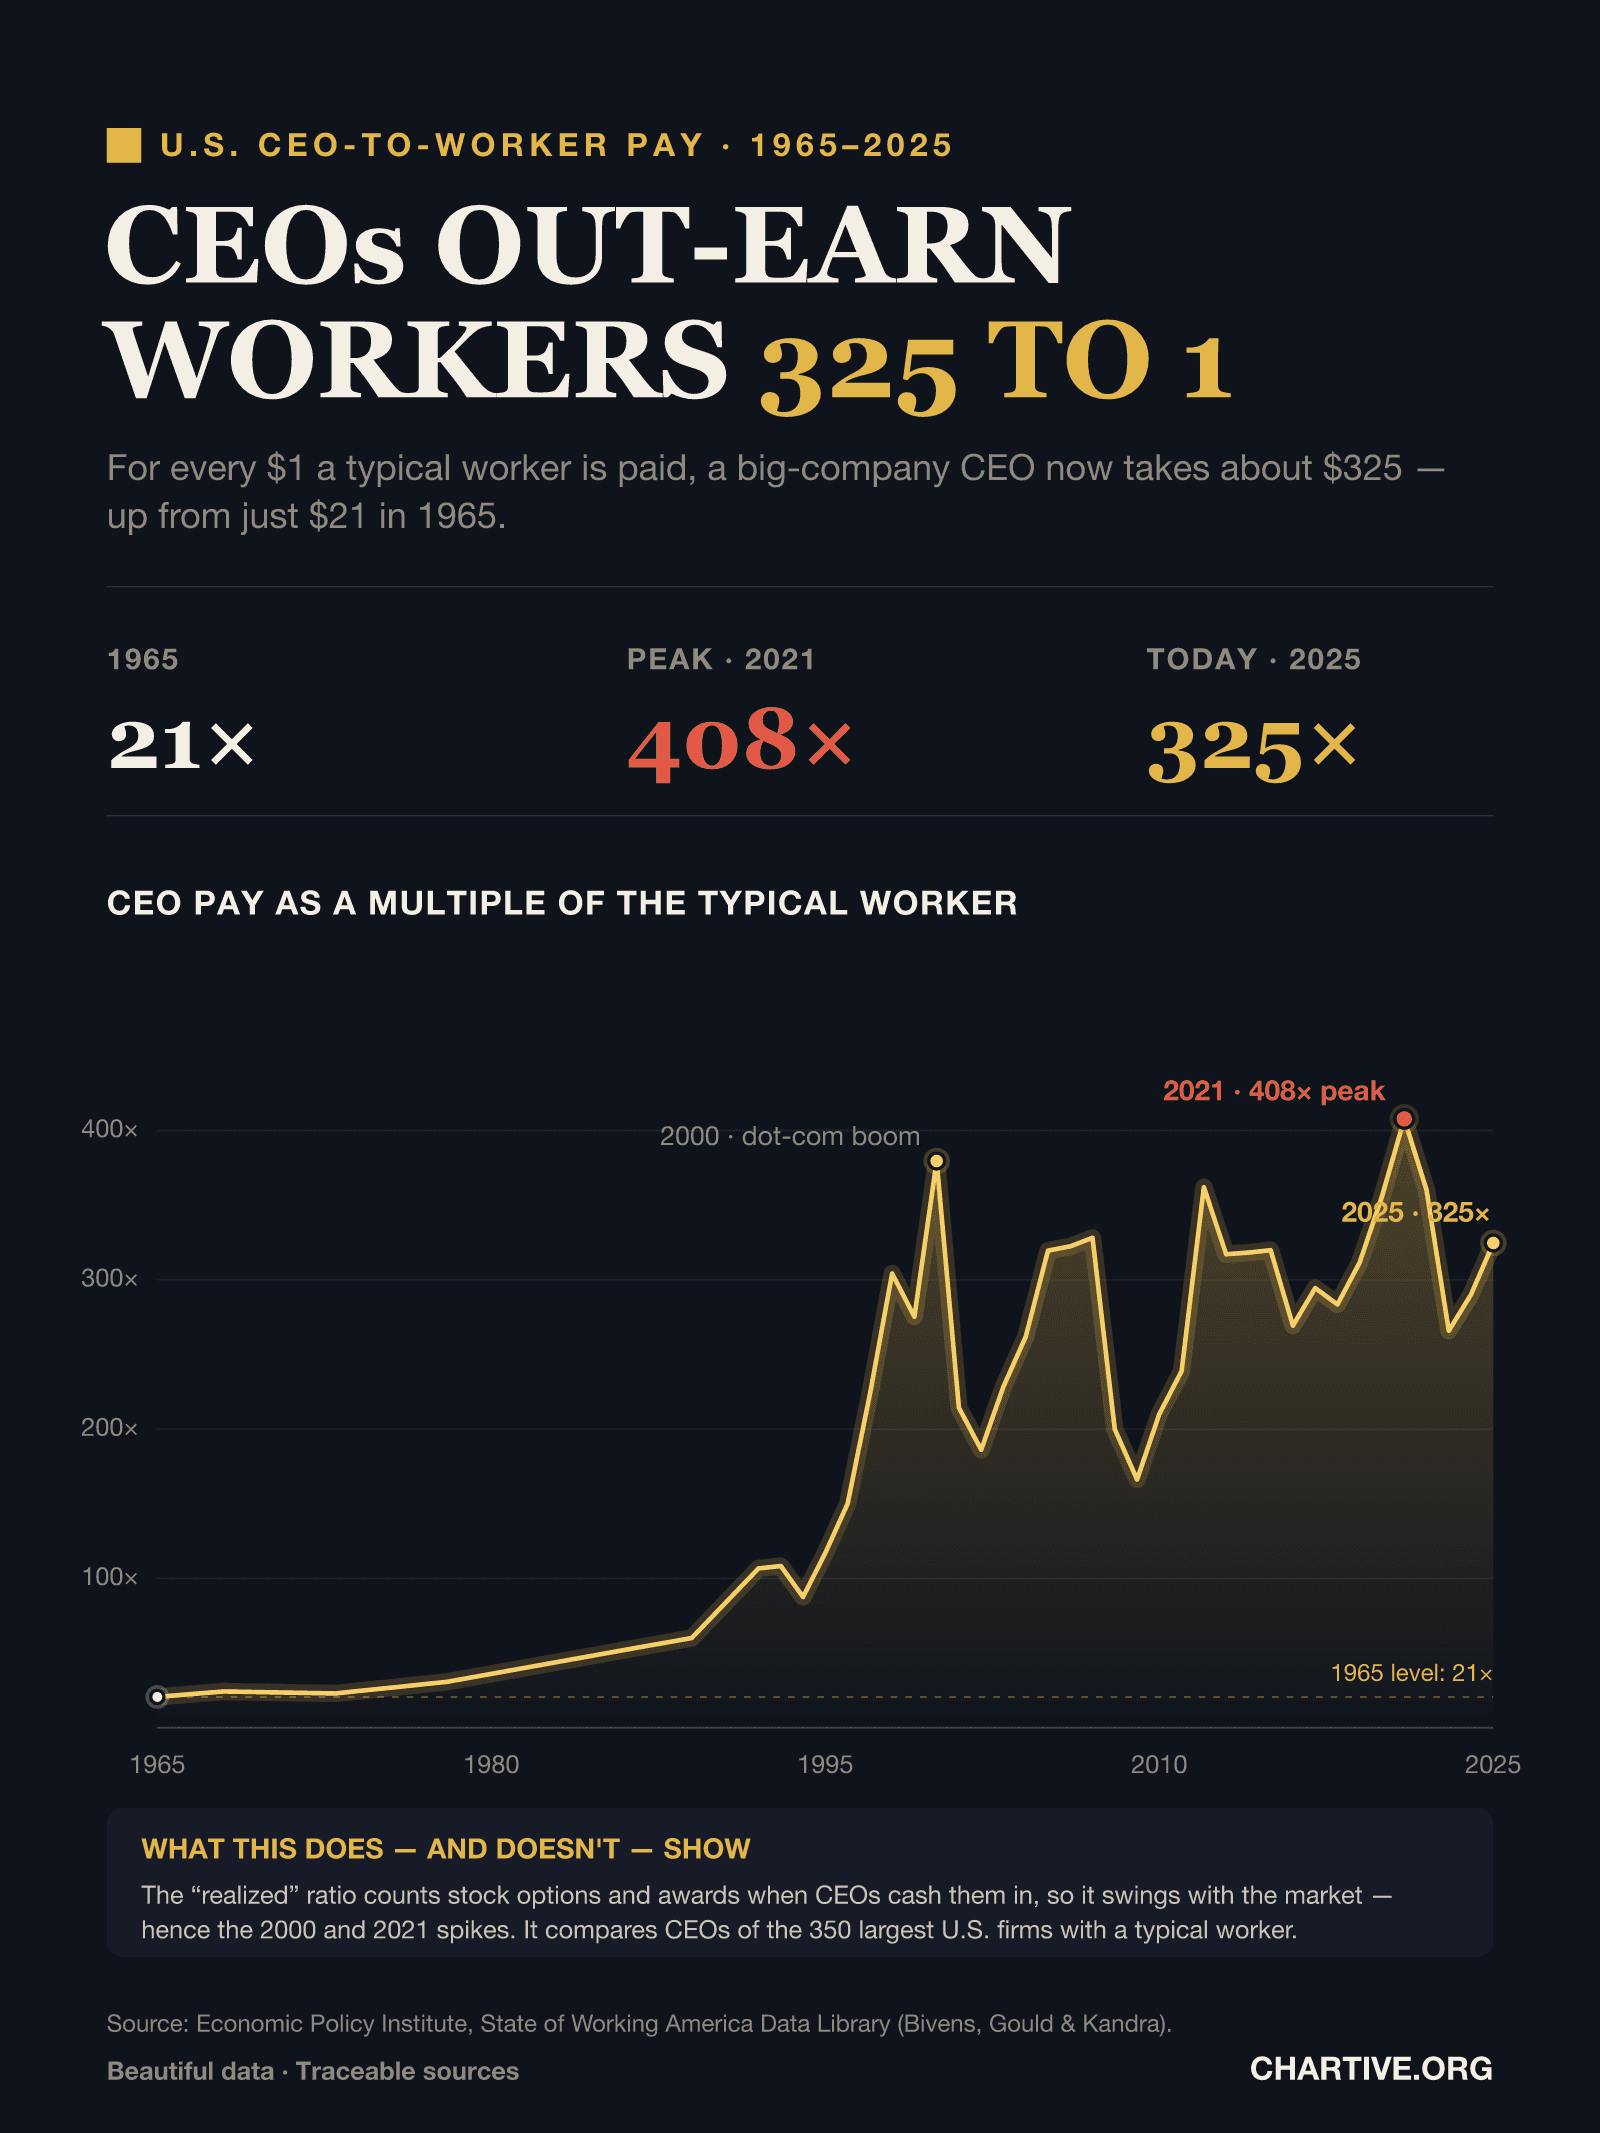
CEOs out-earn workers 325 to 1
How many times more the average big-company CEO is paid than a typical U.S. worker — up from about 21-to-1 in 1965 to roughly 325-to-1 in 2025, after peaking at 408-to-1 in 2021.
Chartive Editorial
History
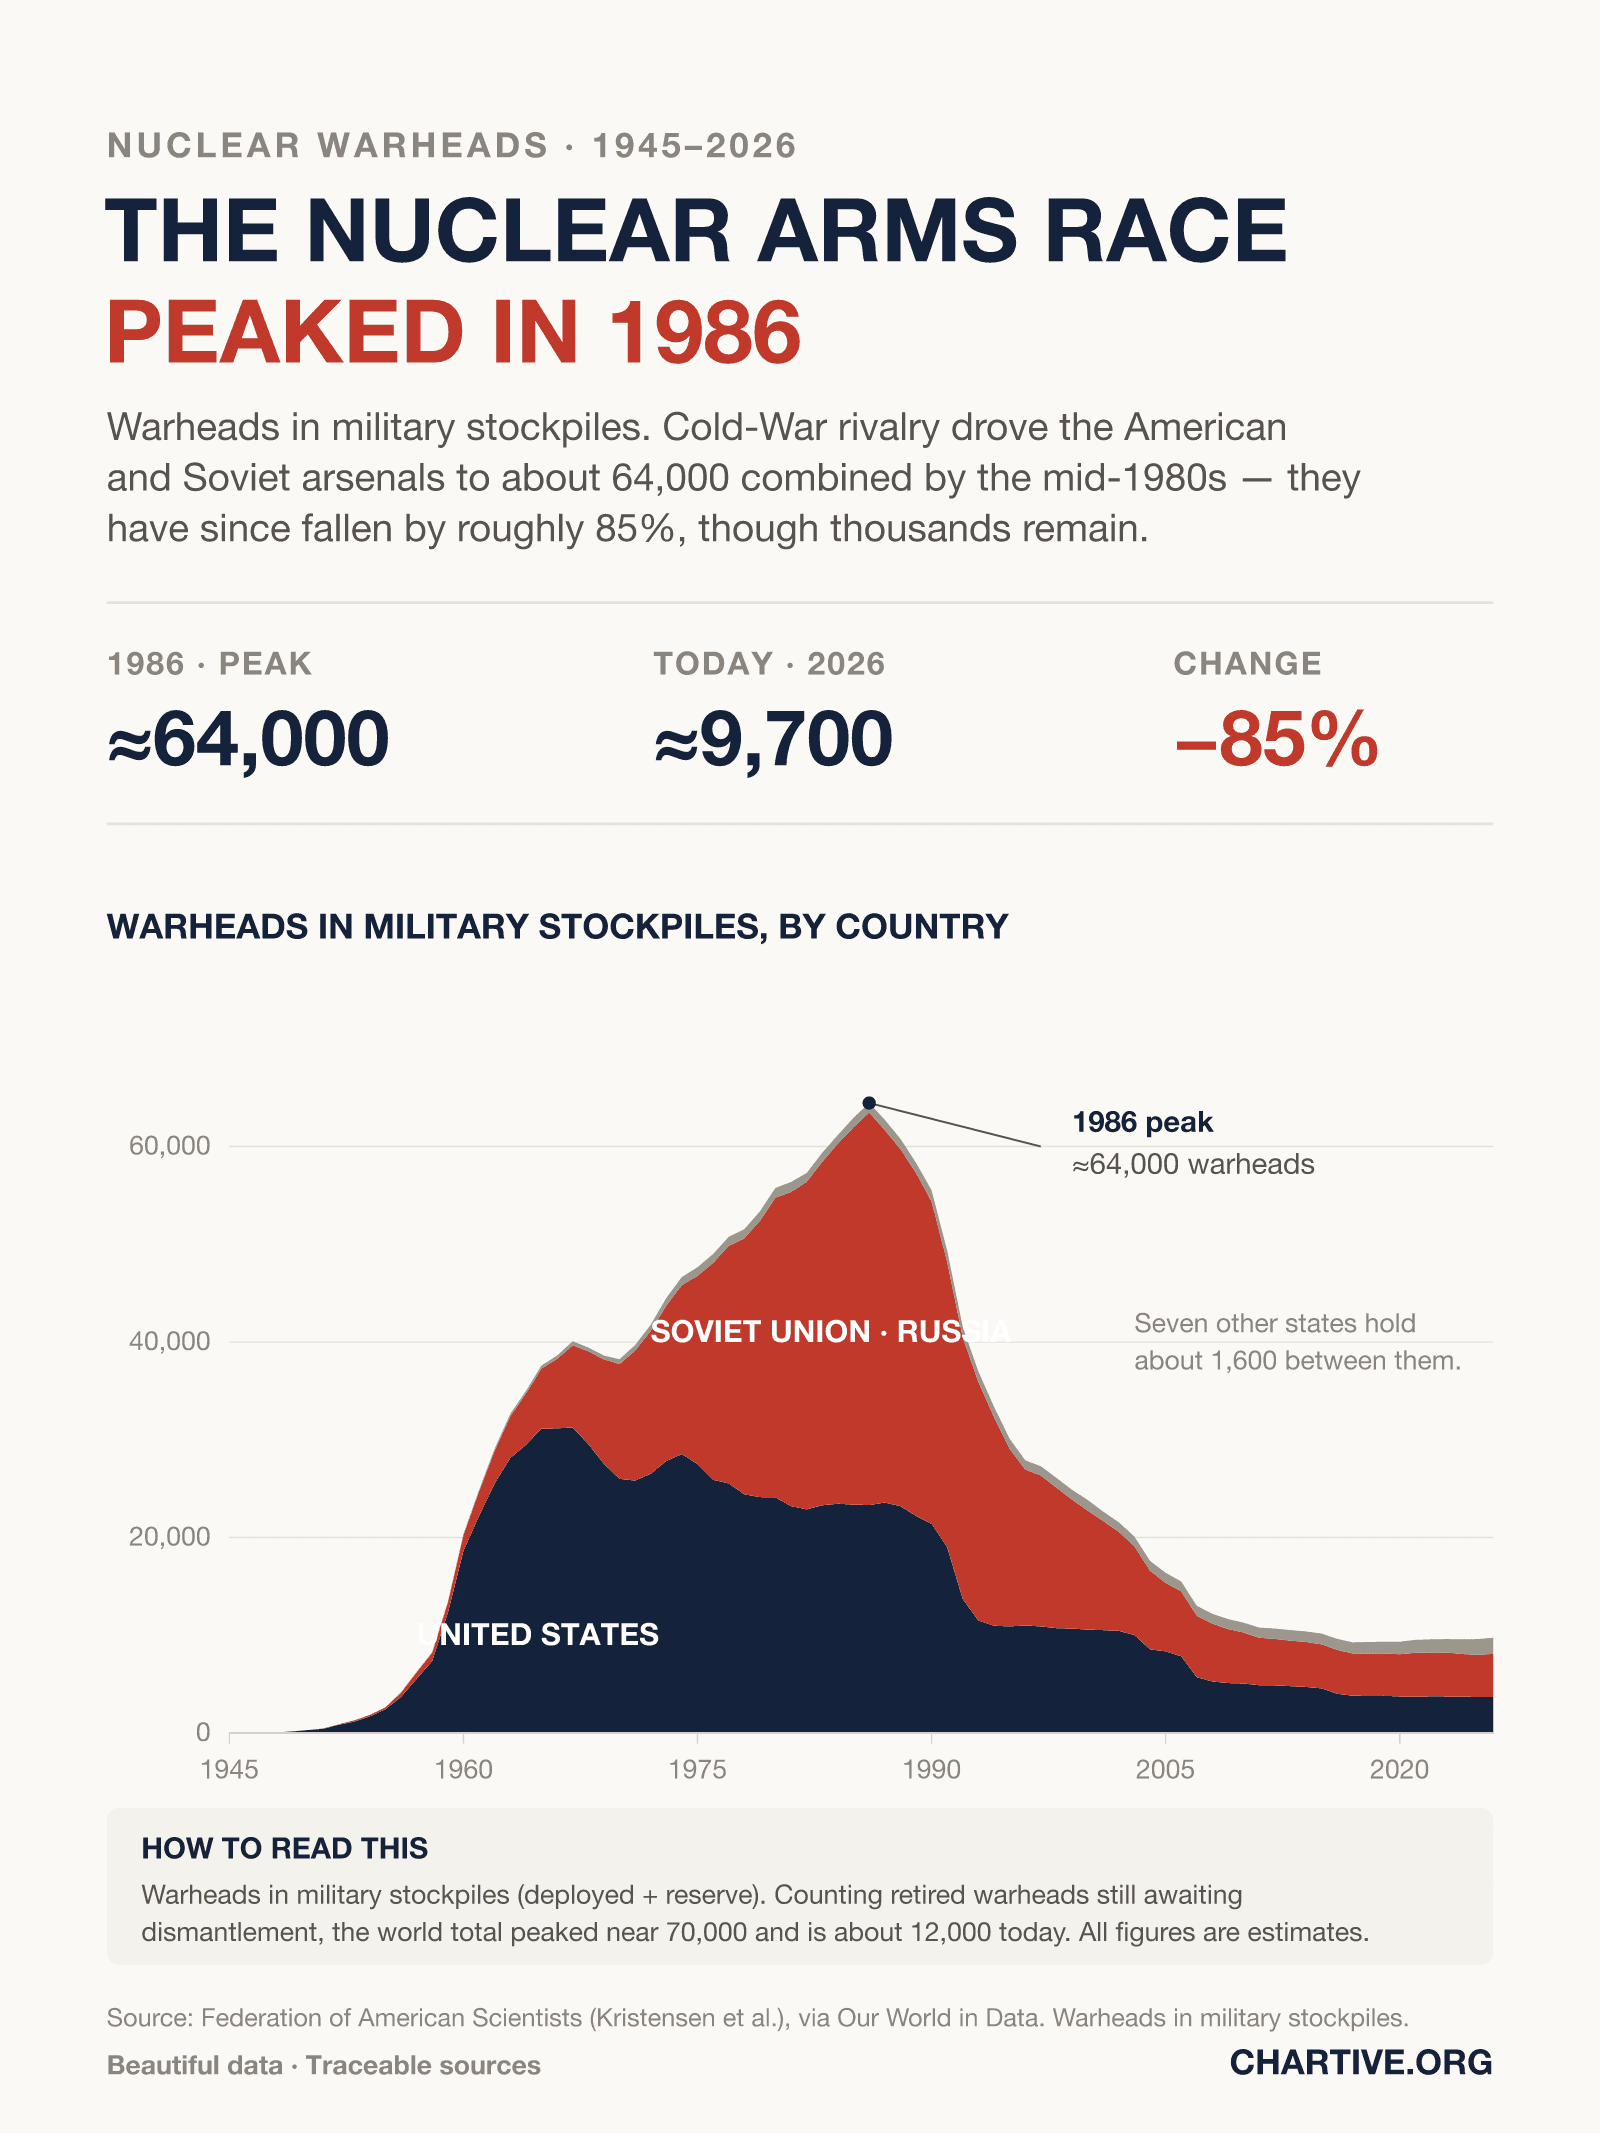
The nuclear arms race peaked in 1986
Warheads in military stockpiles. Cold-War rivalry drove the American and Soviet arsenals to about 64,000 combined by the mid-1980s; they have since fallen by roughly 85%, though thousands remain.
Chartive Editorial
Climate
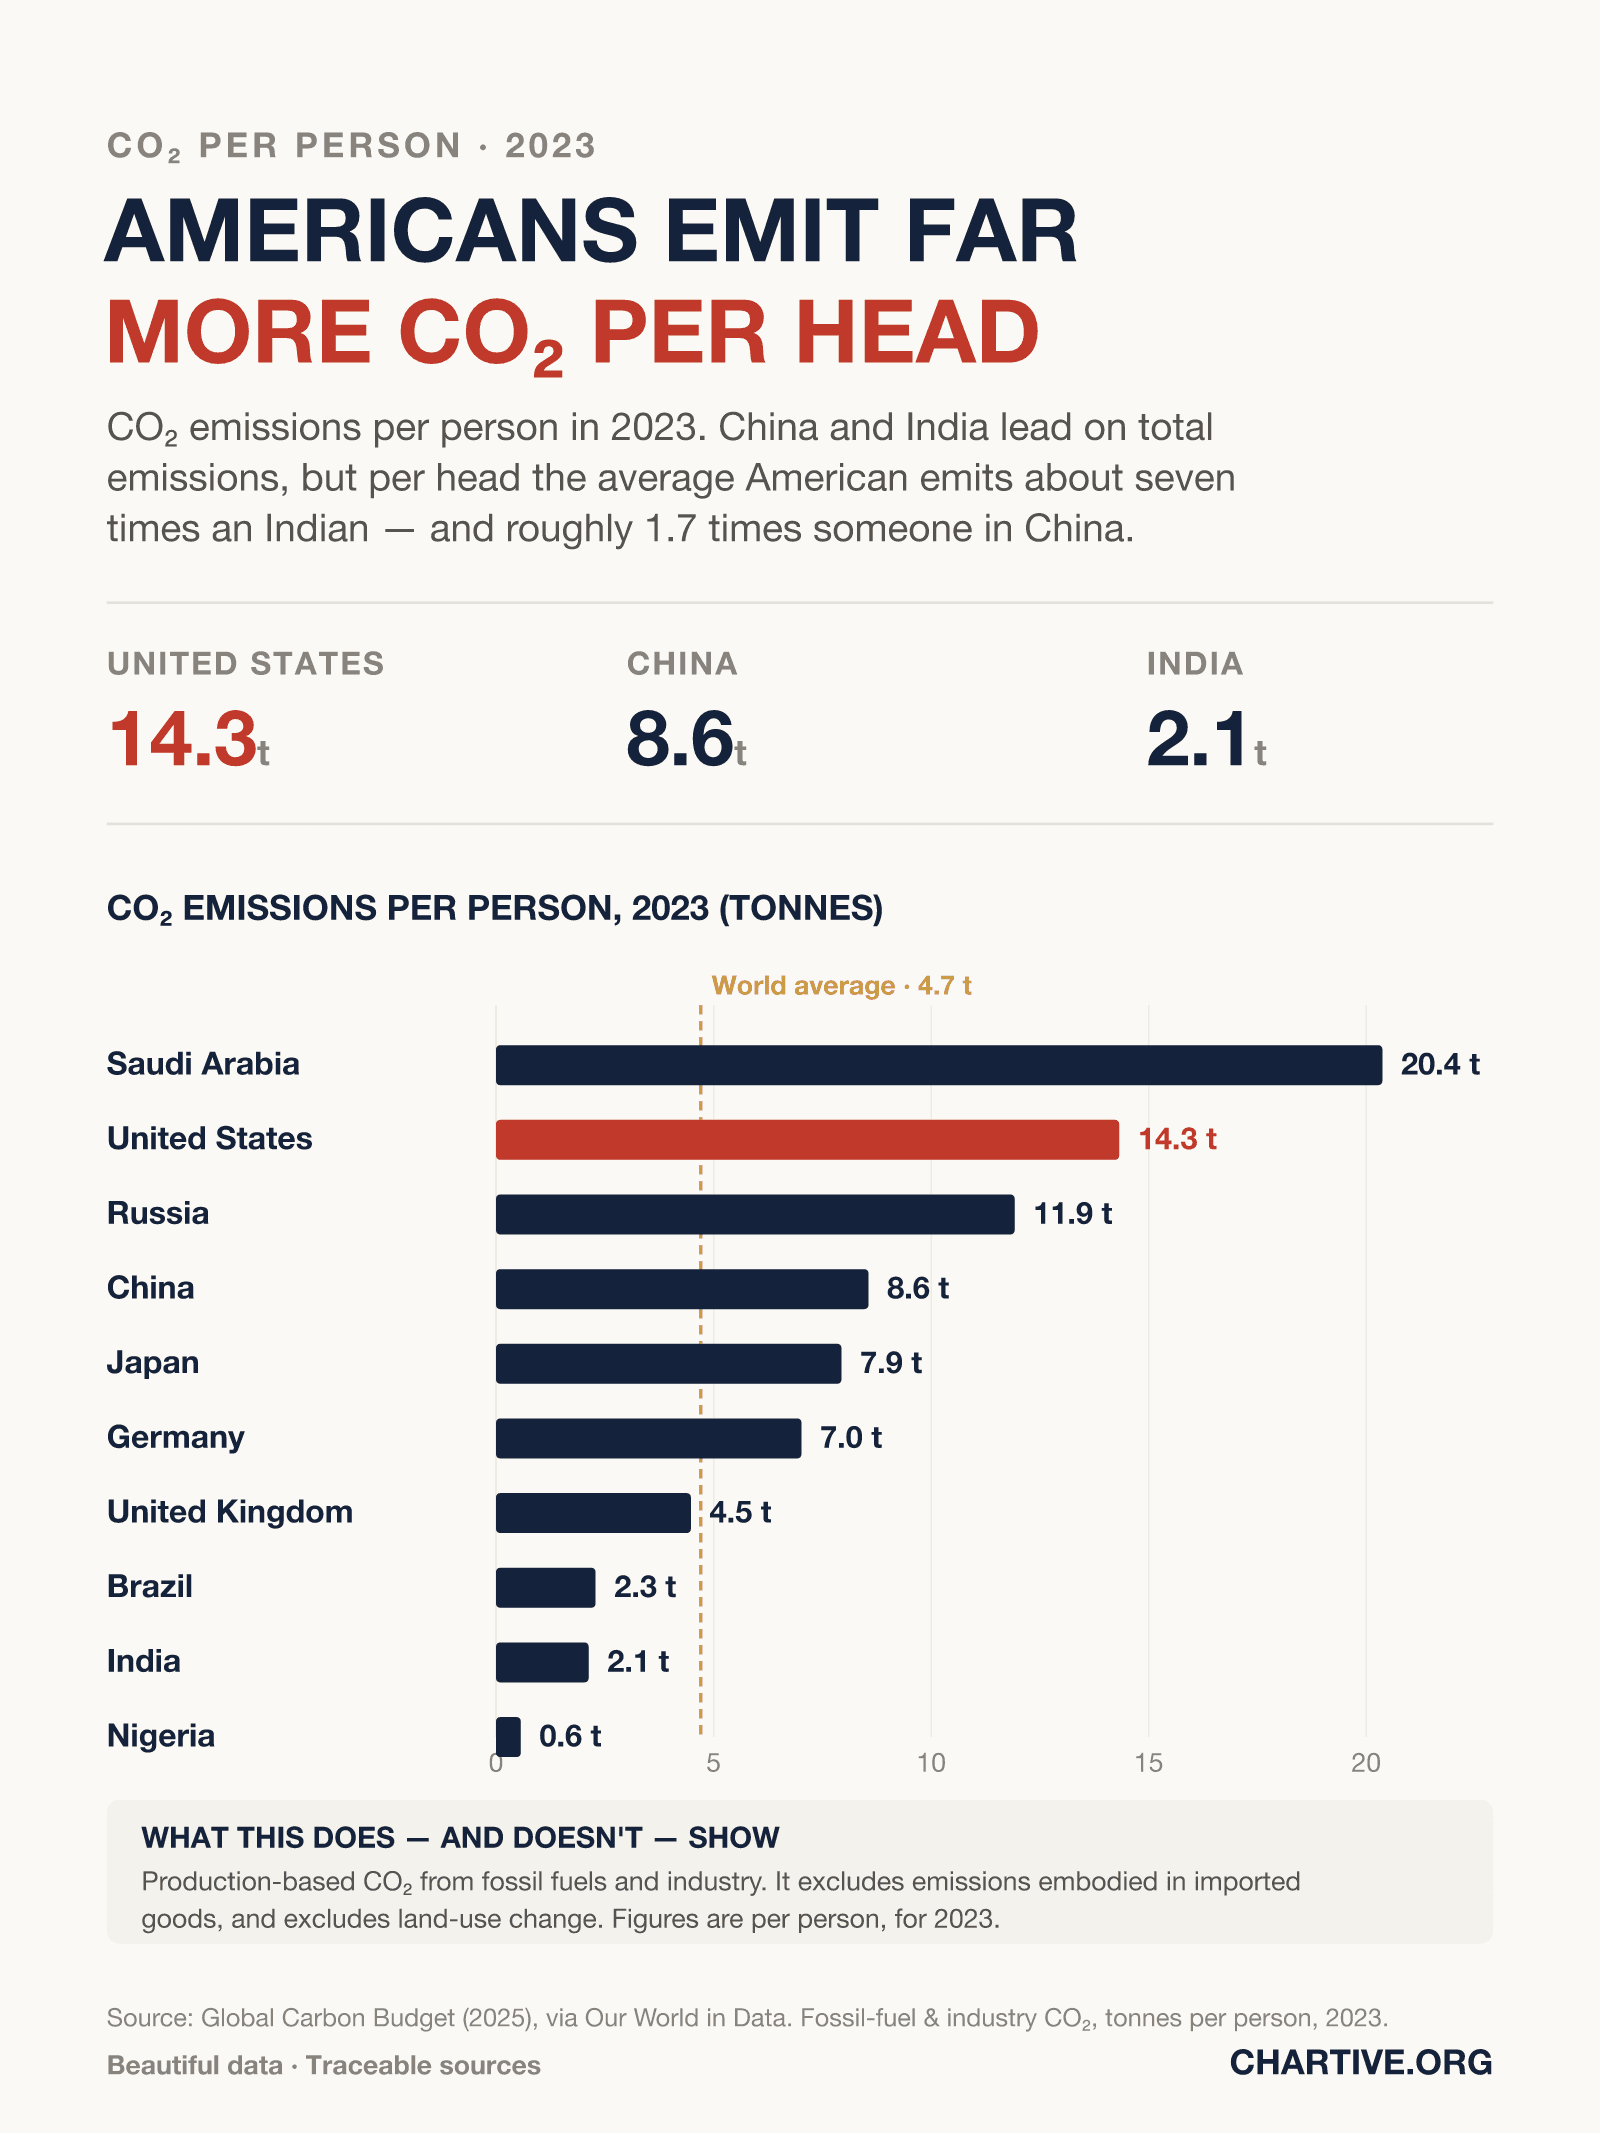
Americans emit far more CO₂ per person than China or India
CO₂ emissions per person in 2023. China and India lead on total emissions, but per head the average American emits about seven times an Indian — and roughly 1.7 times someone in China.
Chartive Editorial
Health
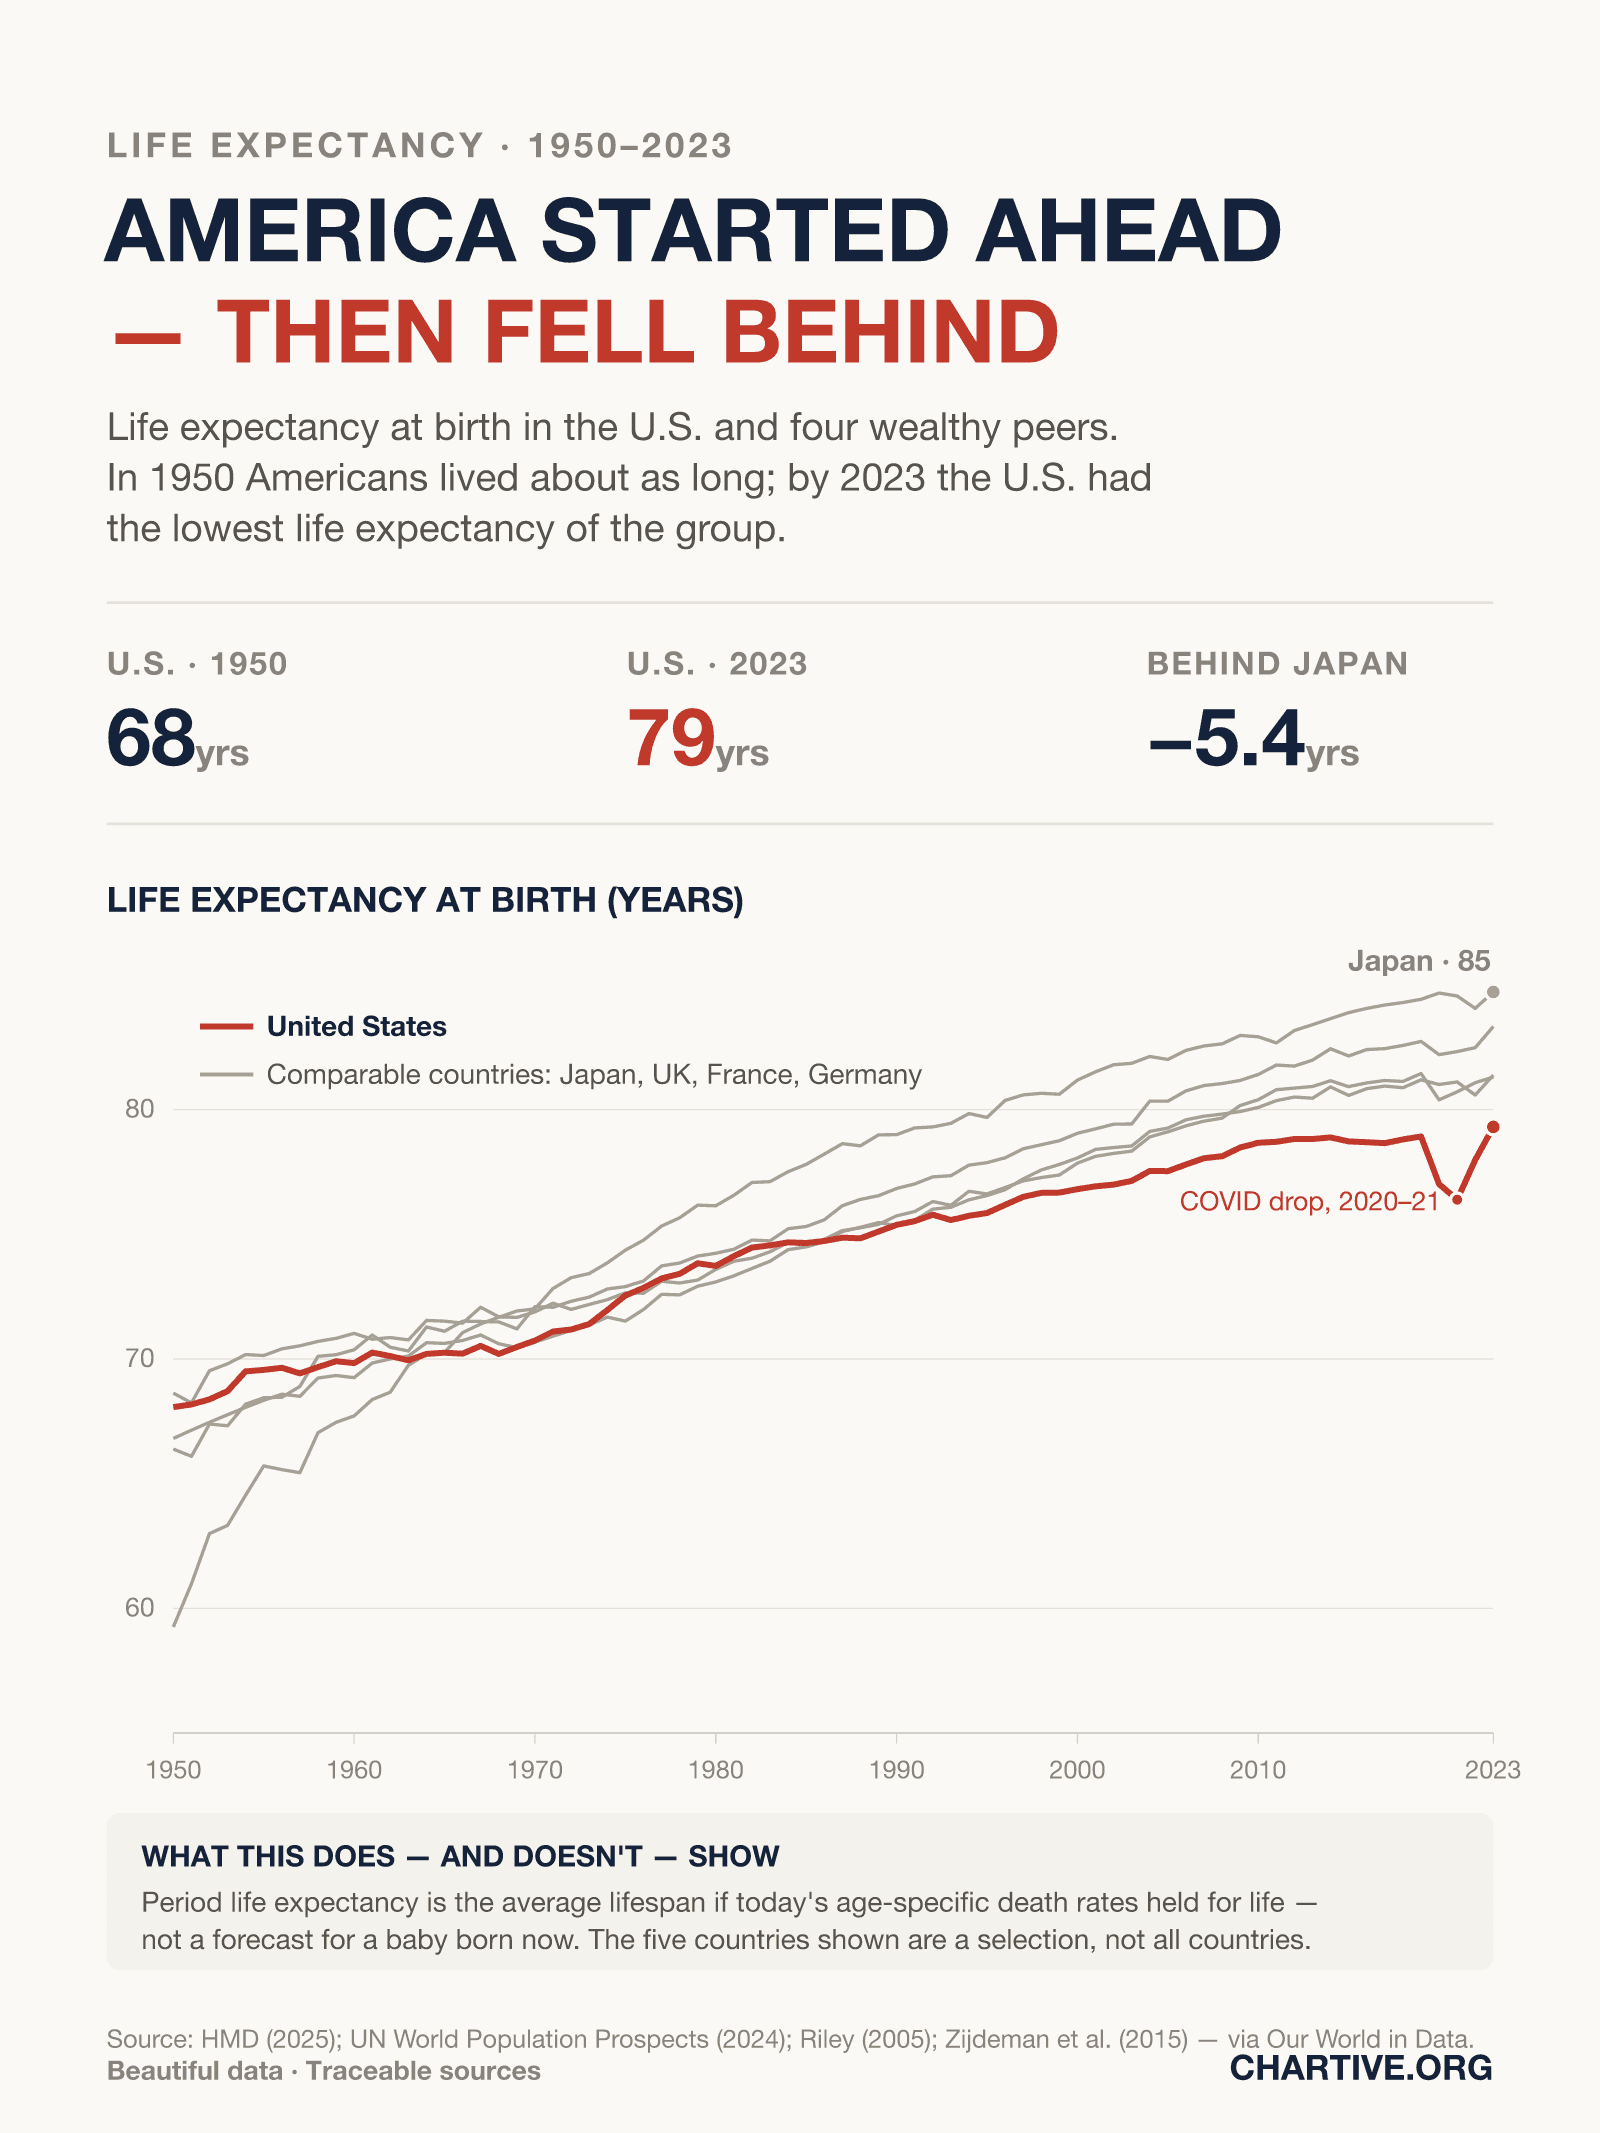
America started ahead on life expectancy — then fell behind
In 1950 the United States lived about as long as other wealthy countries. By 2023 it had the lowest life expectancy of the group — and lost the most ground during the pandemic.
Mara Ellison
Economy
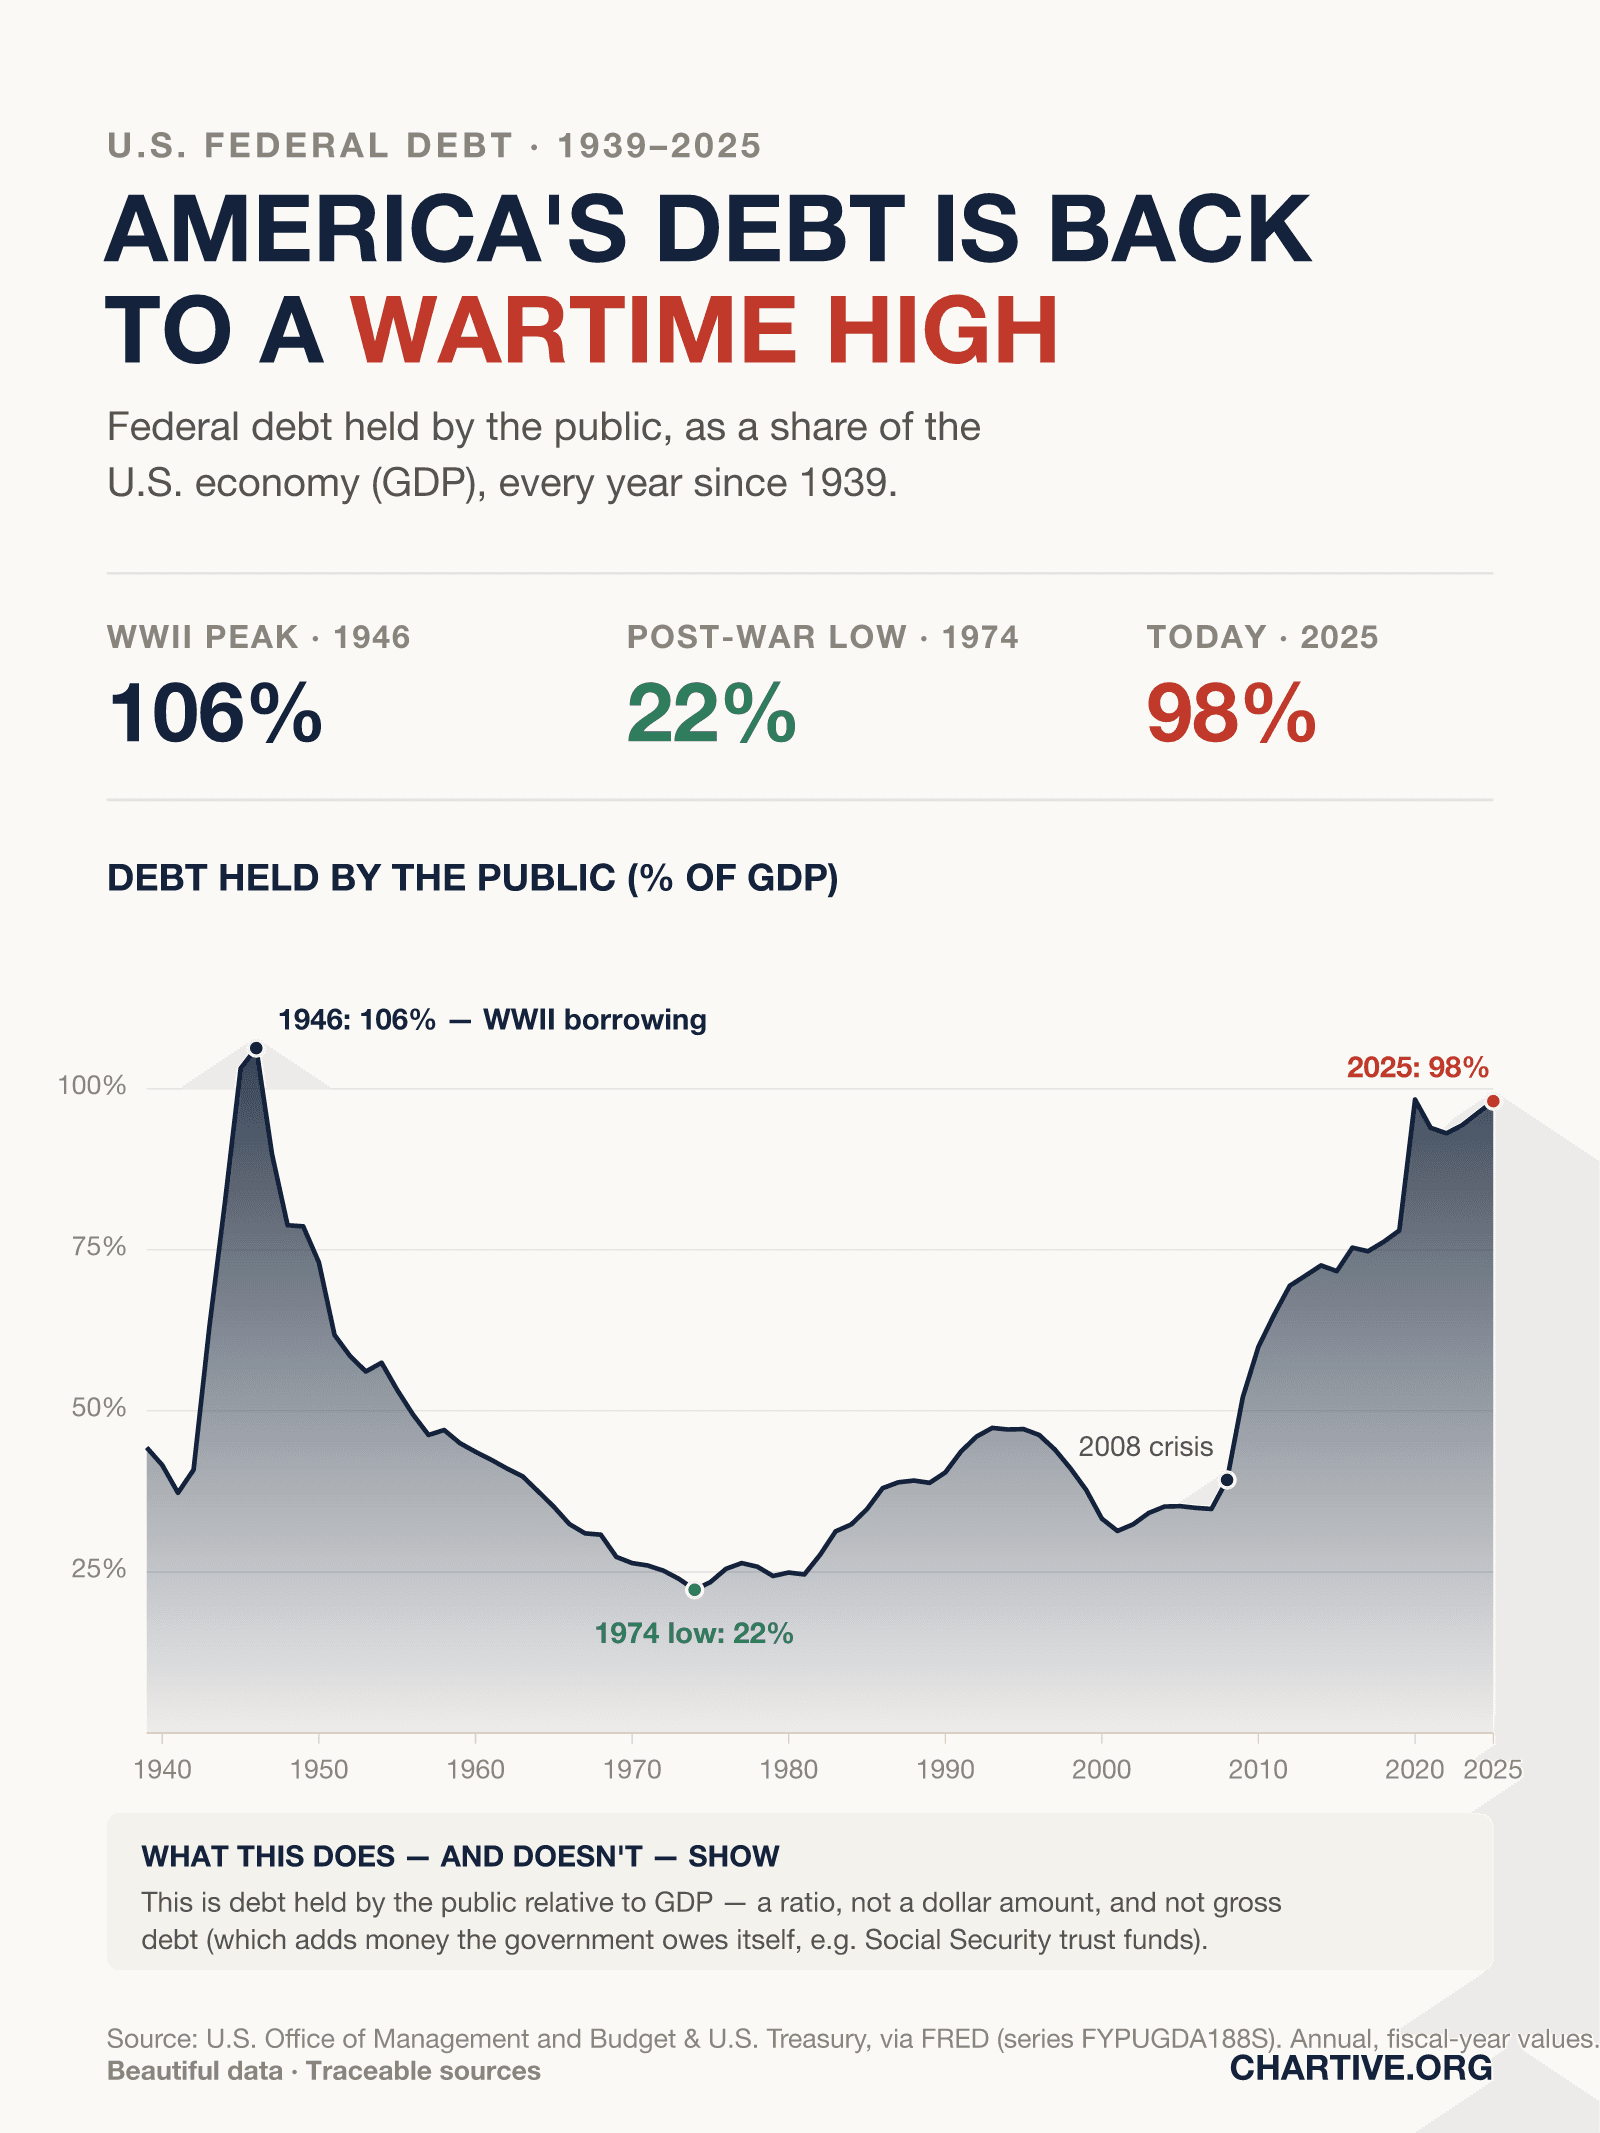
America's debt is back near its World War II peak
Federal debt held by the public reached about 98% of U.S. GDP in 2025 — close to the record 106% set in 1946, after falling as low as 22% in 1974.
Mara Ellison
Economy
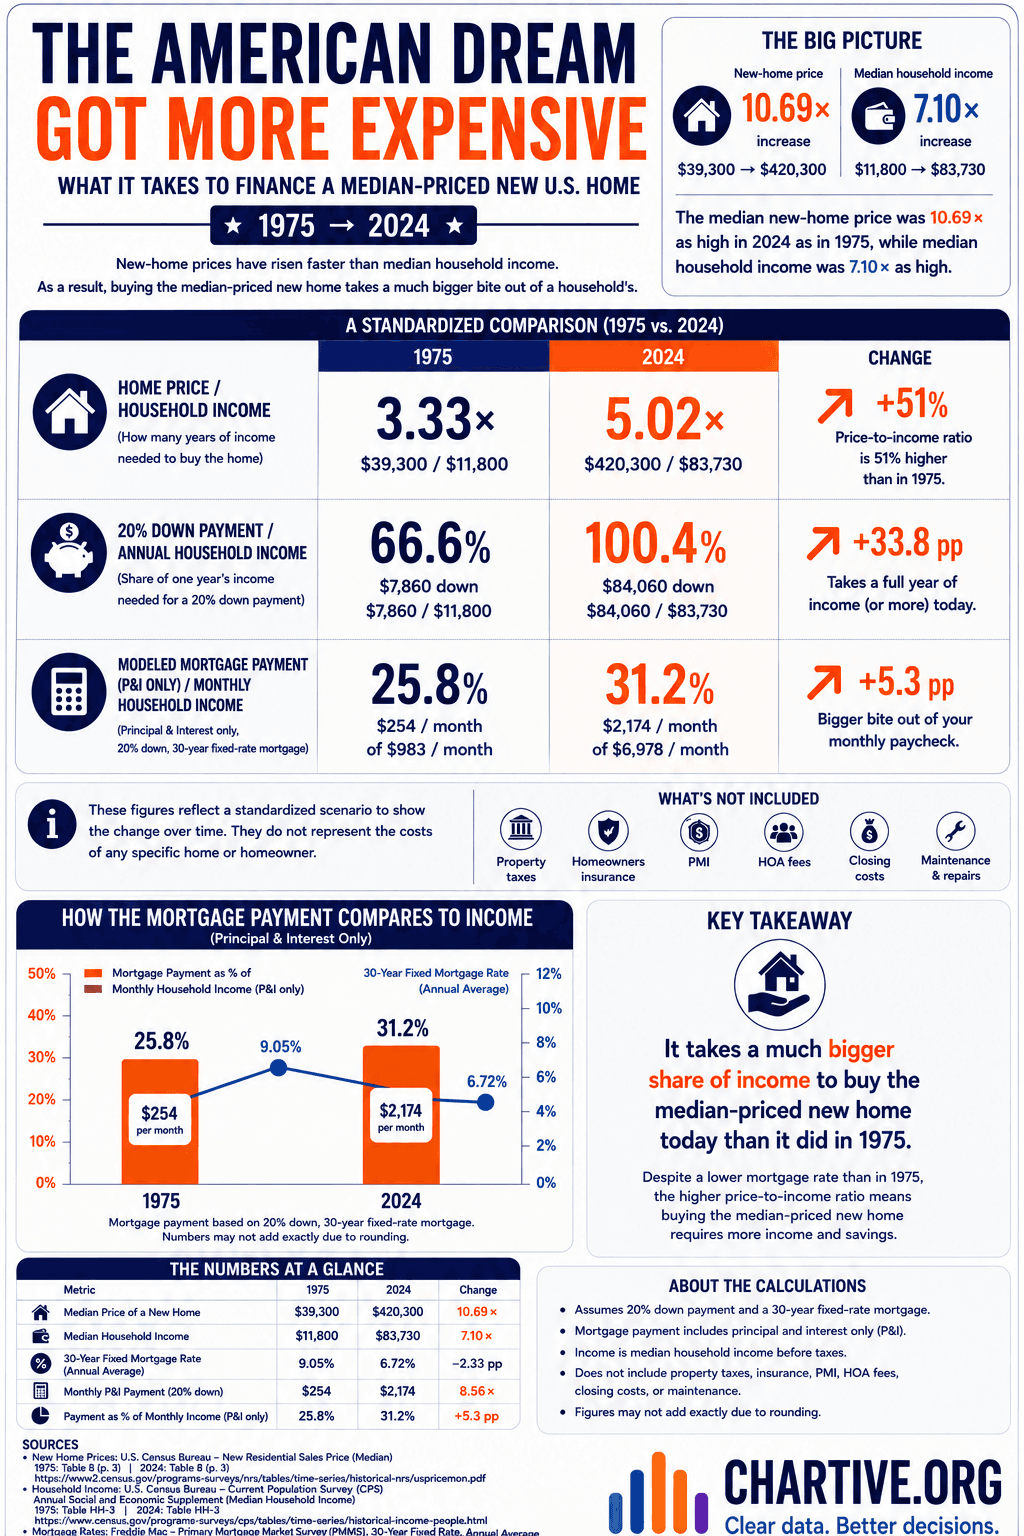
The American dream got more expensive
What it takes to finance a median-priced new U.S. home, 1975 vs. 2024.
Chartive Editorial
Demographics
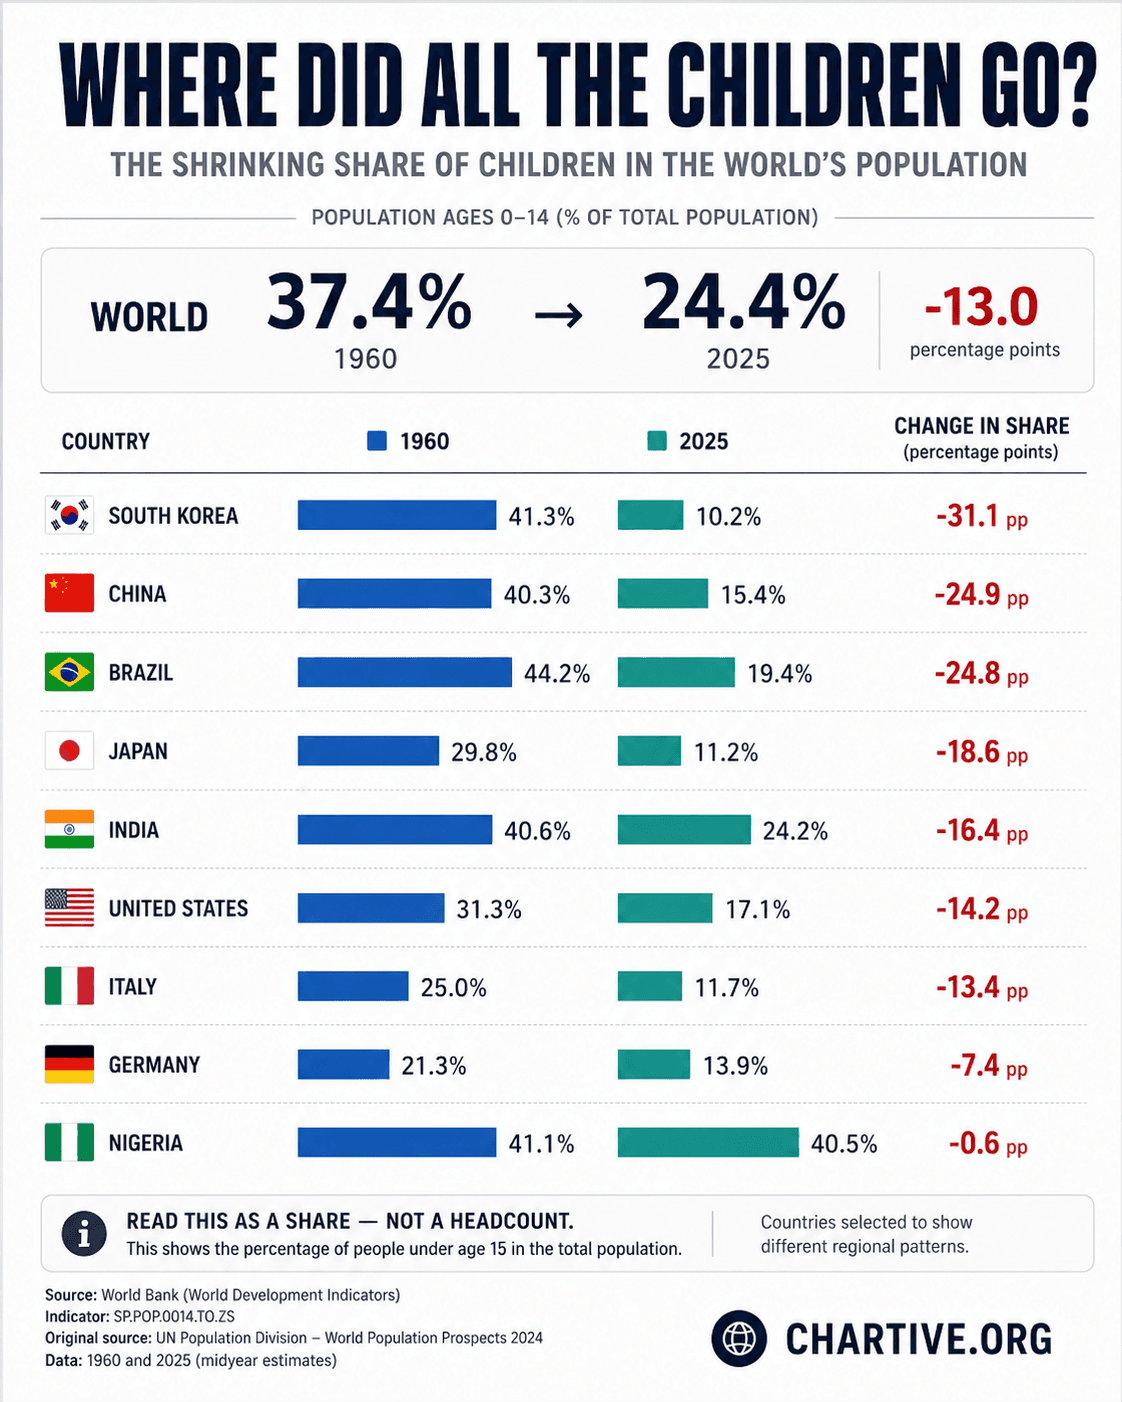
Where did all the children go?
Children made up 37.4% of the world in 1960. In 2025, they make up 24.4%. Population ages 0–14 as a share of total population, selected countries.
Chartive Editorial
Economy
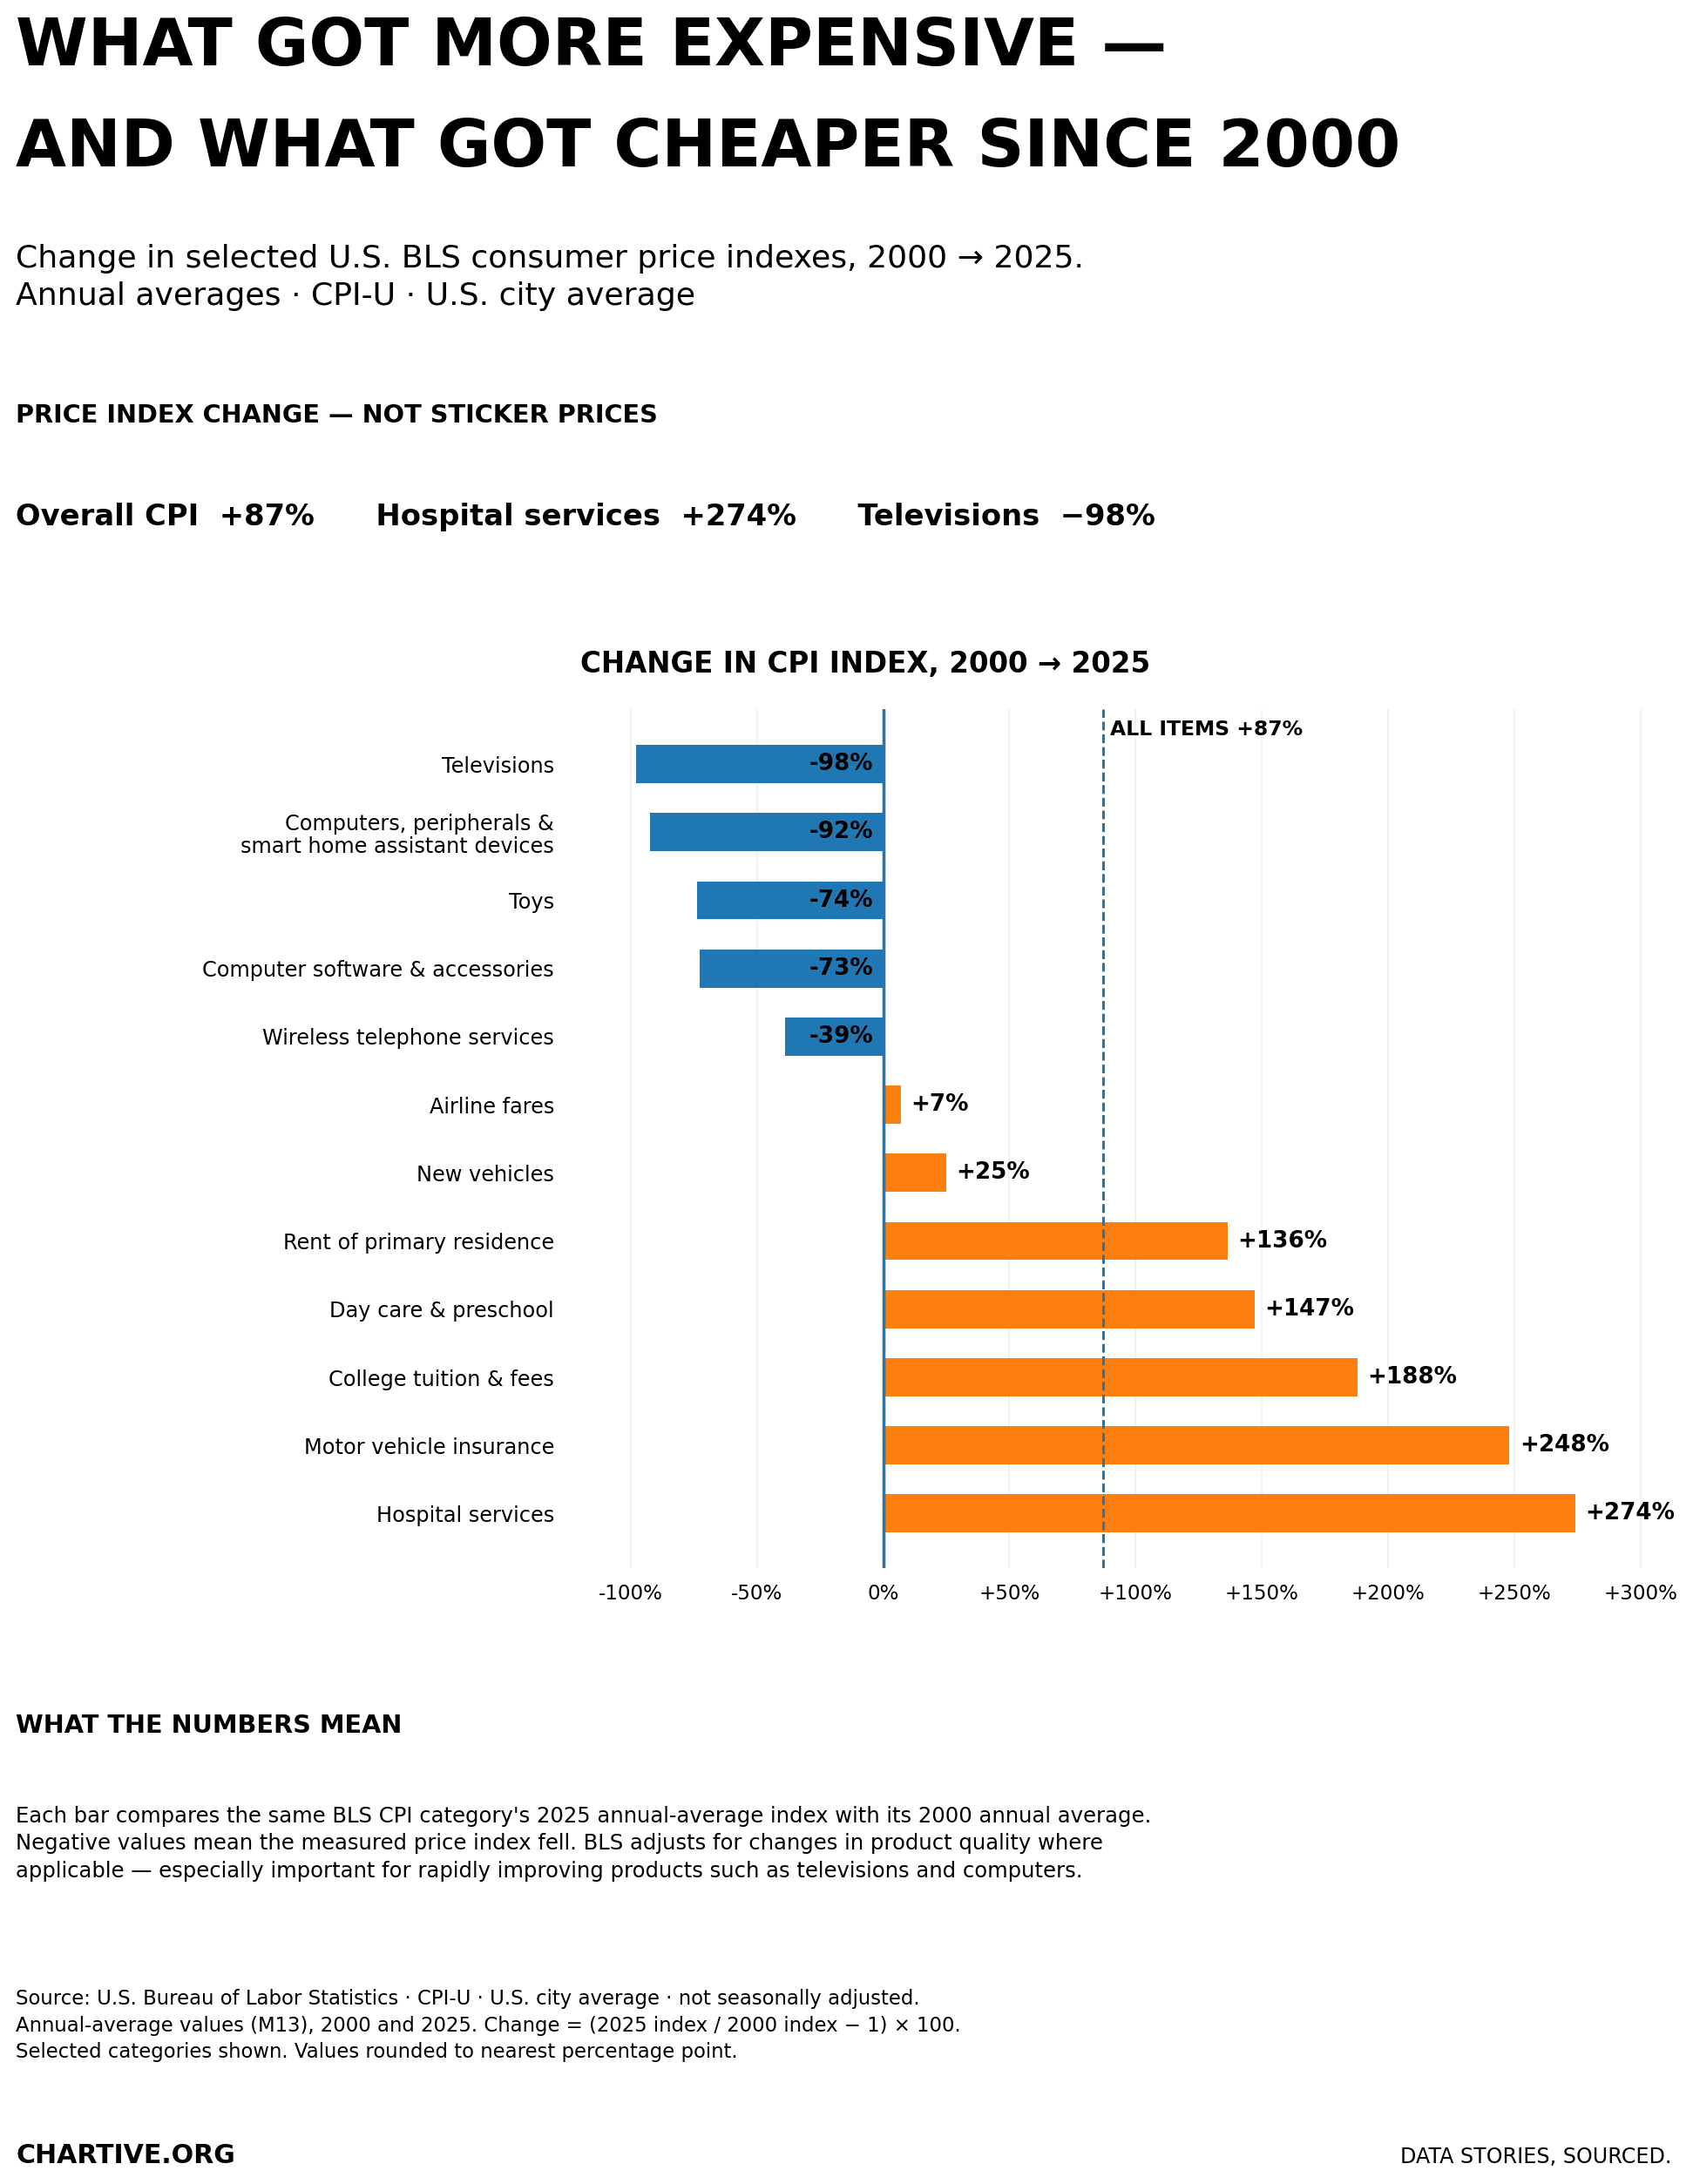
What got more expensive — and what got cheaper since 2000
Change in selected U.S. Consumer Price Index categories, using annual averages for 2000 and 2025.
Chartive Editorial
Economy
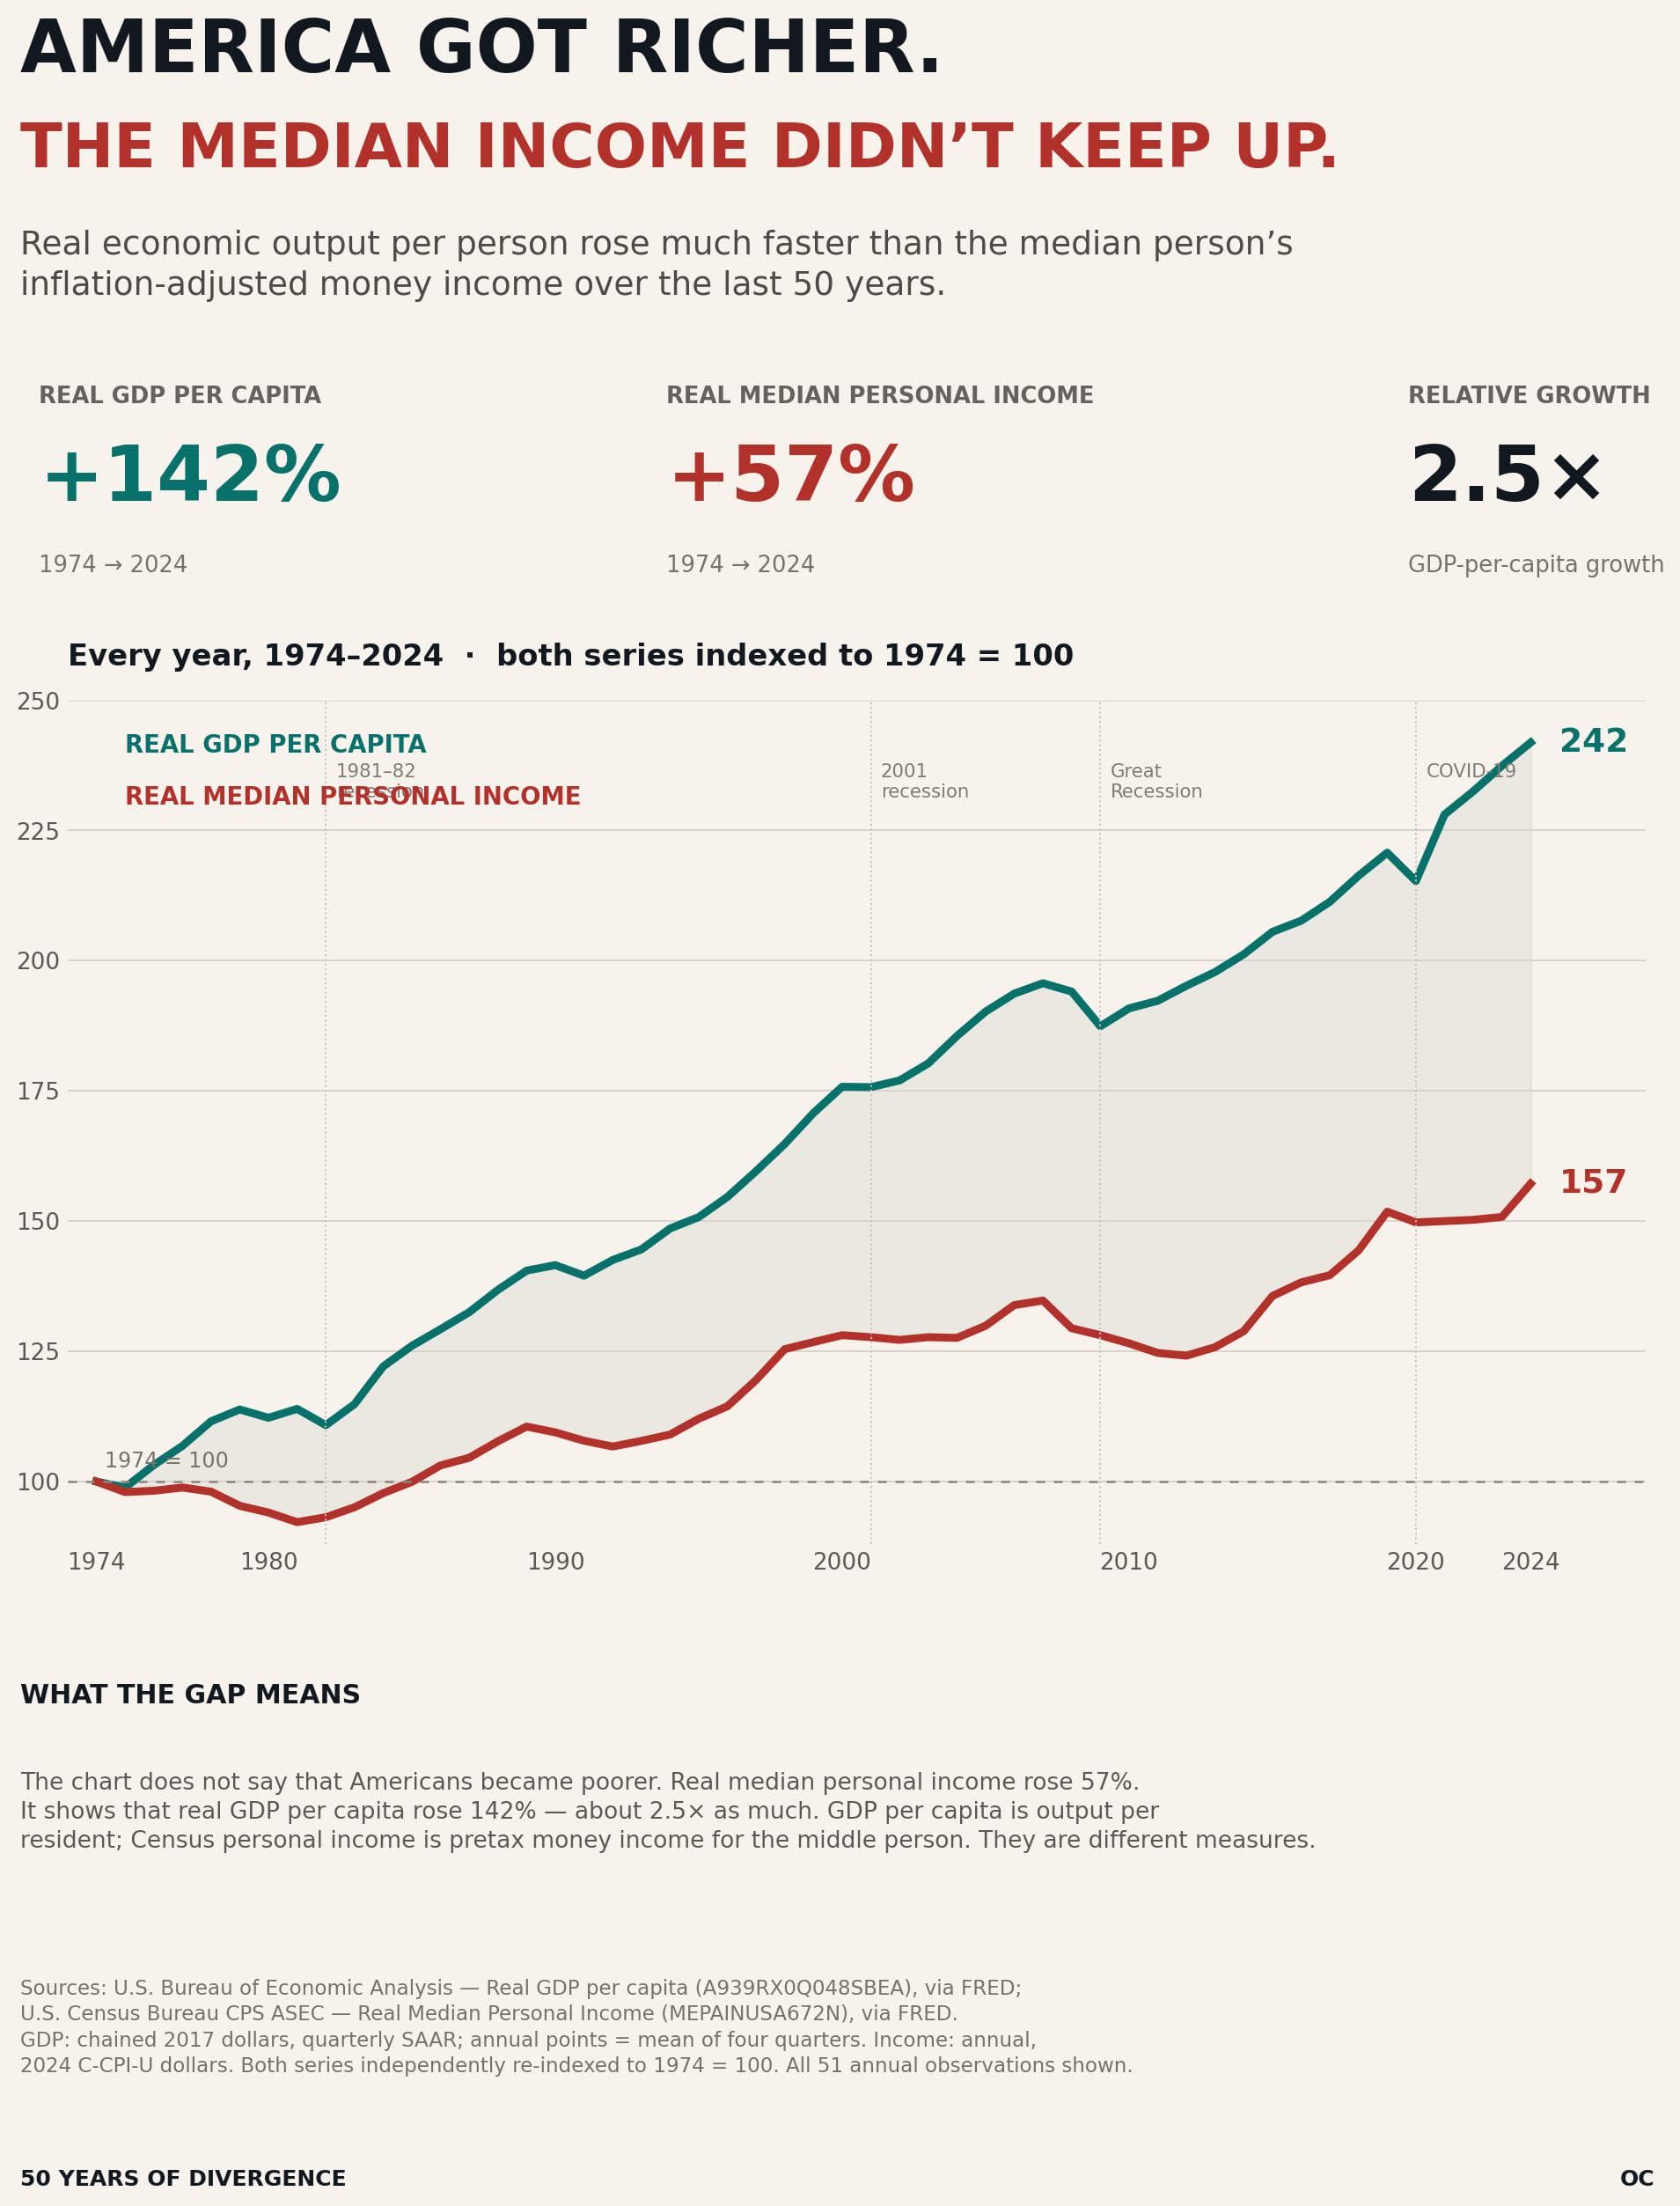
America got richer. The median income didn’t keep up.
Real economic output per person rose much faster than the median person’s inflation-adjusted money income over the last 50 years.
Chartive Editorial
Society
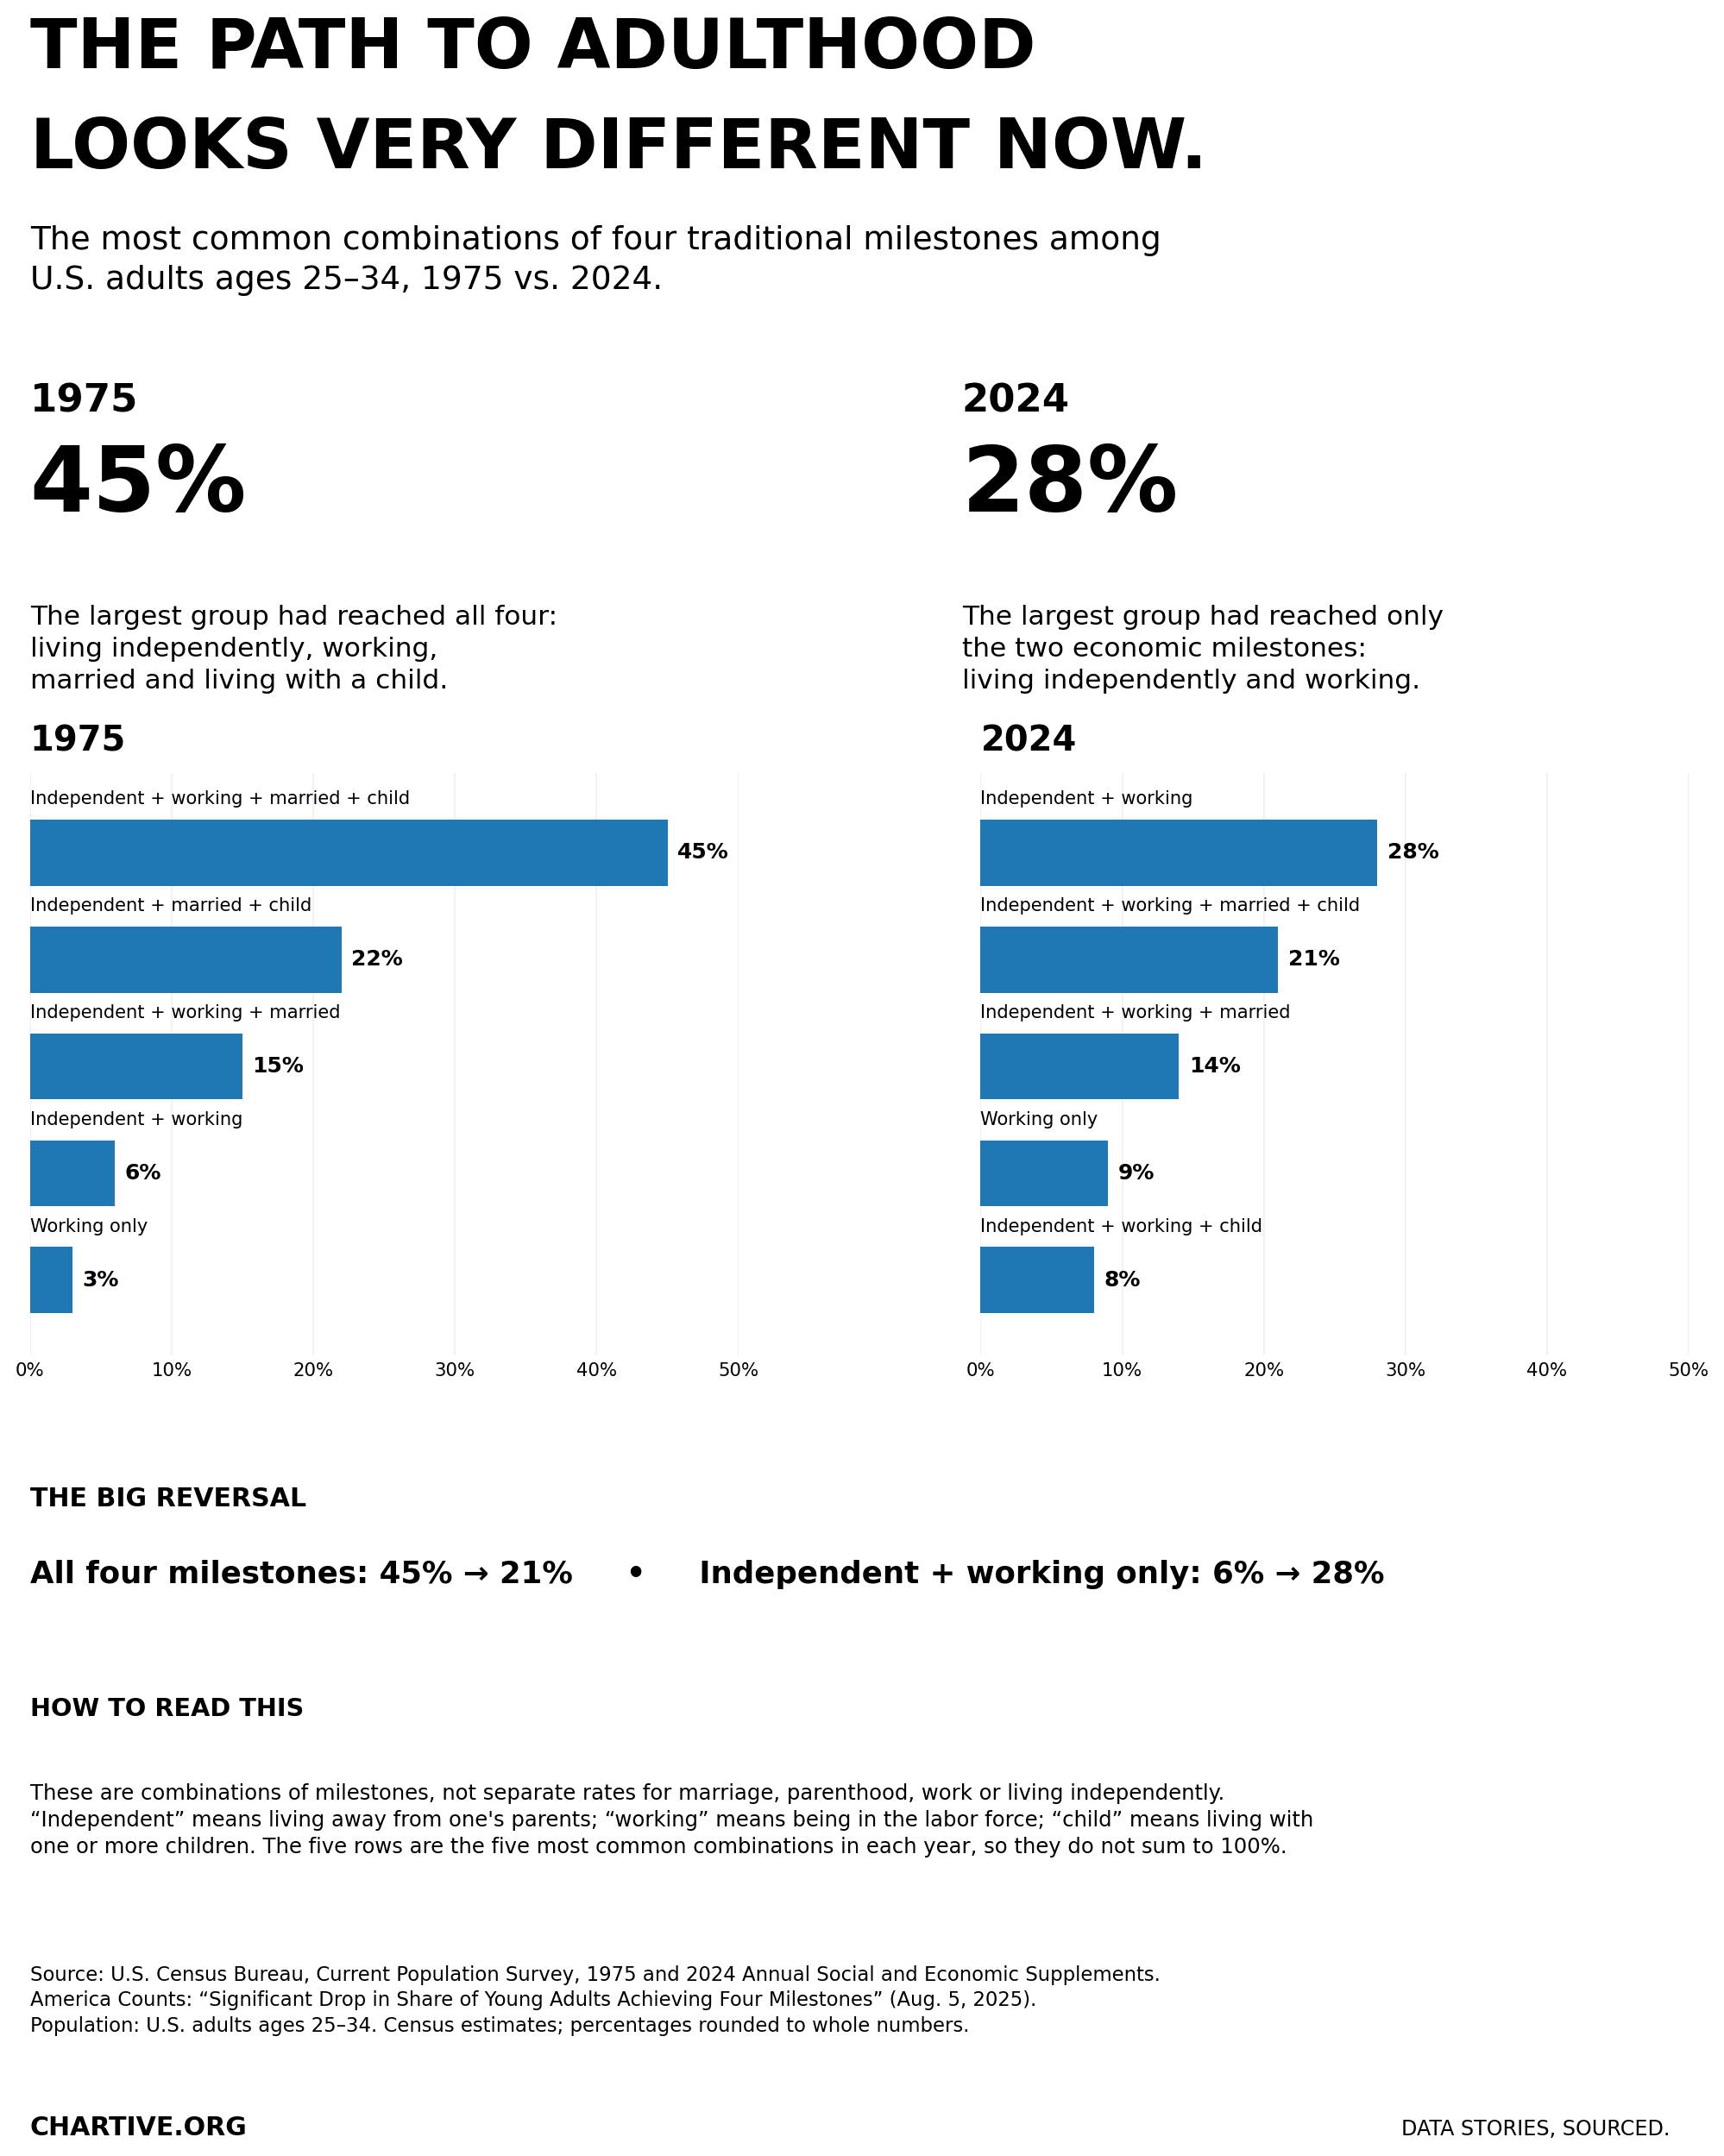
The path to adulthood looks very different now
The most common combinations of four traditional milestones among U.S. adults ages 25–34, 1975 vs. 2024.
Chartive Editorial
Economy
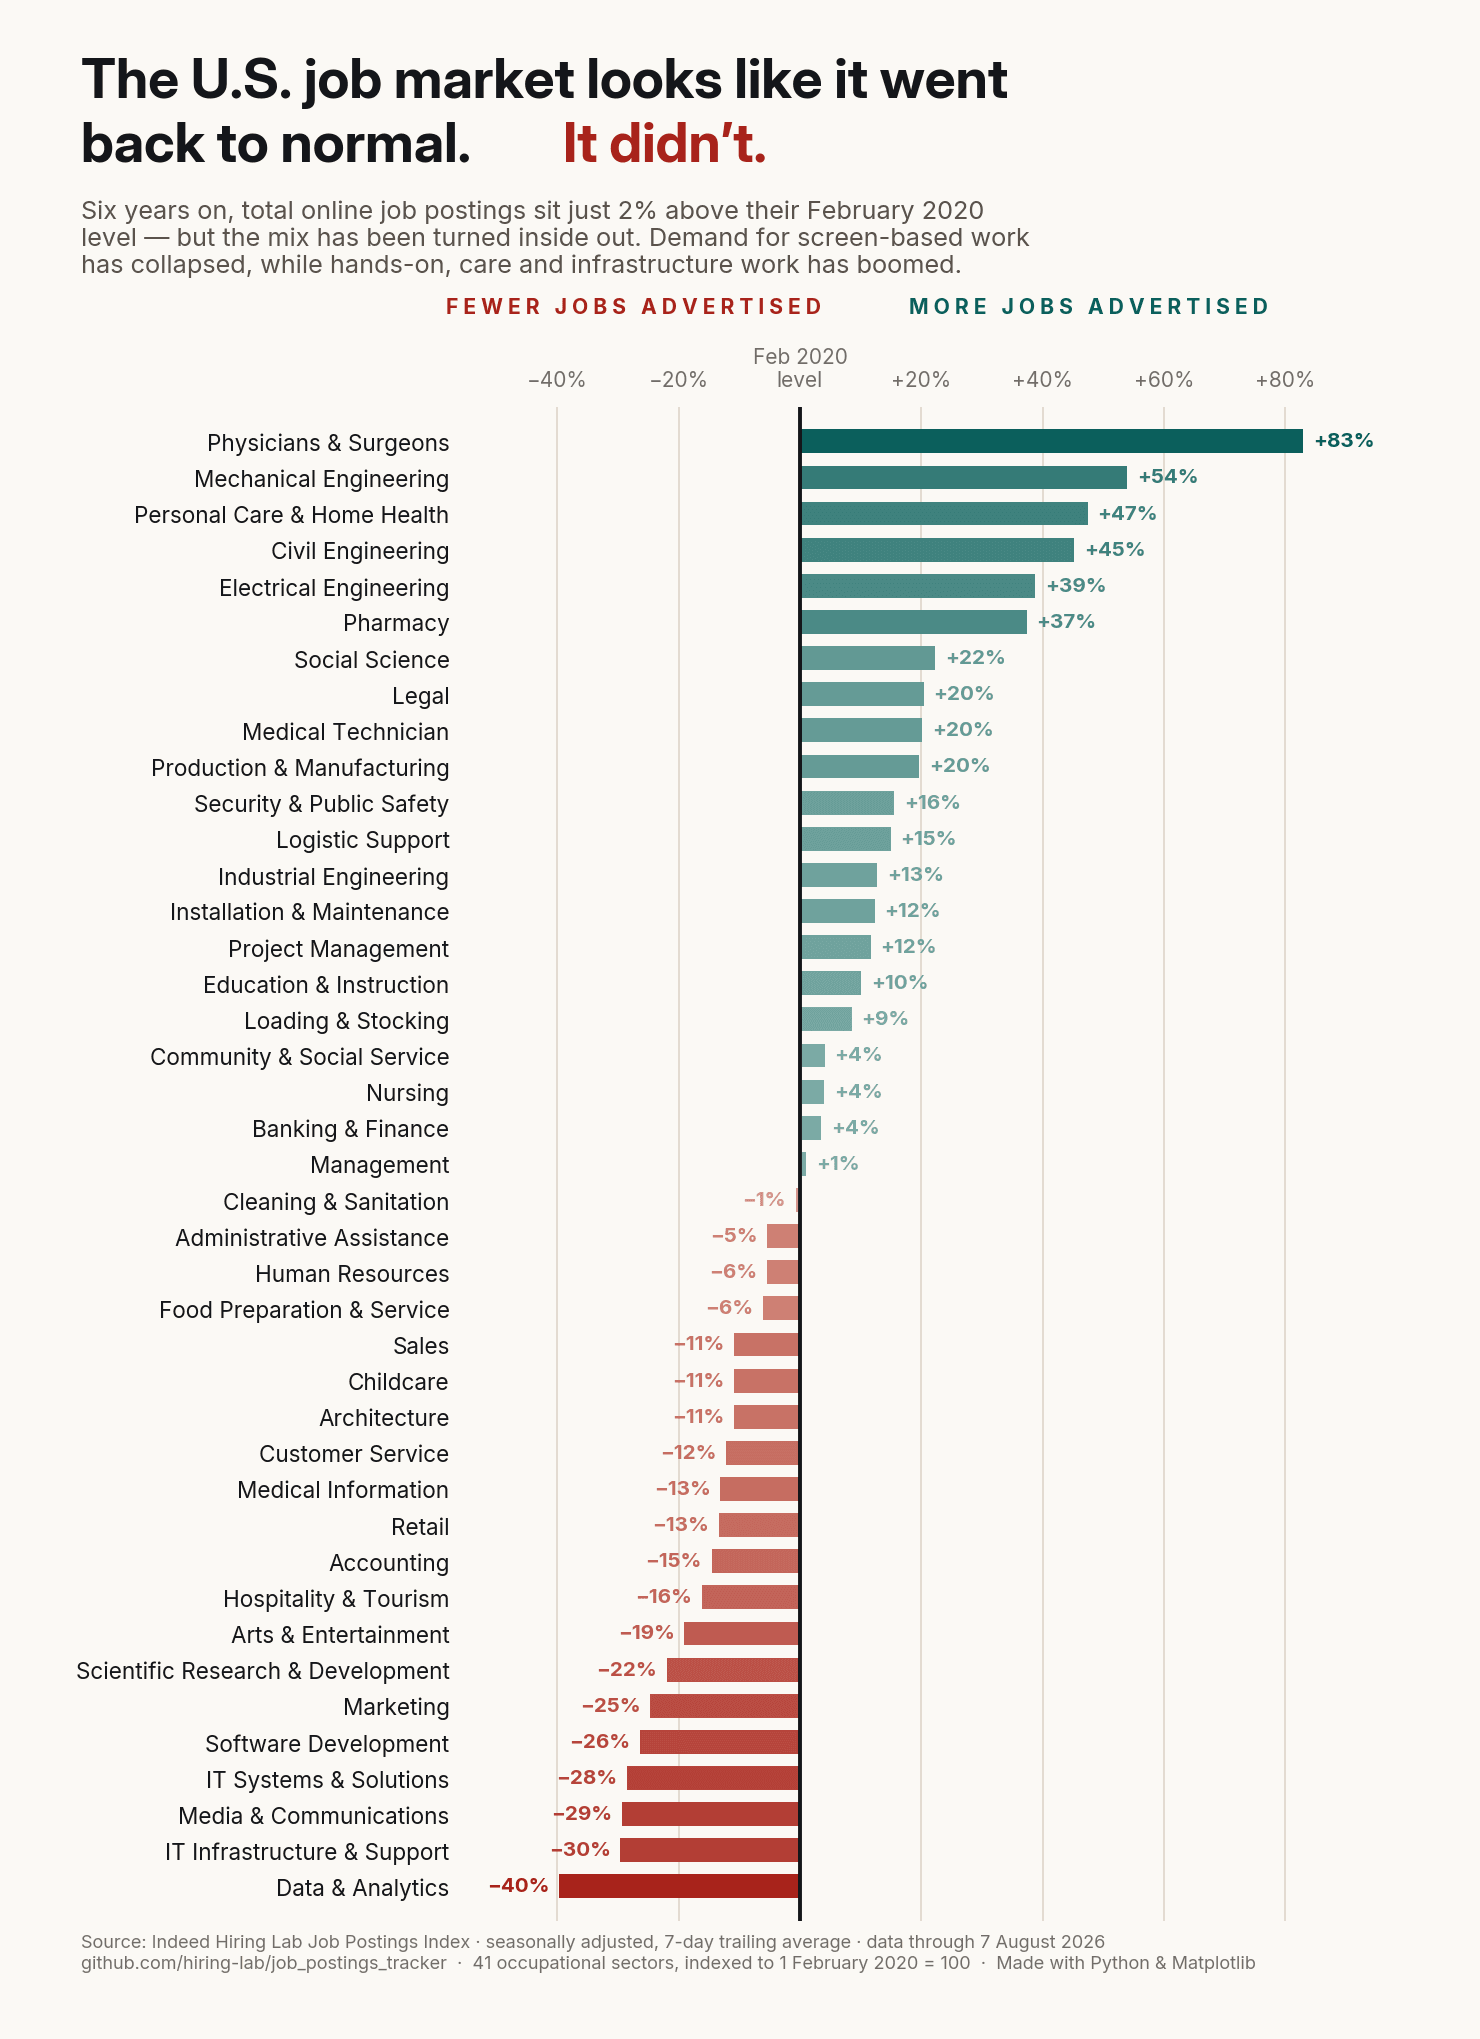
The U.S. job market looks like it went back to normal. It didn’t.
Six years on, total online job postings sit just 2% above their February 2020 level — but the mix has been turned inside out. Demand for screen-based work has collapsed, while hands-on, care and infrastructure work has boomed.
Chartive Editorial