Economy
Verified dataAt the same age, Boomers owned nearly twice as much of the country
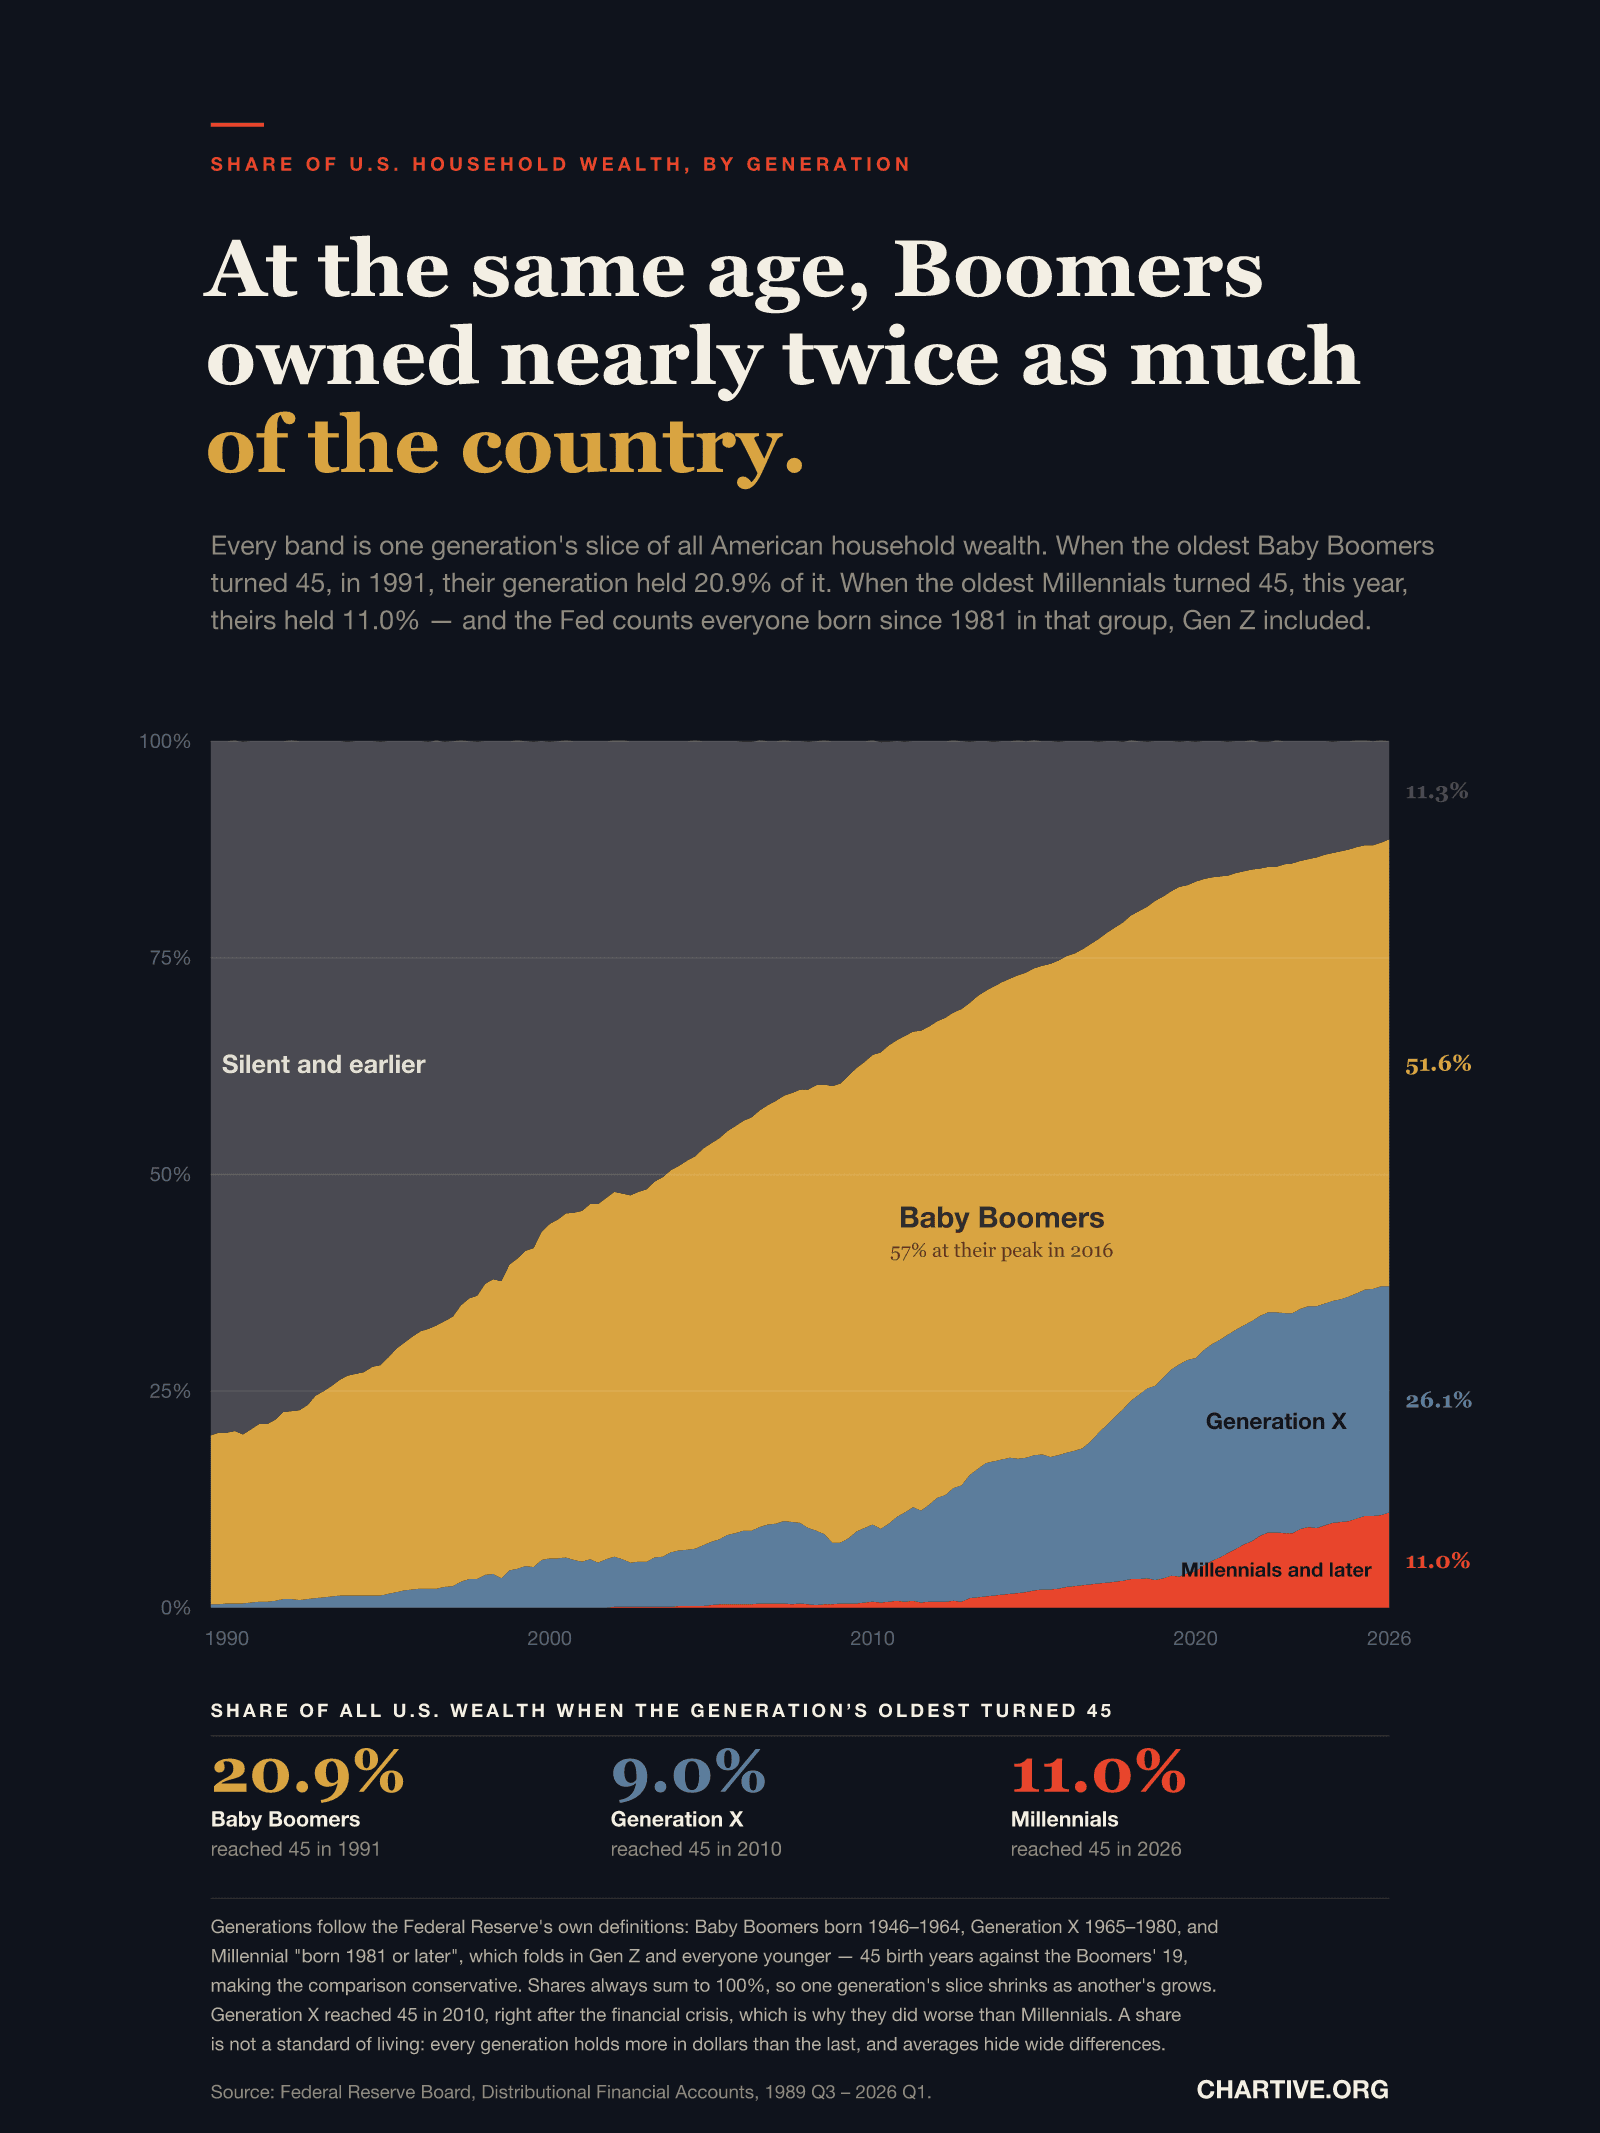
When the oldest Baby Boomers turned 45, in 1991, their generation held 20.9% of all US household wealth. When the oldest Millennials turned 45, in 2026, theirs held 11.0%.
CSV · 147 rows · 1989–2026
Measured at the same point in life, each generation has held a smaller slice of American household wealth than the one before. The Federal Reserve's Distributional Financial Accounts split every dollar of household net worth by the birth cohort that owns it. In 1991, the year the oldest Baby Boomers turned 45, Boomers held 20.9% of the national total. In 2010, when the oldest of Generation X turned 45, they held 9.0%. In 2026, with the oldest Millennials turning 45, the Millennial group holds 11.0% — and the Fed puts everyone born in 1981 or later into that group, Gen Z included. Boomers at 45 therefore held 1.9 times the share Millennials hold now, from a cohort spanning 19 birth years rather than 45.
Key findings
- Baby Boomers held 20.9% of all US household wealth in 1991, the year their oldest members turned 45.
- Millennials and later hold 11.0% in 2026, the year the oldest Millennials turn 45 — 1.9 times less than Boomers at the same age.
- Generation X held 9.0% when its oldest turned 45 in 2010, immediately after the financial crisis.
- The Fed's youngest category covers everyone born in 1981 or later, 45 birth years against the Boomers' 19.
- Baby Boomers peaked at 57.4% of national household wealth in 2016 and hold 51.6% in 2026.
- Boomers overtook the Silent generation and earlier cohorts in 2005 Q2, at 46.3% against 45.8%.
- The Silent generation and earlier fell from 80.1% in 1989 Q3 to 11.3% in 2026 Q1.
- Generation X reached 26.1% by 2026 Q1, its highest share so far.
Explore the data
Coverage: Jul 1, 1989 – Mar 31, 2026 · United States
Free to download and reuse. Get the data behind every new chart →
Sources
Primary source
Federal Reserve Board
Board of Governors of the Federal Reserve System
Distributional Financial Accounts (DFA)
Accessed Sep 12, 2026
Levels of wealth by generation, 1989 Q3 to 2026 Q1, downloaded from the DFA data archive at federalreserve.gov/releases/z1/dataviz/download/zips/dfa.zip. Shares are computed as each generation's net worth divided by the quarterly total across all generations.
Methodology
The chart is a 100% stacked area: each band is one generation's share of total US household net worth, and the four bands always sum to 100%. Data are the Federal Reserve Board's Distributional Financial Accounts, which distribute the aggregate household balance sheet from the Financial Accounts of the United States across cohorts using the Survey of Consumer Finances. The series runs quarterly from 1989 Q3 to 2026 Q1, 147 quarters in all. The same-age comparison beneath the chart takes each generation's oldest birth year (1946, 1965 and 1981), adds 45, and reads that calendar year's average of the four quarters: 1991 for Boomers, 2010 for Generation X, 2026 for Millennials. Because the vertical axis is a share, it runs a true 0 to 100% with nothing truncated.
What this does not show
A share is not a standard of living. Total household wealth has grown, so a smaller slice of a larger pie need not mean fewer dollars, and this chart does not show dollar amounts. The Fed's youngest category is "born 1981 or later", which folds Gen Z and everyone younger into the Millennial band — 45 birth years against the Boomers' 19 — so the comparison understates rather than overstates the gap. Shares are zero-sum by construction: one generation's slice can only shrink as another's grows, and the number of living households in each cohort changes over time. Generation X reached 45 in 2010, immediately after the financial crisis, which is why they score below Millennials at the same age. Cohort averages hide very wide differences within each generation. The 2026 Q1 figure is the latest published and may be revised.
Creator
Reuse this visualization
Cite this
License: CC BY 4.0
Embed code
<figure style="margin:0;max-width:1600px">
  <a href="https://chartive.org/visualizations/us-wealth-share-by-generation-1989-2026" target="_blank" rel="noopener">
    <img src="https://chartive.org/infographics/us-wealth-share-by-generation-1989-2026.png" alt="A 100% stacked area chart of the share of United States household wealth held by each generation, quarterly from 1989 to 2026. In 1989 the Silent generation and earlier hold about 80% and shrink steadily to 11.3% by 2026. Baby Boomers rise from 19.5% to a peak of about 57% in 2016 and stand at 51.6% in 2026. Generation X grows from almost nothing to 26.1%. Millennials and later appear after 2002 and reach 11.0%. Beneath the chart, three figures compare each generation's share when its oldest members turned 45: Baby Boomers 20.9% in 1991, Generation X 9.0% in 2010, Millennials 11.0% in 2026." width="1600" height="2133" style="max-width:100%;height:auto" />
  </a>
  <figcaption style="font:14px/1.4 system-ui,sans-serif;color:#57534e;margin-top:8px">
    Graphic by Chartive Editorial, using data from Federal Reserve Board — via <a href="https://chartive.org/visualizations/us-wealth-share-by-generation-1989-2026" target="_blank" rel="noopener">Chartive</a>
  </figcaption>
</figure>
Reuse is welcome — the embed keeps a link back to the source.