Economy
Verified dataAmerica's share of the world economy has shrunk. So has Japan's — all the way back.
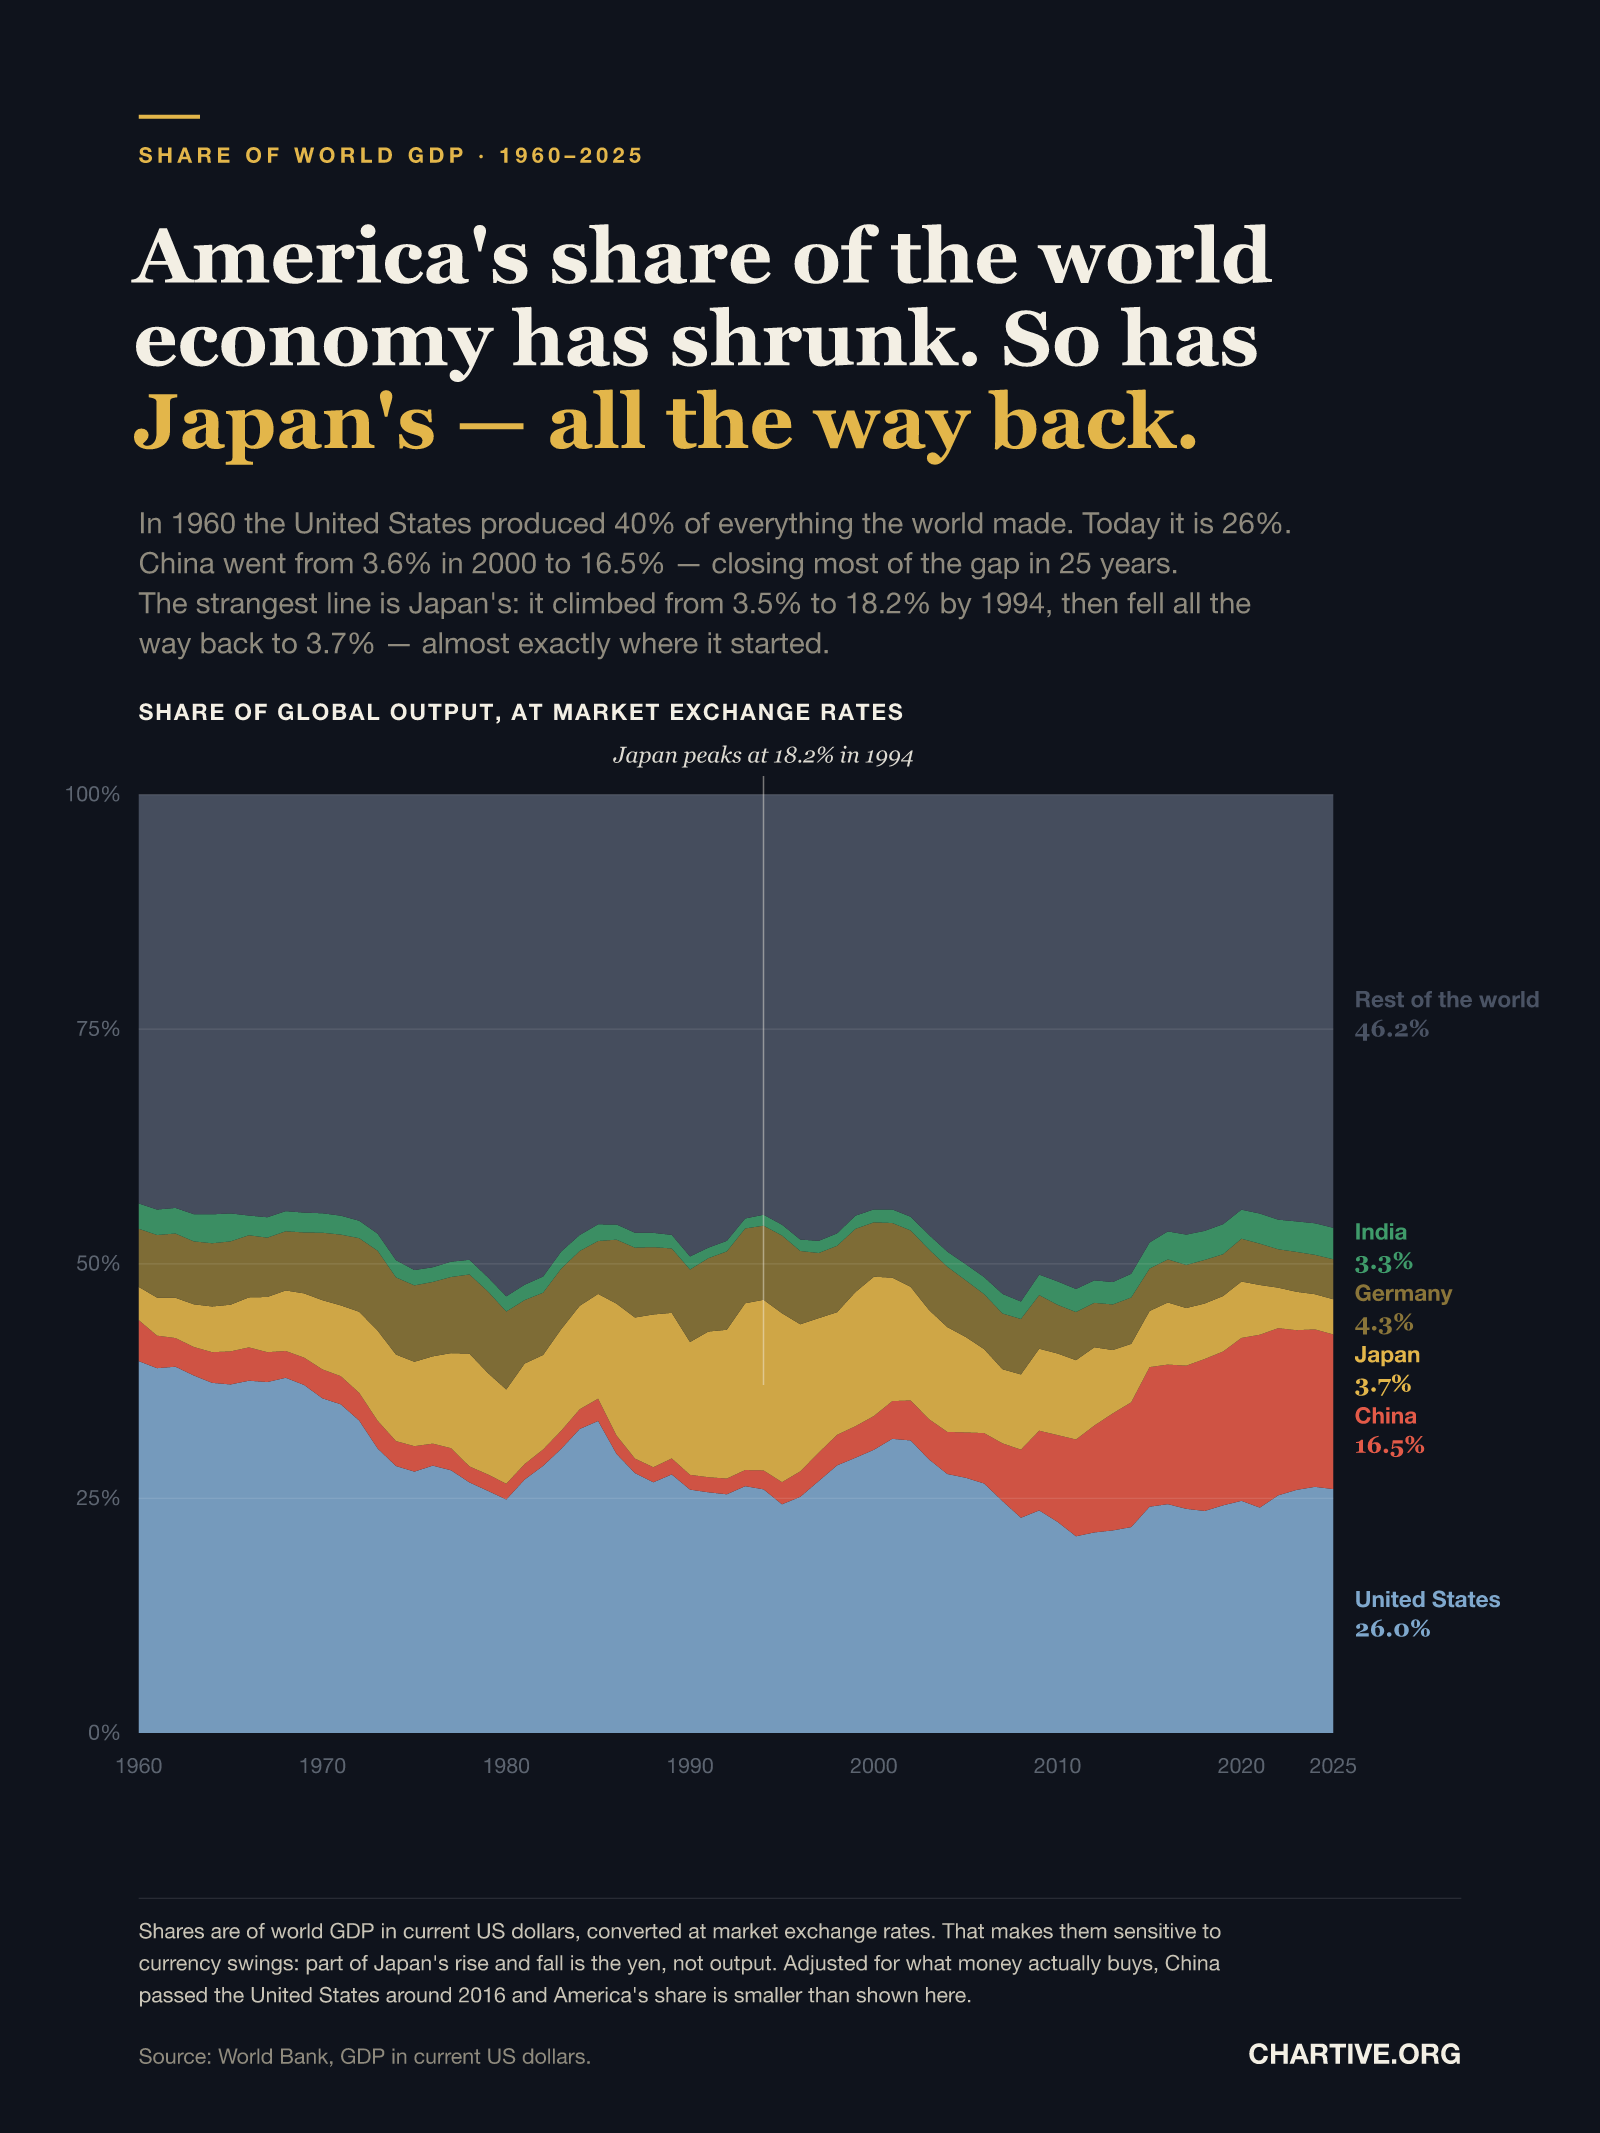
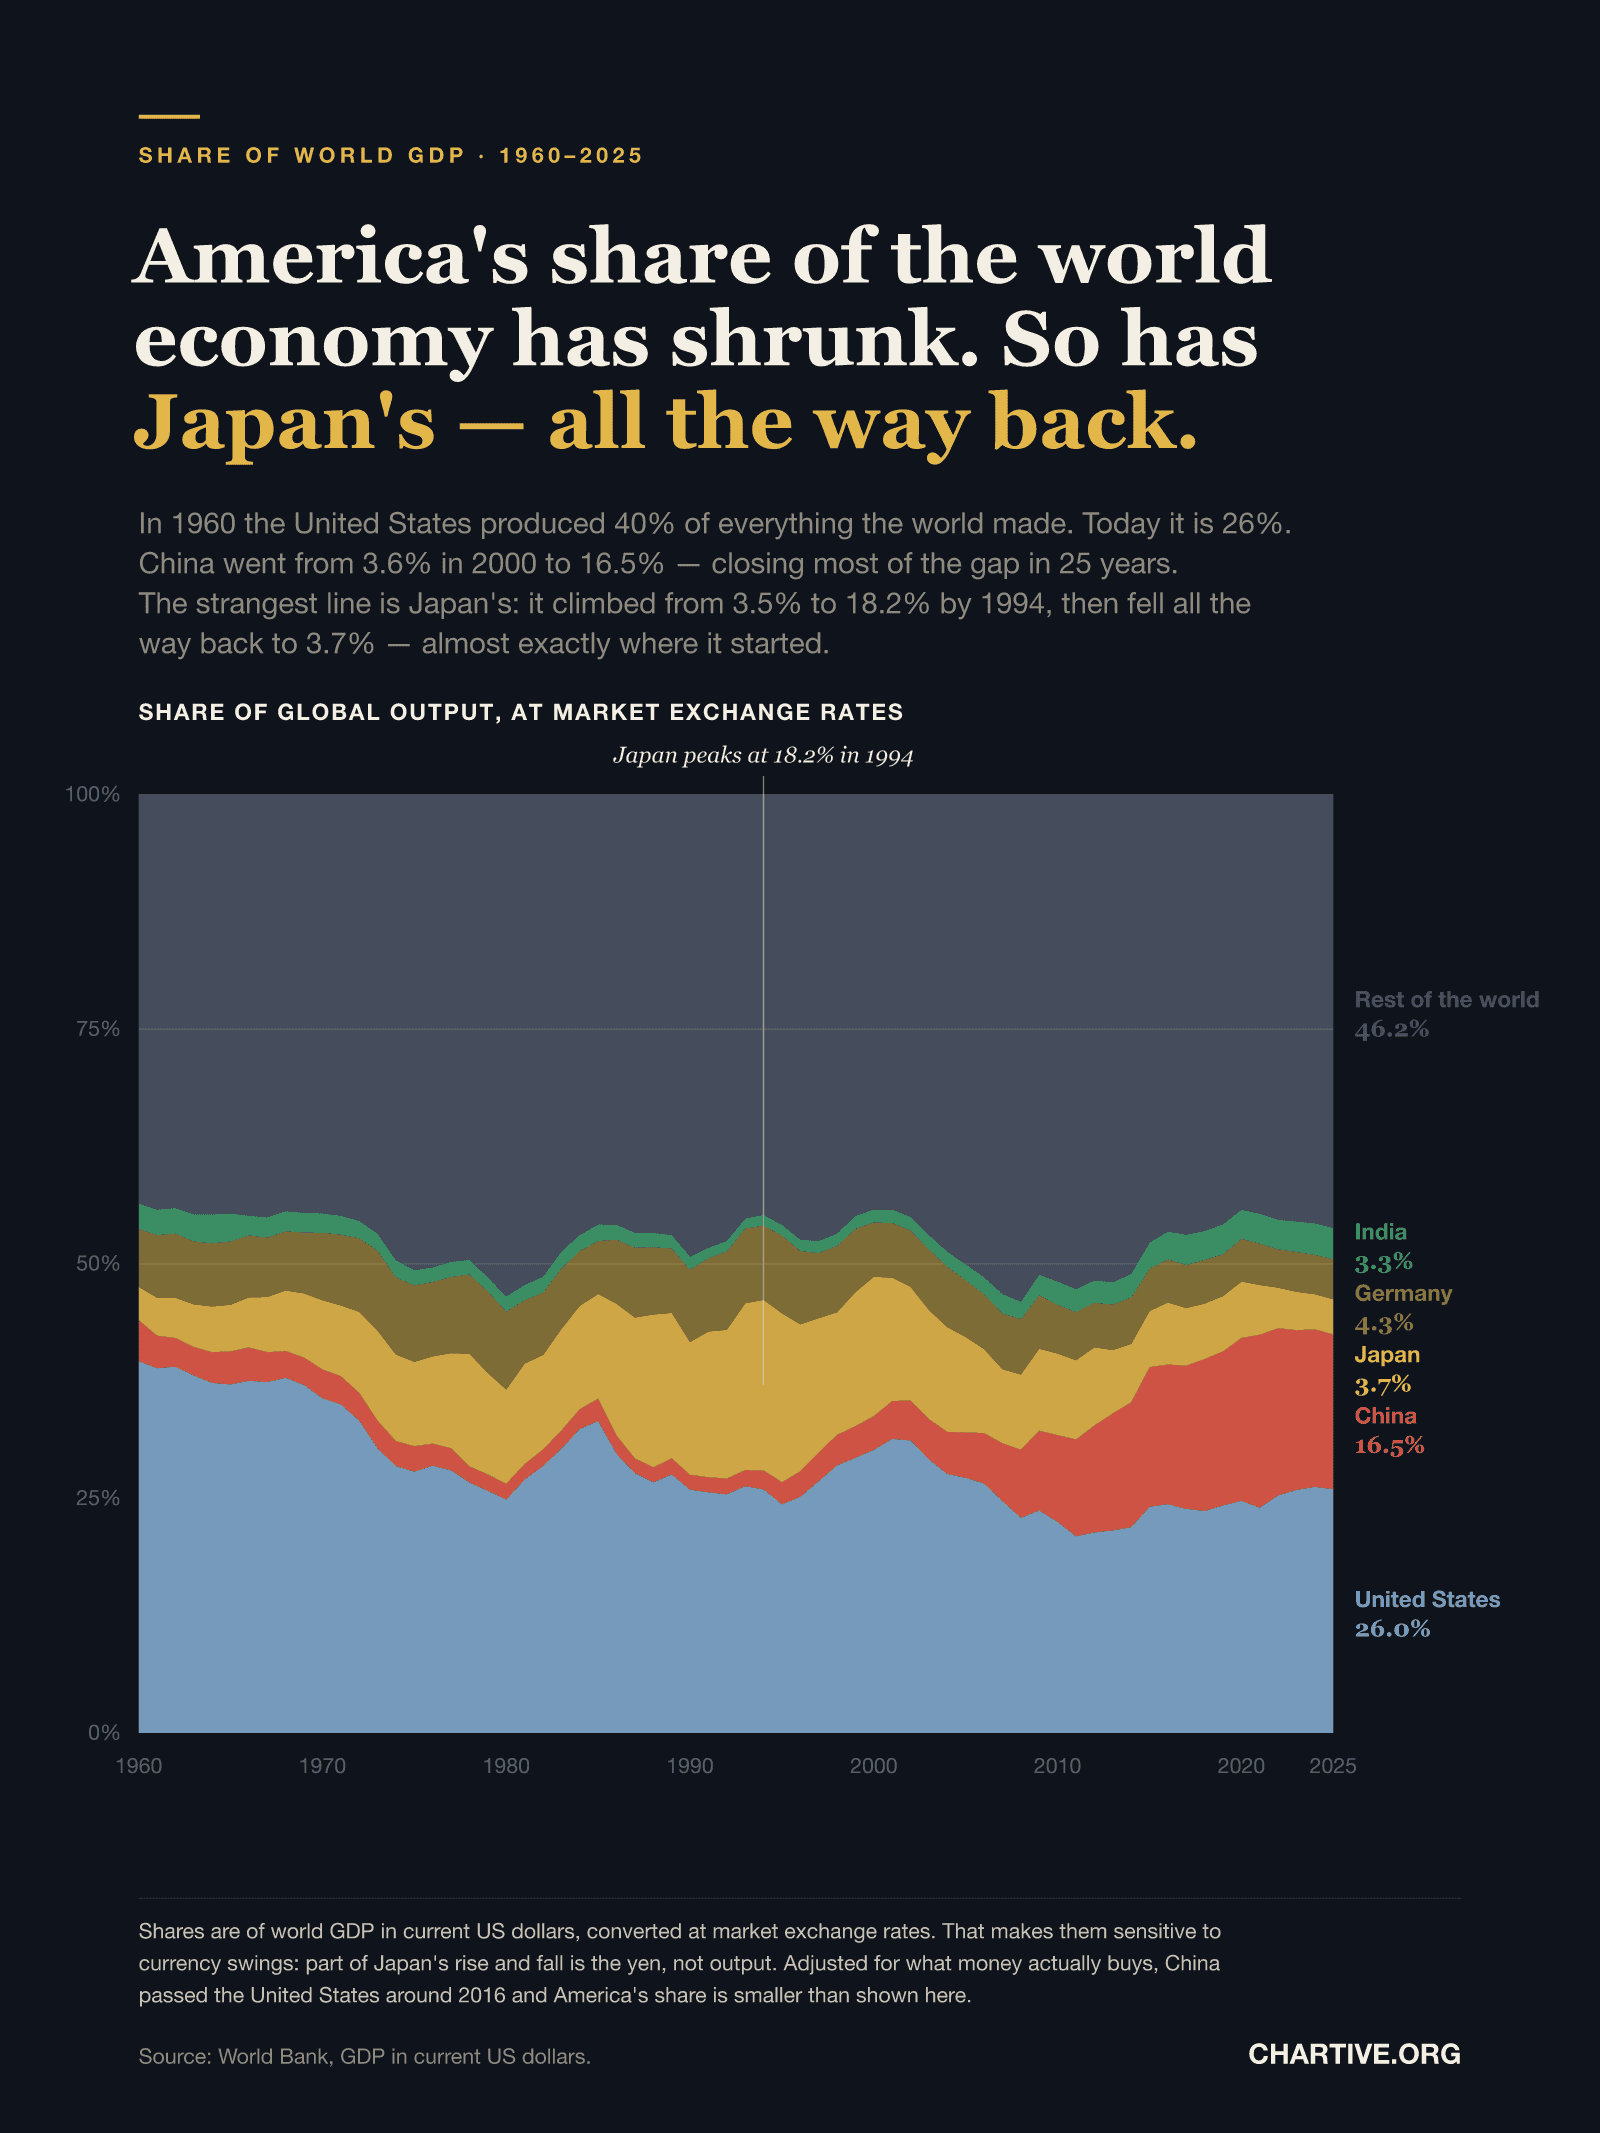
In 1960 the United States produced 40% of everything the world made; today it is 26%. China went from 3.6% in 2000 to 16.5%. Japan climbed to 18.2% by 1994 and then fell back to 3.7% — almost exactly where it started.
CSV · 66 rows · 1960–2025
Measured at market exchange rates, the United States' share of world output has fallen from 39.6% in 1960 to 26.0% in 2025, while China's rose from 3.6% in 2000 to 16.5% — narrowing the gap between them from more than eight to one down to about 1.6 to one. The most unusual path is Japan's: it grew from 3.5% of world output in 1960 to a peak of 18.2% in 1994, then declined for three decades to 3.7%, returning to almost exactly its starting share.
Key findings
- The United States' share of world output fell from 39.6% in 1960 to 26.0% in 2025.
- China's share rose from 3.6% in 2000 to 16.5% in 2025 — a factor of 4.6 in 25 years.
- The gap between them narrowed from more than eight to one in 2000 to about 1.6 to one today.
- Japan peaked at 18.2% of world output in 1994 and has fallen back to 3.7% — its 1960 level was 3.5%.
- Germany's share slipped from 6.2% in 1960 to 4.3%, and India's is 3.3%.
- The five named countries together account for about 54% of world output; everywhere else makes up the rest.
Explore the data
Coverage: Jan 1, 1960 – Dec 31, 2025 · World
Free to download and reuse. Get the data behind every new chart →
Sources
Primary source
World Development Indicators
World Bank
GDP (current US$) — NY.GDP.MKTP.CD
Accessed Aug 30, 2026
Country GDP and world GDP in current US dollars at market exchange rates, retrieved via the World Bank API. Shares computed as country GDP divided by world GDP.
Methodology
Each band is a country's gross domestic product divided by world GDP, both in current US dollars at market exchange rates, from the World Bank series NY.GDP.MKTP.CD. The 'rest of the world' band is the remainder, calculated as 100% minus the five named countries; it is positive in every year of the series, so the stack is valid throughout. Because all quantities are shares of the same total, the six bands sum to exactly 100% in every year. Where the right-hand labels for the thinner bands would overlap, they are spaced apart while keeping their order.
What this does not show
Market exchange rates make these shares sensitive to currency movements as well as to real output. A substantial part of Japan's rise and fall reflects the yen: the currency roughly doubled against the dollar between 1985 and 1995 and has since fallen back, which moves Japan's measured share without any change in what Japan produces. Adjusted for purchasing power instead — what money actually buys locally — China passed the United States around 2016 and America's share is smaller than shown here. Shares are relative: a falling share does not mean a shrinking economy, and every country in this chart produces far more in absolute terms than it did in 1960.
Creator
Reuse this visualization
Cite this
License: CC BY 4.0
Embed code
<figure style="margin:0;max-width:1600px">
  <a href="https://chartive.org/visualizations/world-gdp-shares-1960-2025" target="_blank" rel="noopener">
    <img src="https://chartive.org/infographics/world-gdp-shares-1960-2025.png" alt="Stacked area chart of shares of world GDP from 1960 to 2025, summing to 100%. The United States band at the bottom narrows from 39.6% to 26.0%. The China band above it is thin until about 2000, then widens sharply to 16.5%. The Japan band swells through the 1980s to a peak of 18.2% in 1994, marked by a vertical line, then narrows steadily to 3.7%. Germany falls from 6.2% to 4.3% and India ends at 3.3%. The rest of the world occupies the top 46.2%." width="1600" height="2133" style="max-width:100%;height:auto" />
  </a>
  <figcaption style="font:14px/1.4 system-ui,sans-serif;color:#57534e;margin-top:8px">
    Graphic by Chartive Editorial, using data from World Development Indicators — via <a href="https://chartive.org/visualizations/world-gdp-shares-1960-2025" target="_blank" rel="noopener">Chartive</a>
  </figcaption>
</figure>
Reuse is welcome — the embed keeps a link back to the source.