Health
Verified dataAmerica spends the most on health — and lives less
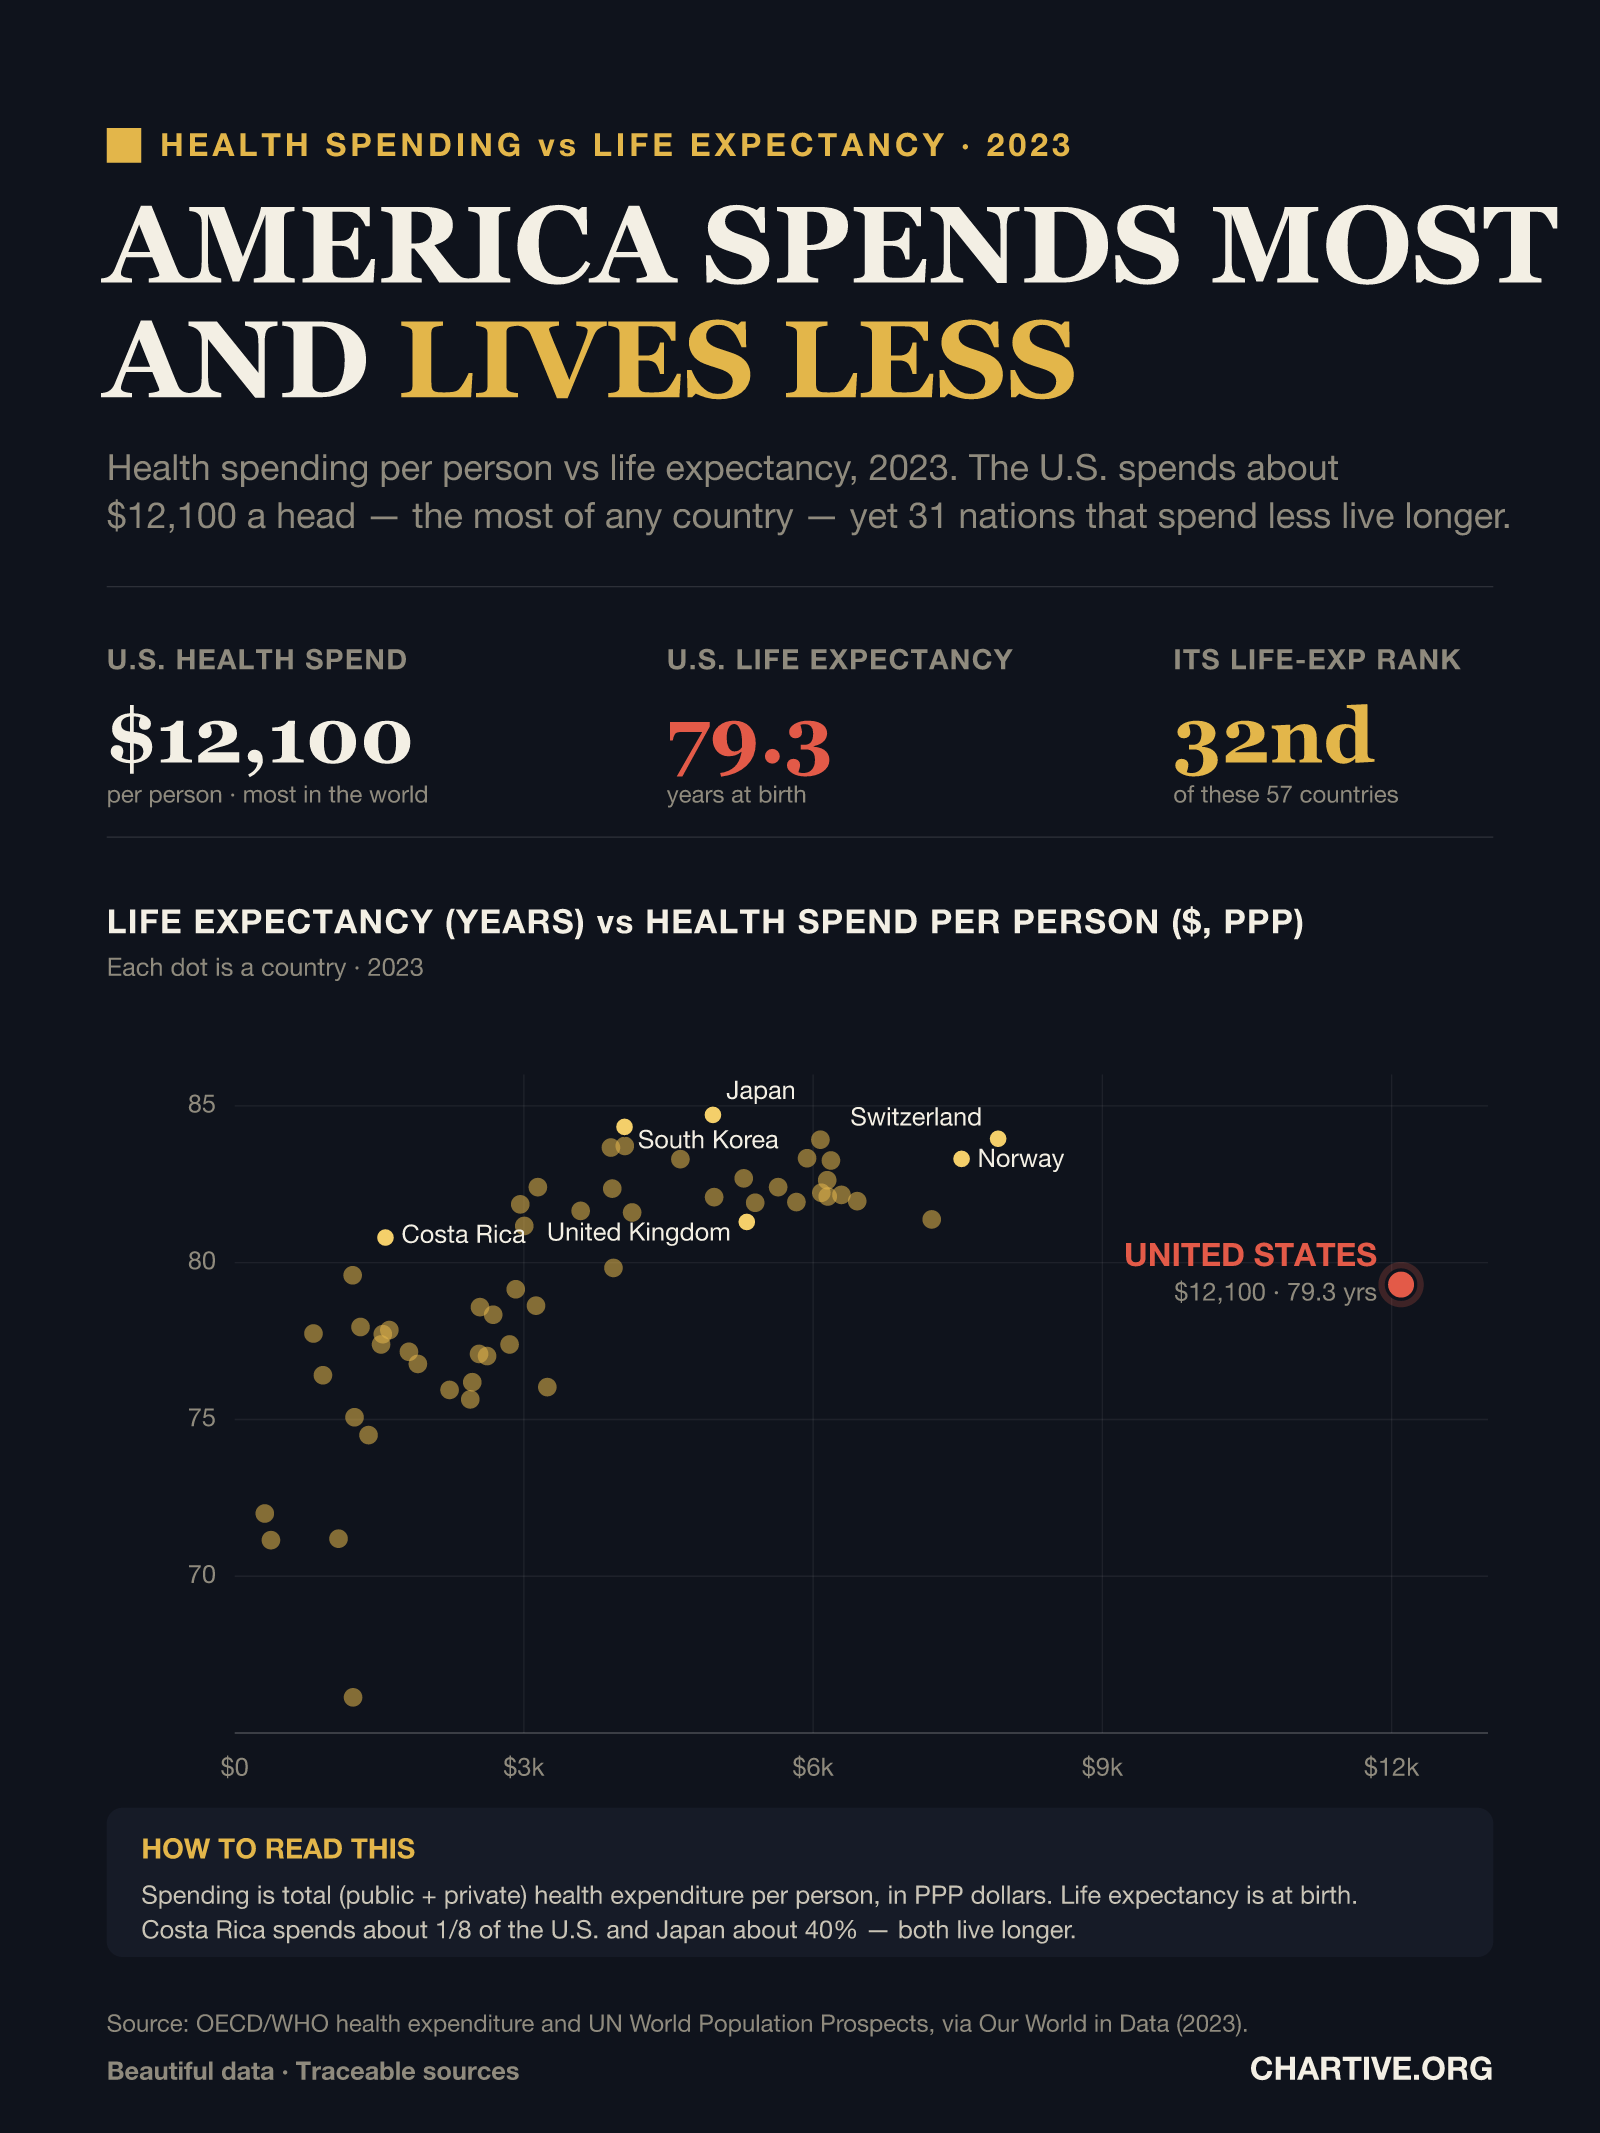
Health spending per person vs life expectancy across 57 countries in 2023. The U.S. spends about $12,100 a head — the most of any country — yet 31 nations that spend less live longer.
CSV · 57 rows · 2023
In 2023 the U.S. spent about $12,100 per person on health, more than any other country, but ranked only 32nd of 57 in life expectancy (79.3 years). Japan spends about 40% as much and lives 5 years longer; Costa Rica spends roughly one-eighth and still outlives it.
Key findings
- The U.S. spent about $12,100 per person on health in 2023 — the most in the world — yet ranked 32nd of 57 countries in life expectancy.
- Japan spends roughly 40% as much per person and lives about 5 years longer; South Korea spends a third and also lives 5 years longer.
- Costa Rica spends about one-eighth of the U.S. and still outlives it (80.8 vs 79.3 years).
Explore the data
Coverage: Jan 1, 2023 – Dec 31, 2023 · 57 countries
Free to download and reuse. Get the data behind every new chart →
Sources
Primary source
OECD/WHO; UN World Population Prospects
via Our World in Data
Life expectancy vs. health expenditure
Accessed Aug 22, 2026
Total health spending per capita (PPP$) vs period life expectancy at birth, 57 countries, 2023.
Methodology
Total (public and private) health spending per person in PPP dollars, plotted against period life expectancy at birth, for the 57 countries with data in 2023. Data are compiled by Our World in Data from OECD/WHO health expenditure statistics and the UN World Population Prospects.
What this does not show
Spending is total health expenditure per person in PPP dollars; life expectancy is period life expectancy at birth. Life expectancy reflects many factors beyond healthcare — diet, road and gun deaths, drug overdoses, and inequality — not spending alone. Figures are UN and OECD/WHO estimates for 2023.
Creator
Reuse this visualization
Cite this
License: CC BY 4.0
Embed code
<figure style="margin:0;max-width:1600px">
  <a href="https://chartive.org/visualizations/us-health-spend-vs-life-expectancy-2023" target="_blank" rel="noopener">
    <img src="https://chartive.org/infographics/us-health-spend-vs-life-expectancy-2023.png" alt="Scatter chart of health spending per person versus life expectancy in 57 countries in 2023. The United States is a red outlier at about $12,100 per person and 79.3 years, far to the right of countries like Japan ($5,000, 84.7 years) and Switzerland ($7,900, 84.0)." width="1600" height="2133" style="max-width:100%;height:auto" />
  </a>
  <figcaption style="font:14px/1.4 system-ui,sans-serif;color:#57534e;margin-top:8px">
    Graphic by Chartive Editorial, using data from OECD/WHO; UN World Population Prospects — via <a href="https://chartive.org/visualizations/us-health-spend-vs-life-expectancy-2023" target="_blank" rel="noopener">Chartive</a>
  </figcaption>
</figure>
Reuse is welcome — the embed keeps a link back to the source.