Economy
Verified dataThe American dream got more expensive
What it takes to finance a median-priced new U.S. home, 1975 vs. 2024.
CSV · 7 rows · 1975–2024
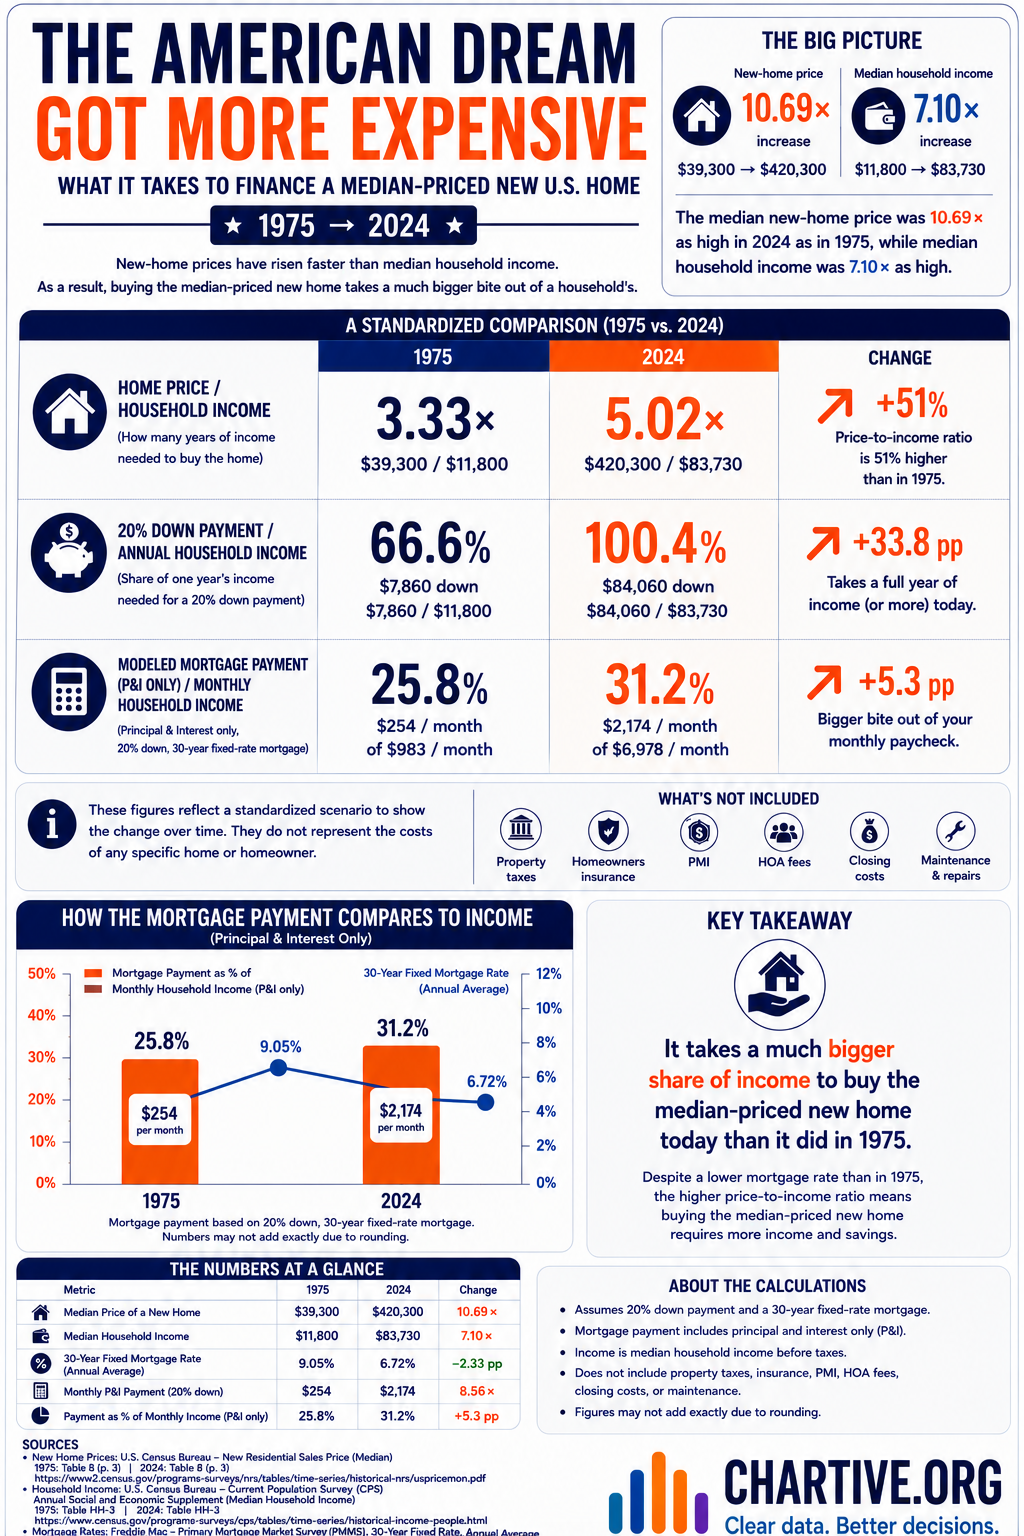
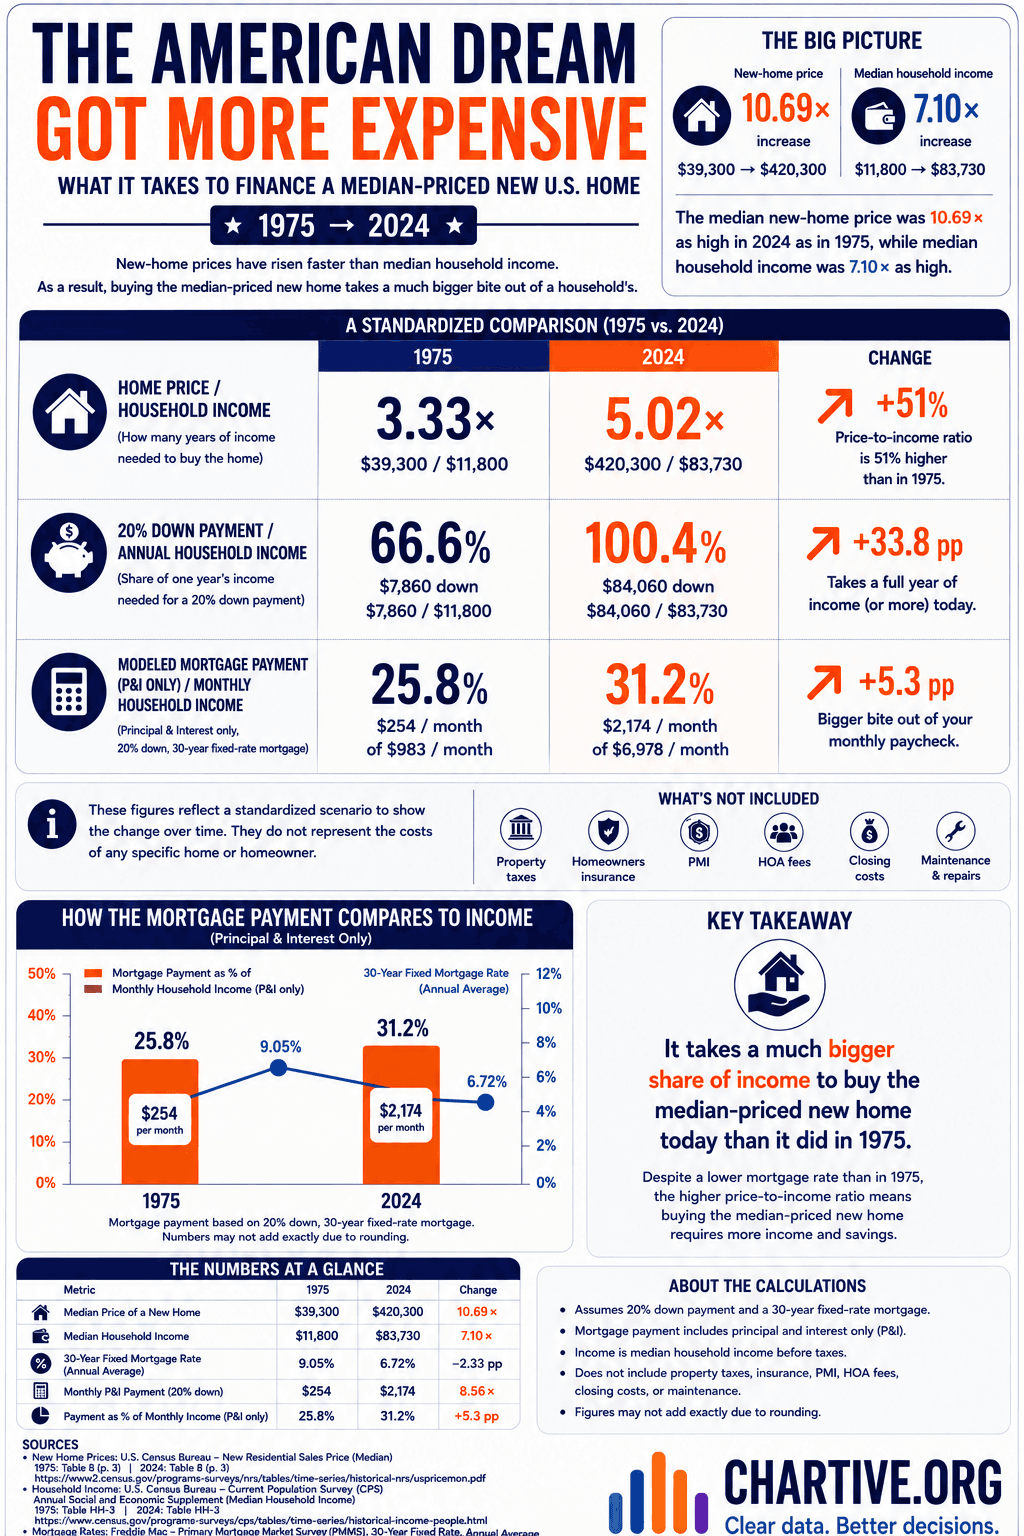
Buying the median-priced new U.S. home takes a much bigger share of income than in 1975 — the price-to-income ratio rose from 3.33× to 5.02×, and a 20% down payment now costs more than a full year's median household income.
Key findings
- The median new-home price rose 10.69× since 1975 ($39,300 → $420,300), while median household income rose 7.10× ($11,800 → $83,730).
- The price-to-income ratio climbed from 3.33× to 5.02× — 51% higher than in 1975.
- A 20% down payment now costs 100.4% of a year's median household income, up from 66.6% in 1975.
Explore the data
Coverage: Jan 1, 1975 – Dec 31, 2024 · United States
Free to download and reuse. Get the data behind every new chart →
Sources
Primary source
U.S. Census Bureau
U.S. Census Bureau
New Residential Sales — median new-home sales price
Accessed Aug 14, 2026
U.S. Census Bureau (CPS ASEC)
U.S. Census Bureau
Historical Income — median household income
Accessed Aug 14, 2026
Freddie Mac
Freddie Mac
Primary Mortgage Market Survey (PMMS), 30-year fixed rate
Accessed Aug 14, 2026
Methodology
A standardized comparison using median values. Home price is the U.S. Census Bureau median new-home sales price; income is median household income (Census CPS ASEC). The modeled mortgage assumes a 20% down payment and a 30-year fixed-rate mortgage at the year's average rate (Freddie Mac PMMS) and counts principal and interest only. Figures may not add exactly due to rounding.
What this does not show
These figures reflect a standardized scenario to show change over time — they do not represent any specific home or homeowner. The modeled payment excludes property taxes, homeowners insurance, PMI, HOA fees, closing costs, and maintenance. Income is median household income before taxes.
Creator
Reuse this visualization
Cite this
License: CC BY 4.0
Embed code
<figure style="margin:0;max-width:1024px">
  <a href="https://chartive.org/visualizations/american-dream-got-more-expensive-1975-2024" target="_blank" rel="noopener">
    <img src="https://chartive.org/infographics/american-dream-1975-2024.png" alt="Infographic comparing the cost of financing a median-priced new U.S. home in 1975 versus 2024: the home-price-to-income ratio rose from 3.33 to 5.02, a 20% down payment went from 66.6% to 100.4% of annual income, and the modeled mortgage payment rose from 25.8% to 31.2% of monthly income." width="1024" height="1536" style="max-width:100%;height:auto" />
  </a>
  <figcaption style="font:14px/1.4 system-ui,sans-serif;color:#57534e;margin-top:8px">
    Graphic by Chartive Editorial, using data from U.S. Census Bureau — via <a href="https://chartive.org/visualizations/american-dream-got-more-expensive-1975-2024" target="_blank" rel="noopener">Chartive</a>
  </figcaption>
</figure>
Reuse is welcome — the embed keeps a link back to the source.