Health
Verified dataAmerica started ahead on life expectancy — then fell behind
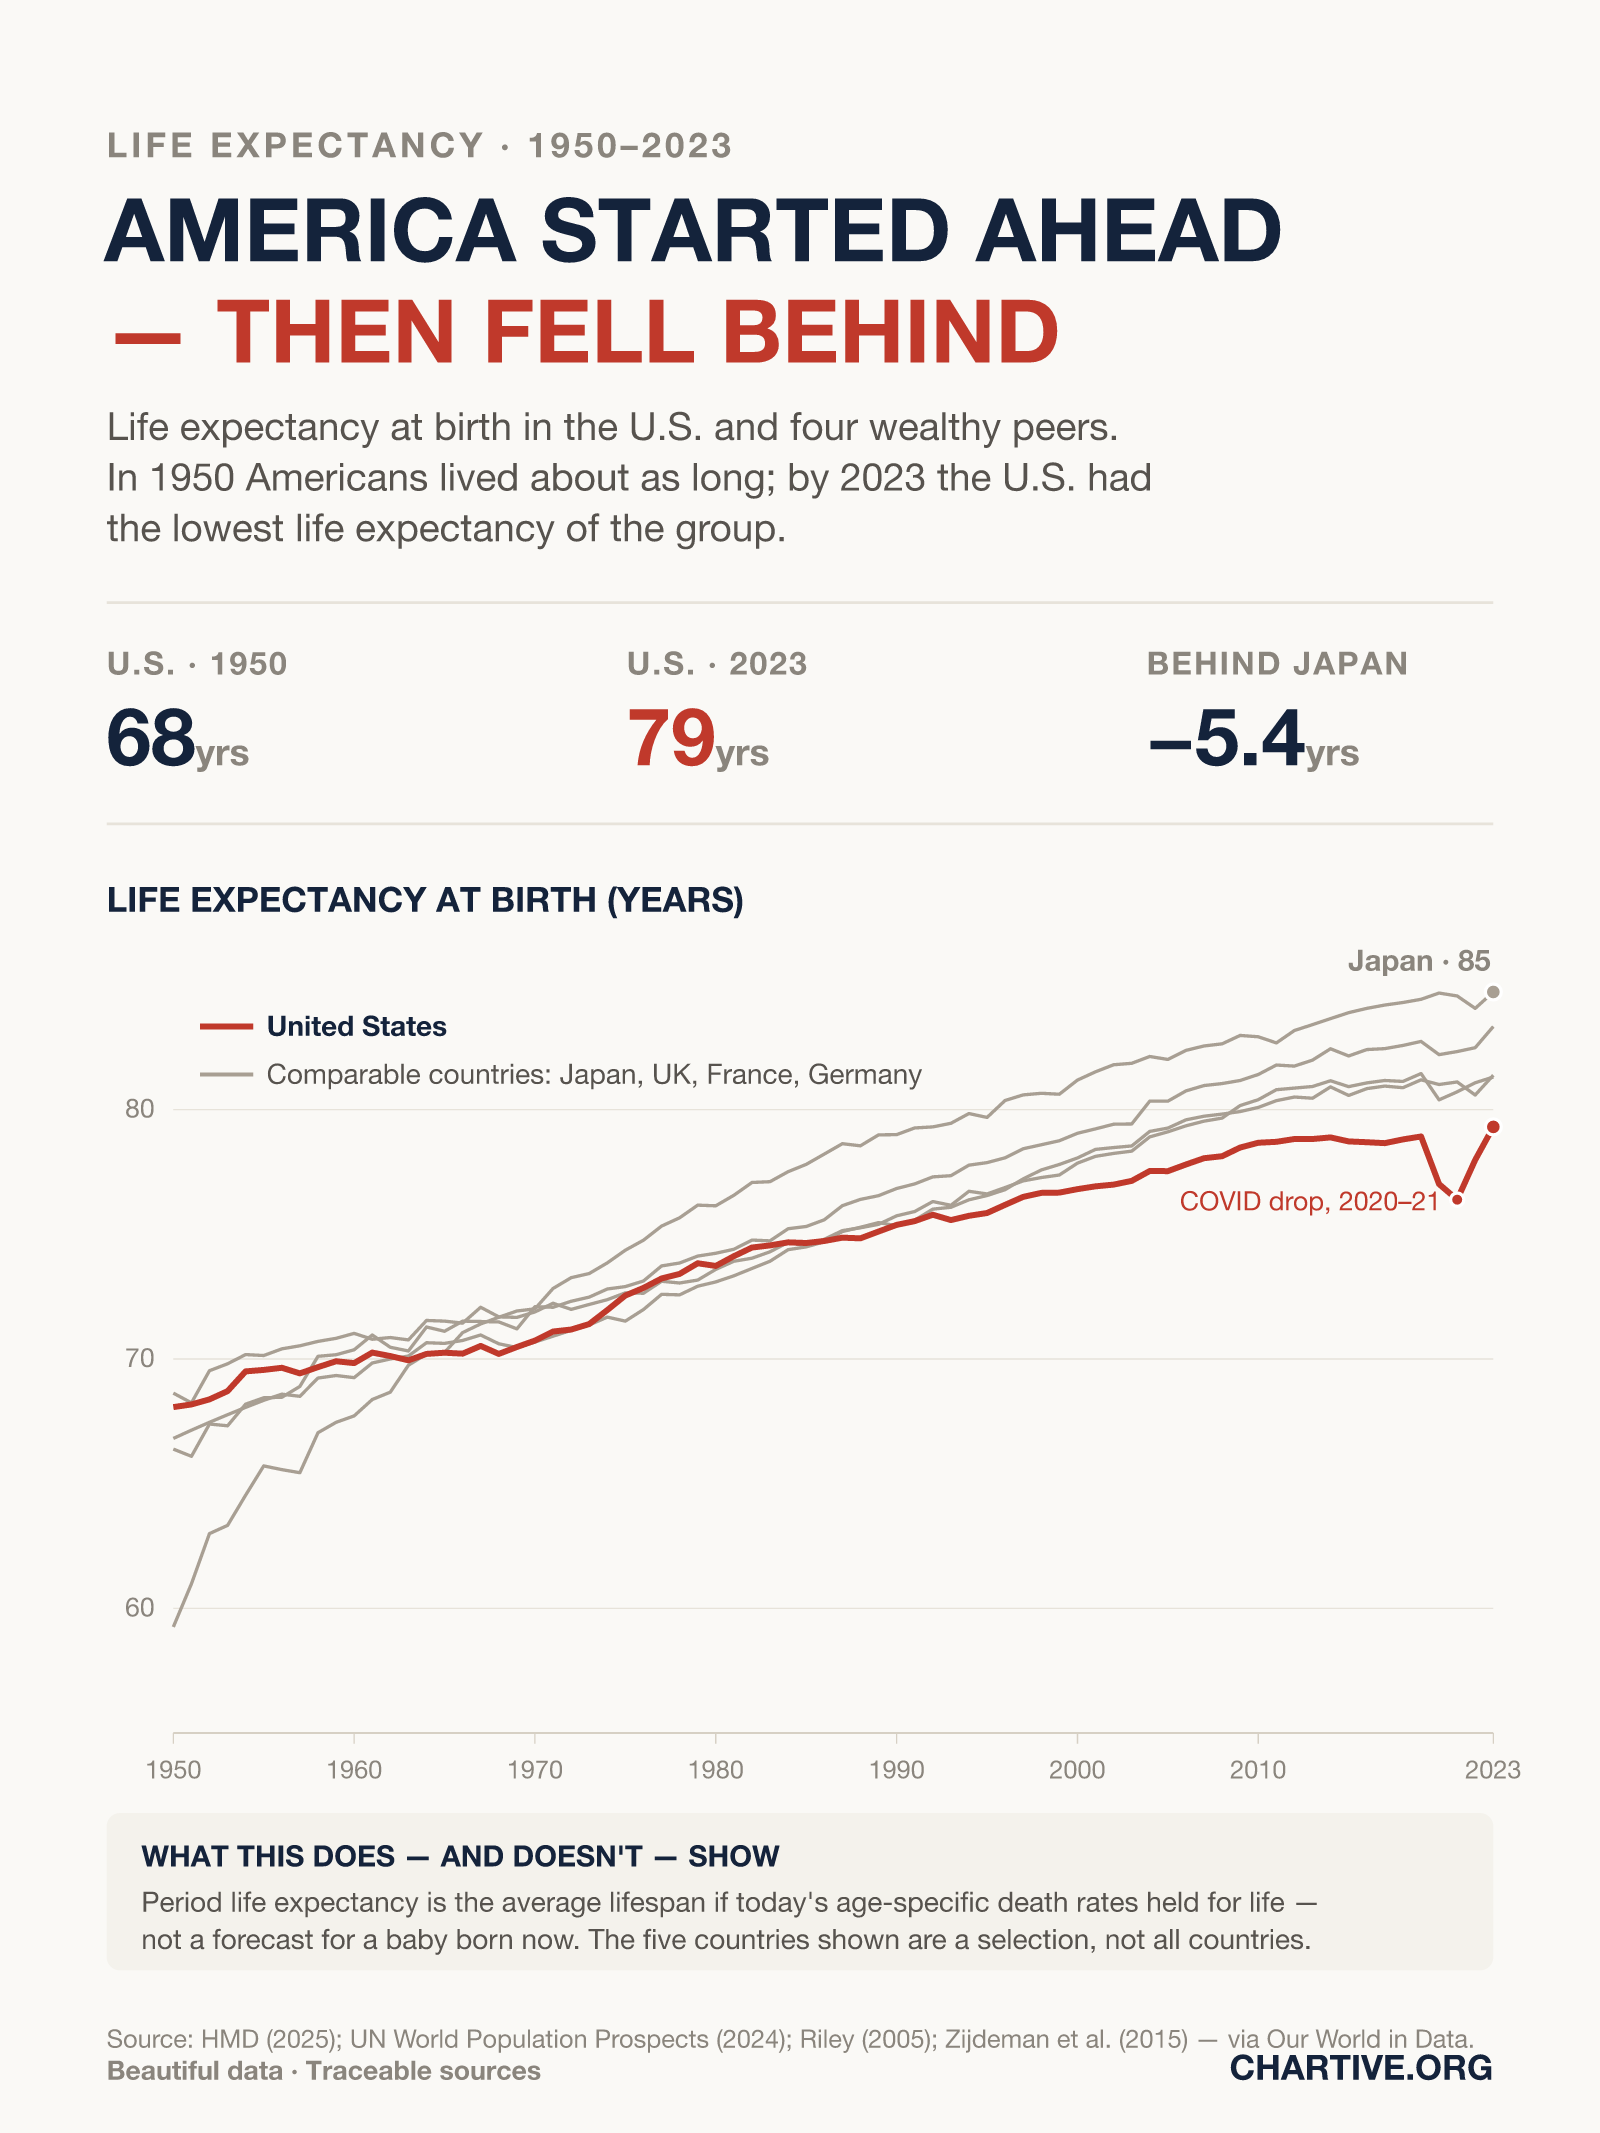
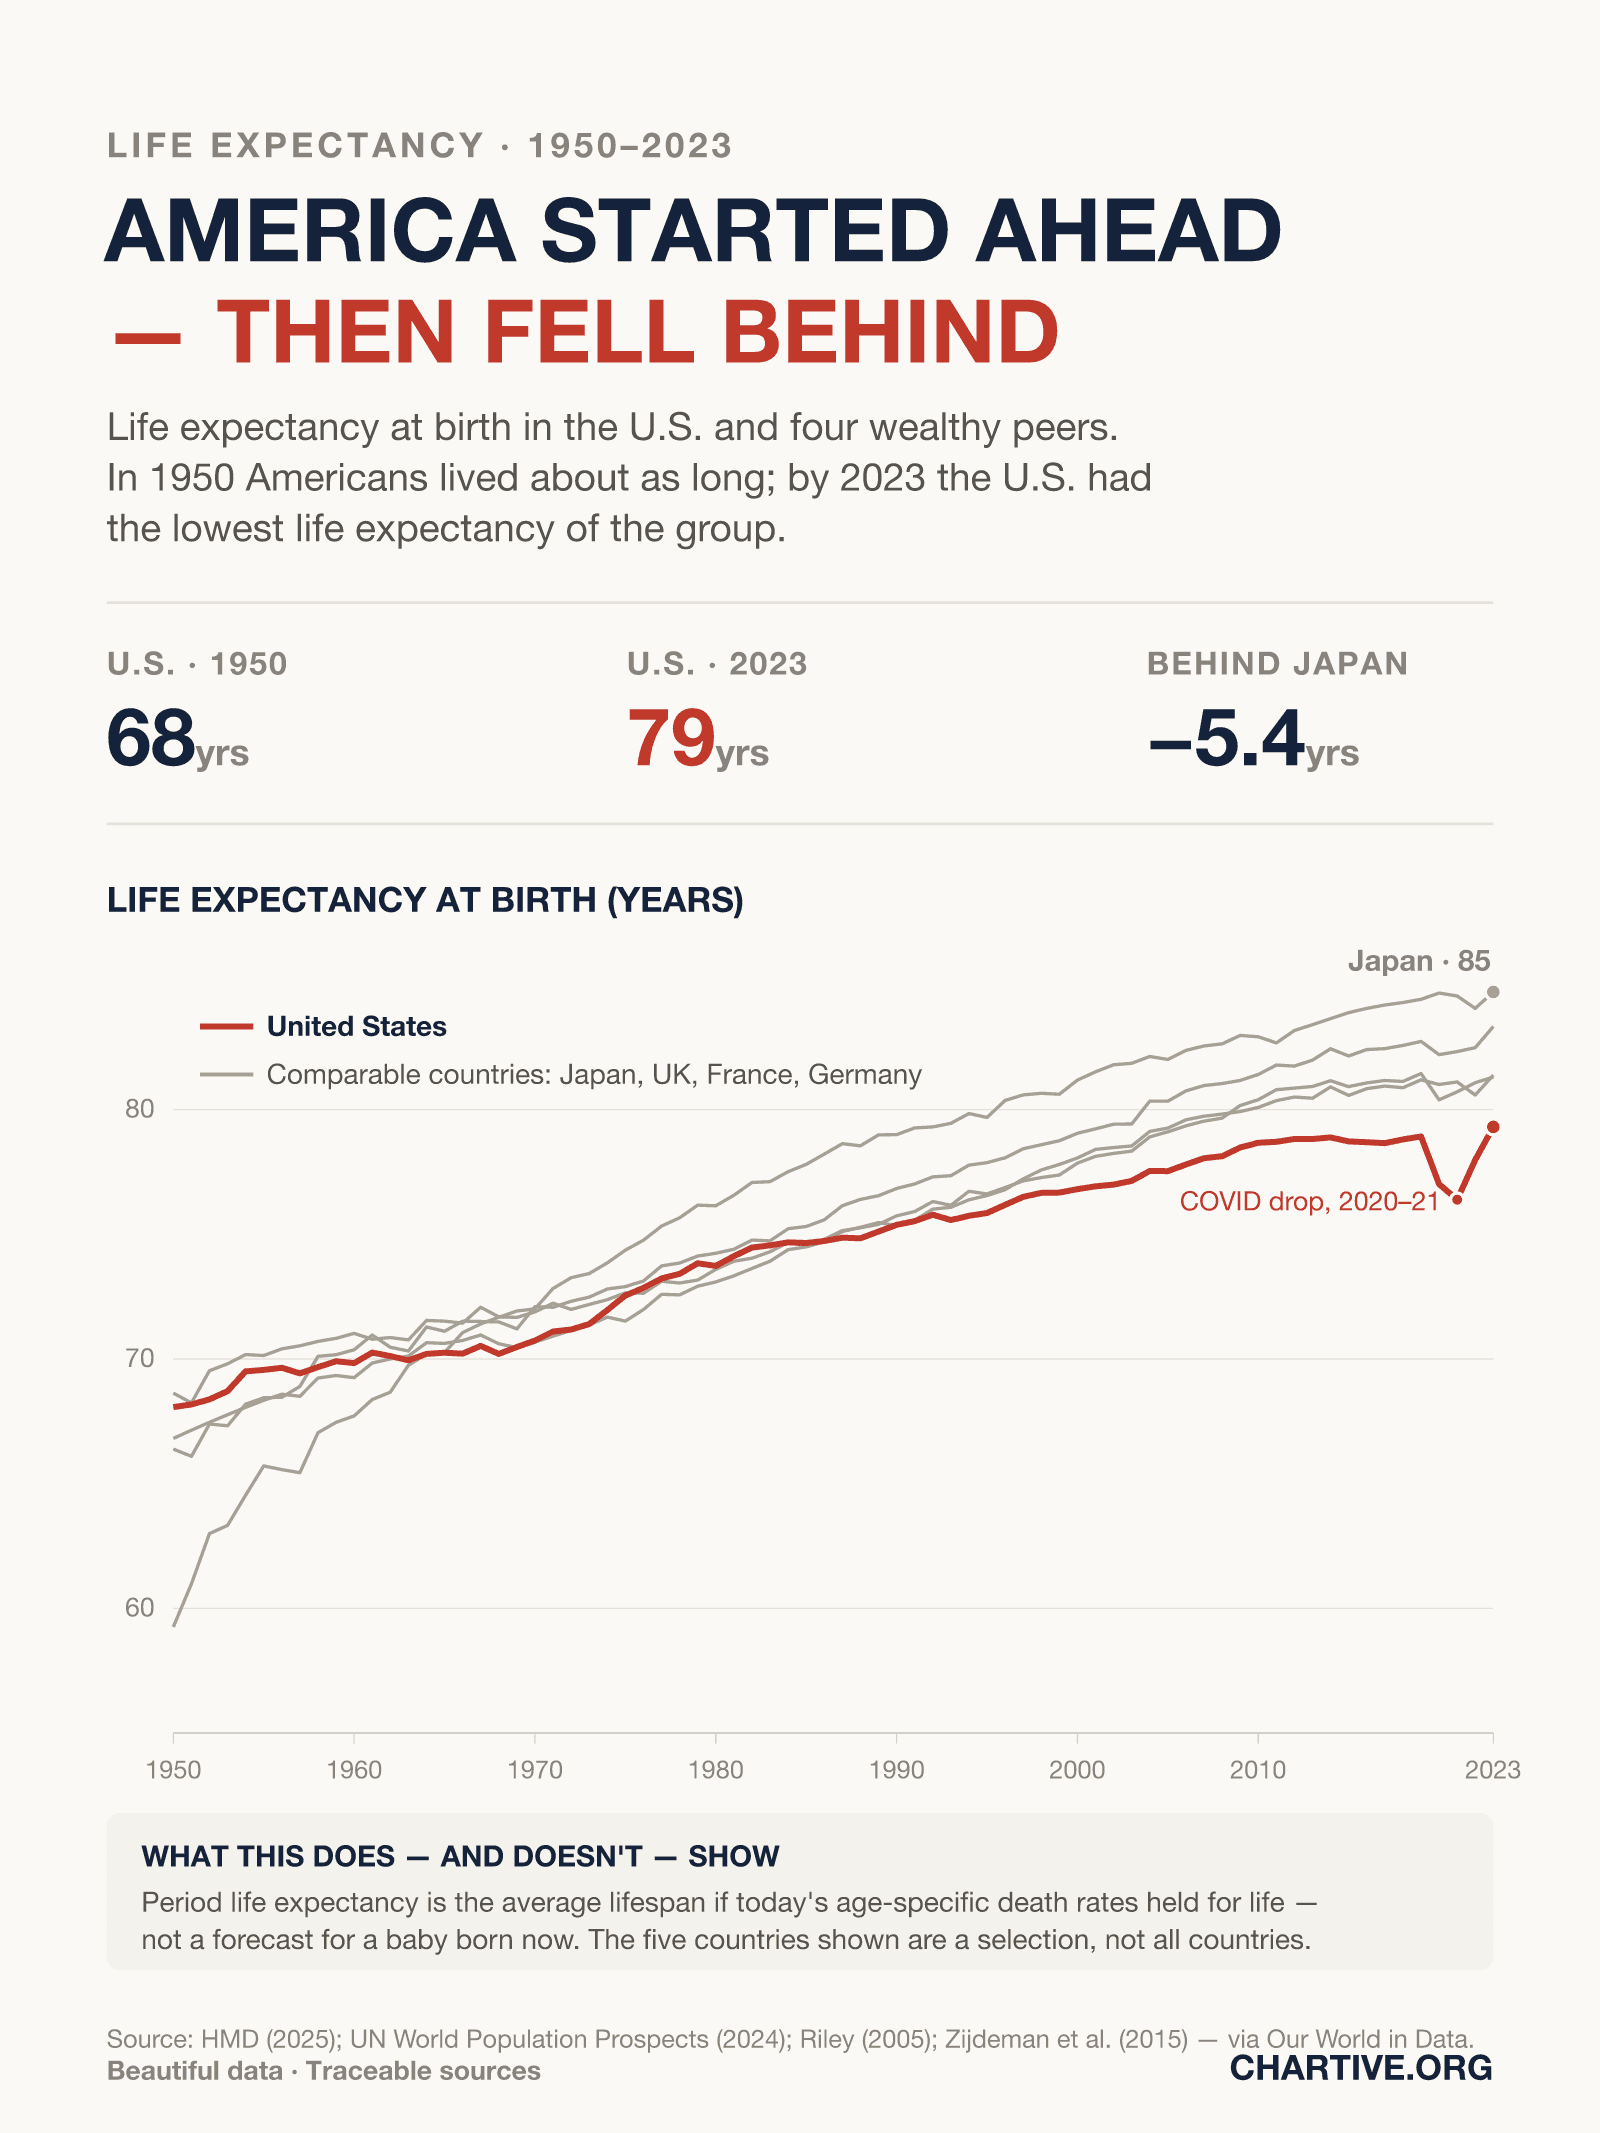
In 1950 the United States lived about as long as other wealthy countries. By 2023 it had the lowest life expectancy of the group — and lost the most ground during the pandemic.
CSV · 370 rows · 1950–2023
U.S. life expectancy rose from about 68 years in 1950 to 79 in 2023, but its wealthy peers rose faster — leaving the U.S. roughly 5 years behind Japan and at the bottom of this group.
Key findings
- In 1950 U.S. life expectancy (about 68 years) was roughly level with these peers — Japan was actually behind, at 59.
- By 2023 the U.S. reached 79 years, but that was the lowest of the five — about 5.4 years behind Japan (85).
- The U.S. lost roughly 2.5 years during the pandemic (2019–2021) before partly recovering; the peers barely dipped.
Explore the data
Coverage: Jan 1, 1950 – Dec 31, 2023 · United States and comparable countries
Free to download and reuse. Get the data behind every new chart →
Sources
Primary source
Our World in Data — Life expectancy
via Our World in Data
Life expectancy at birth
Accessed Aug 14, 2026
Compiled from the Human Mortality Database (2025), UN World Population Prospects (2024), Riley (2005) and Zijdeman et al. (2015). Period life expectancy at birth, in years.
Methodology
Period life expectancy at birth, in years, from 1950 to 2023, for the United States, Japan, the United Kingdom, France and Germany. Data are compiled by Our World in Data from the Human Mortality Database (2025), the UN World Population Prospects (2024), Riley (2005) and Zijdeman et al. (2015).
What this does not show
Period life expectancy is the average lifespan implied if a given year's age-specific death rates held for a whole lifetime — not a forecast for a baby born that year. The four peers are a selection of wealthy countries, not a comprehensive comparison. Cross-country gaps reflect many factors, including differences in health systems and in deaths from causes such as drug overdoses, firearms and chronic disease.
Creator
Reuse this visualization
Cite this
License: CC BY 4.0
Embed code
<figure style="margin:0;max-width:1600px">
  <a href="https://chartive.org/visualizations/us-life-expectancy-fell-behind-1950-2023" target="_blank" rel="noopener">
    <img src="https://chartive.org/infographics/us-life-expectancy-1950-2023.png" alt="Line chart of life expectancy at birth, 1950–2023, showing the United States (highlighted) rising from about 68 to 79 years but falling below Japan, the UK, France and Germany, with a dip during 2020–21." width="1600" height="2133" style="max-width:100%;height:auto" />
  </a>
  <figcaption style="font:14px/1.4 system-ui,sans-serif;color:#57534e;margin-top:8px">
    Graphic by Mara Ellison, using data from Our World in Data — Life expectancy — via <a href="https://chartive.org/visualizations/us-life-expectancy-fell-behind-1950-2023" target="_blank" rel="noopener">Chartive</a>
  </figcaption>
</figure>
Reuse is welcome — the embed keeps a link back to the source.