Economy
Verified dataAmerica got richer. The median income didn’t keep up.
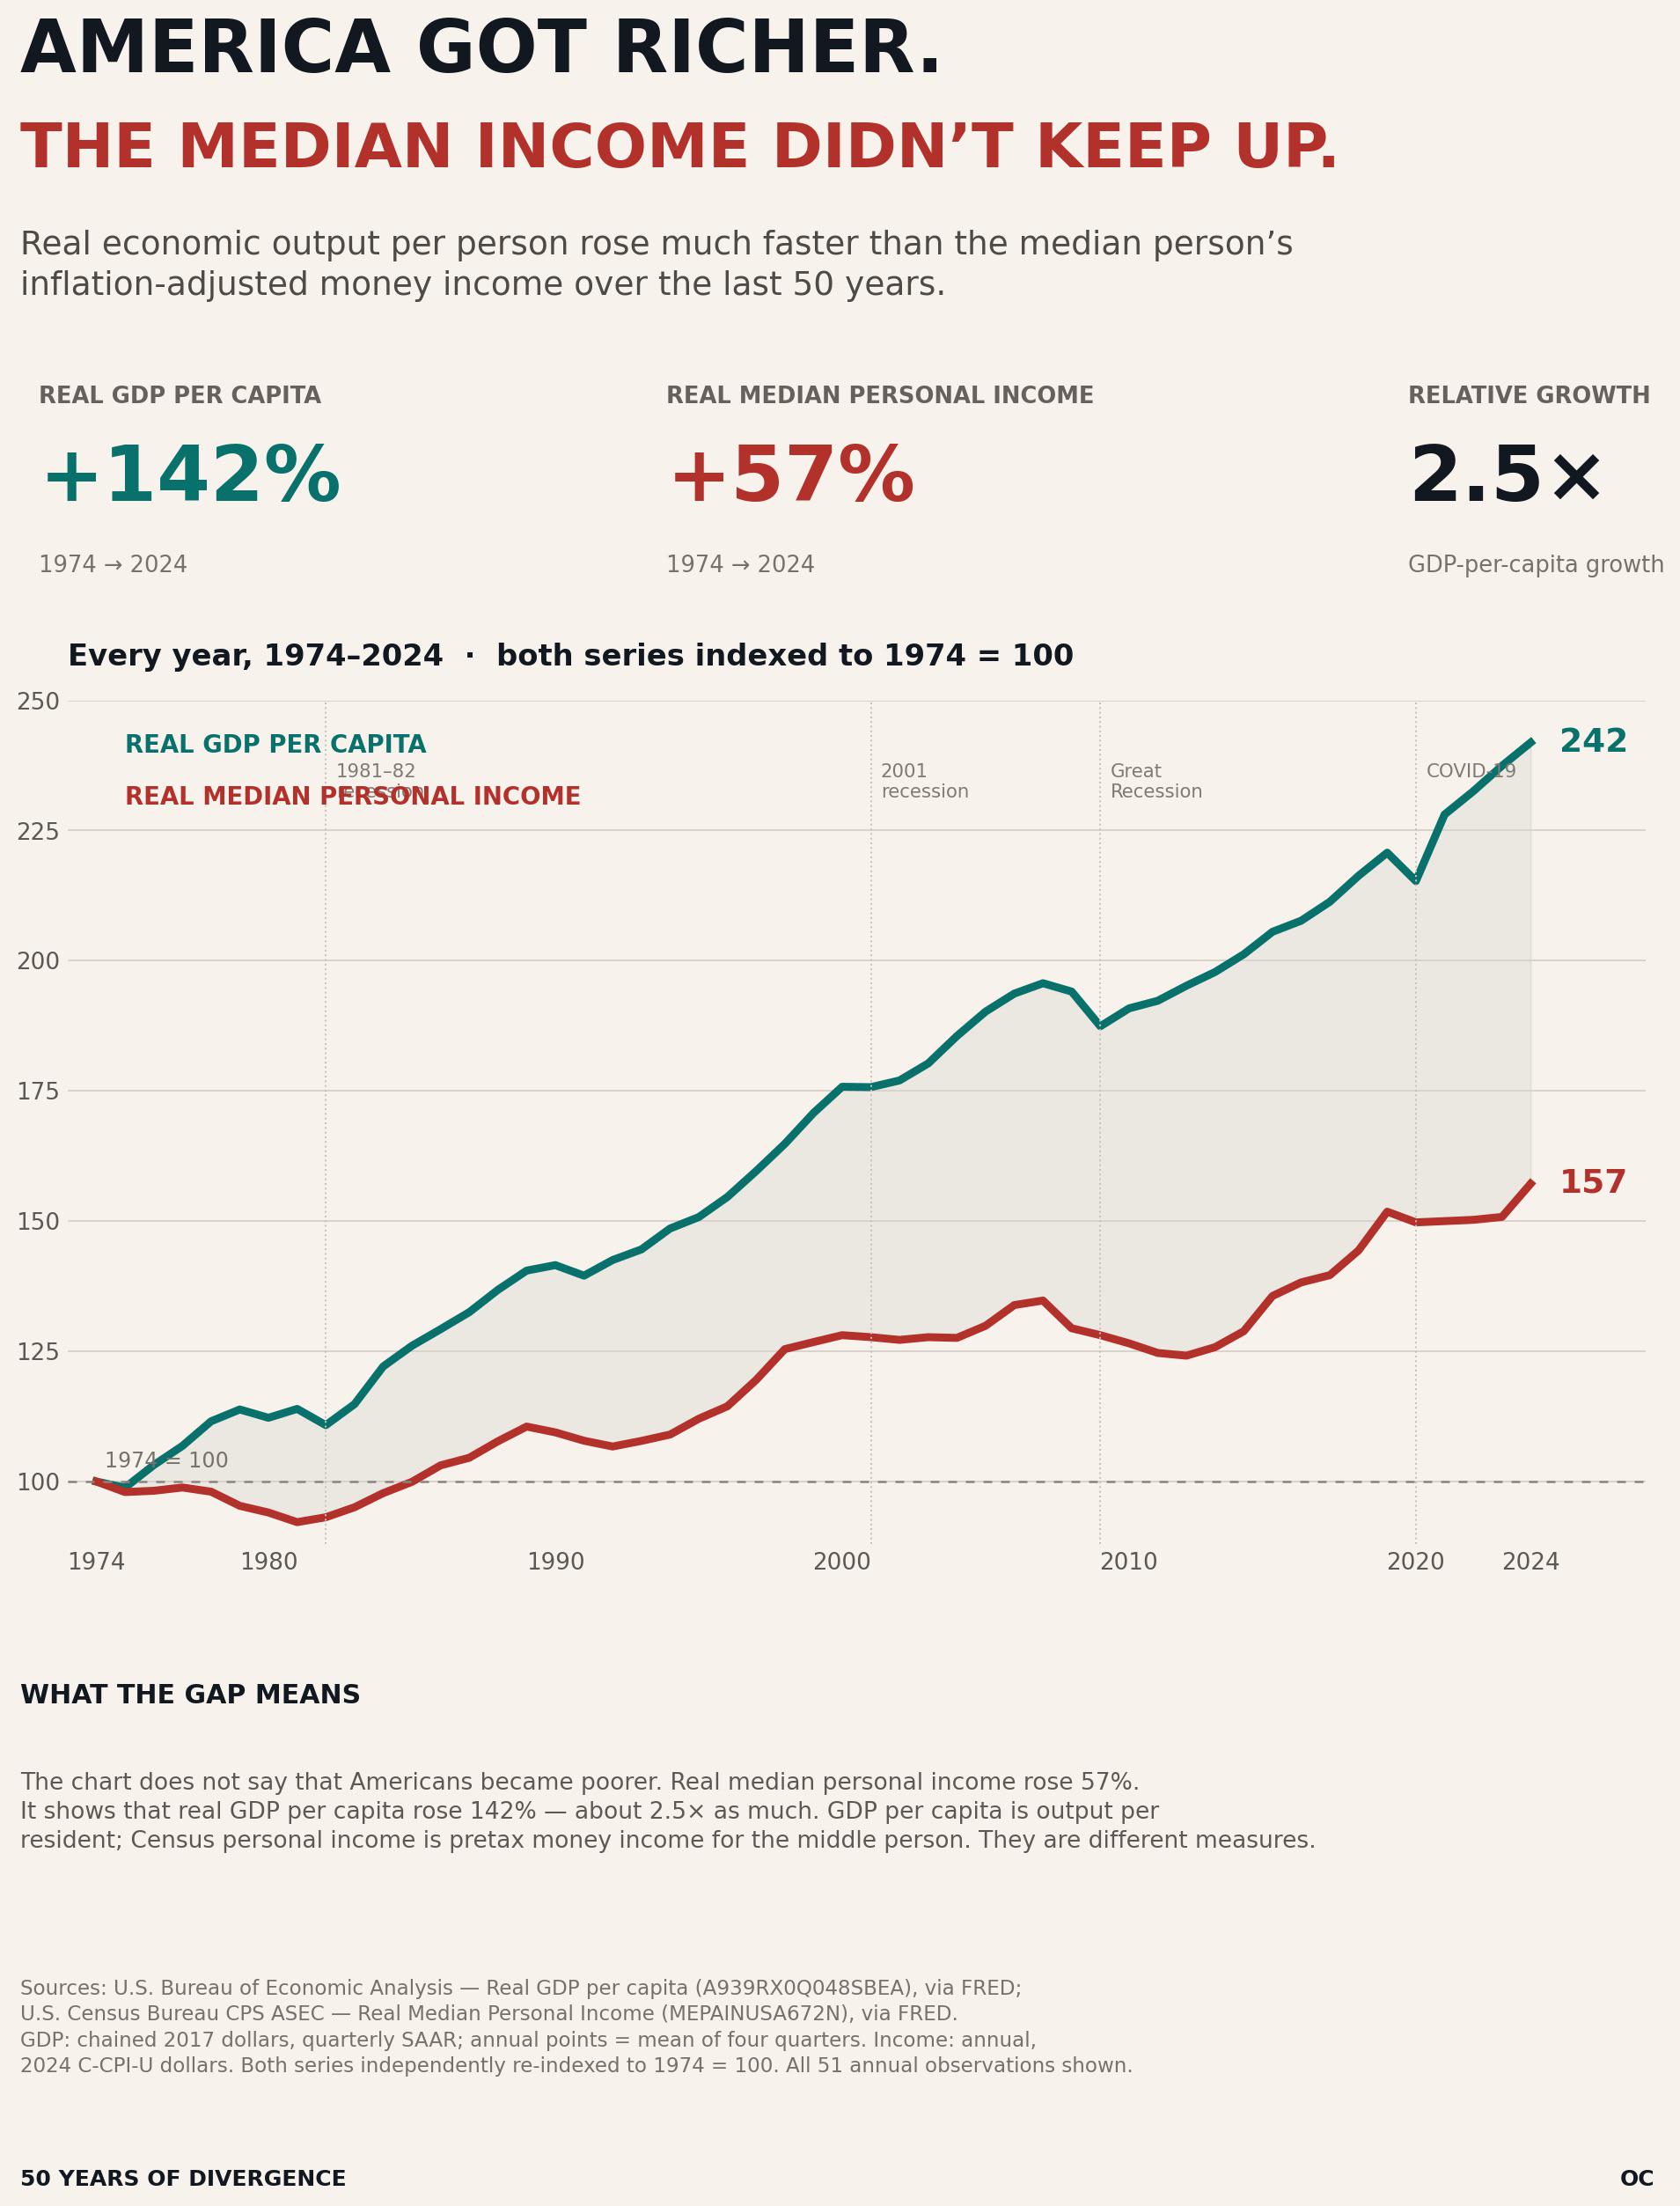
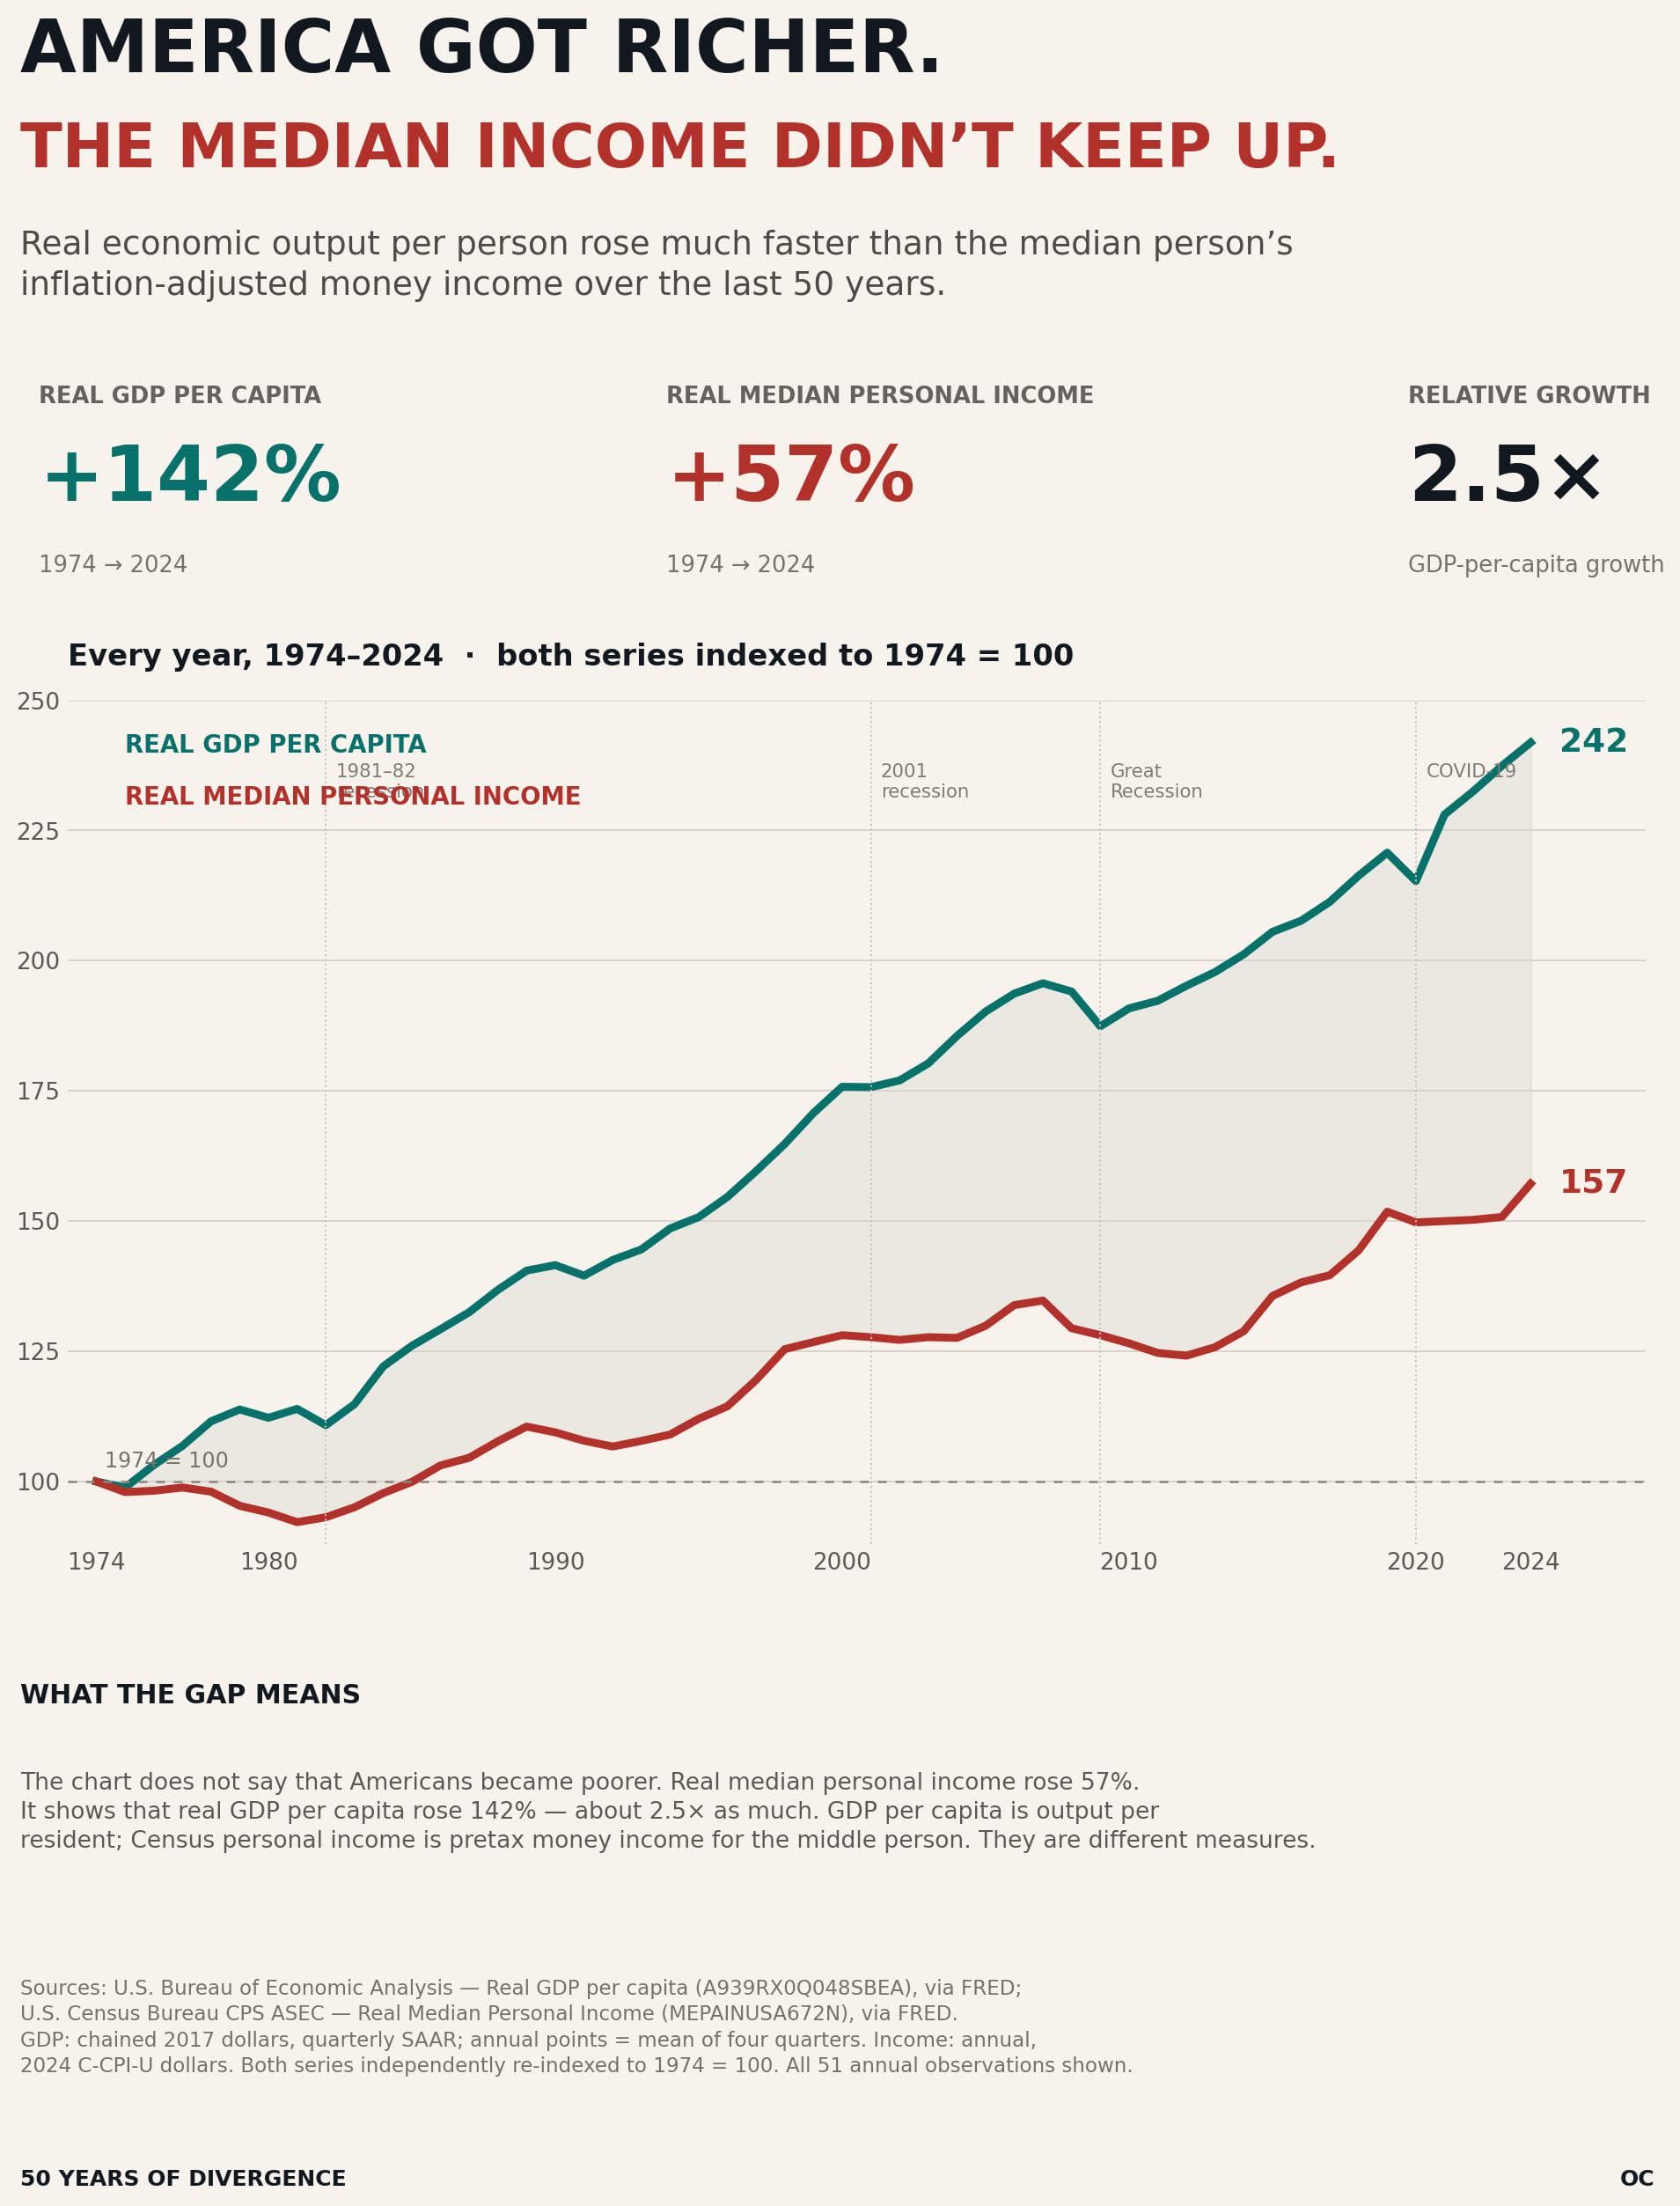
Real economic output per person rose much faster than the median person’s inflation-adjusted money income over the last 50 years.
CSV · 51 rows · 1974–2024
Since 1974, real GDP per capita rose about 142% while real median personal income rose 57% — output per person grew roughly 2.5× as fast as the typical person’s income.
Key findings
- Real GDP per capita grew about 142% between 1974 and 2024 (index 100 → 242).
- Real median personal income grew 57% over the same period (index 100 → 157).
- Output per person grew roughly 2.5× as fast as the typical person’s income — a widening gap.
Explore the data
Coverage: Jan 1, 1974 – Dec 31, 2024 · United States
Free to download and reuse. Get the data behind every new chart →
Sources
Primary source
U.S. Bureau of Economic Analysis
via FRED
Real GDP per capita (A939RX0Q048SBEA)
Accessed Aug 14, 2026
Chained 2017 dollars, quarterly SAAR; annual points = mean of four quarters.
U.S. Census Bureau (CPS ASEC)
via FRED
Real Median Personal Income (MEPAINUSA672N)
Accessed Aug 14, 2026
Annual, in 2024 C-CPI-U dollars.
Methodology
Two series are independently re-indexed to 1974 = 100 and plotted for every year, 1974–2024. Real GDP per capita is in chained 2017 dollars (quarterly SAAR; annual points are the mean of four quarters). Real median personal income is annual, in 2024 C-CPI-U dollars. All 51 annual observations are shown.
What this does not show
The chart does not say that Americans became poorer — real median personal income still rose 57%. It shows that real GDP per capita rose about 2.5× as much. GDP per capita is output per resident; Census personal income is pretax money income for the middle person. They are different measures.
Creator
Reuse this visualization
Cite this
License: CC BY 4.0
Embed code
<figure style="margin:0;max-width:1909px">
  <a href="https://chartive.org/visualizations/america-got-richer-median-income-didnt" target="_blank" rel="noopener">
    <img src="https://chartive.org/infographics/america-got-richer-1974-2024.jpeg" alt="Line chart, 1974–2024, of U.S. real GDP per capita (ending at index 242) rising far above real median personal income (ending at index 157), both indexed to 1974 = 100." width="1909" height="2506" style="max-width:100%;height:auto" />
  </a>
  <figcaption style="font:14px/1.4 system-ui,sans-serif;color:#57534e;margin-top:8px">
    Graphic by Chartive Editorial, using data from U.S. Bureau of Economic Analysis — via <a href="https://chartive.org/visualizations/america-got-richer-median-income-didnt" target="_blank" rel="noopener">Chartive</a>
  </figcaption>
</figure>
Reuse is welcome — the embed keeps a link back to the source.