Economy
Verified dataNearly 19 cents of every dollar the U.S. collects now goes to interest
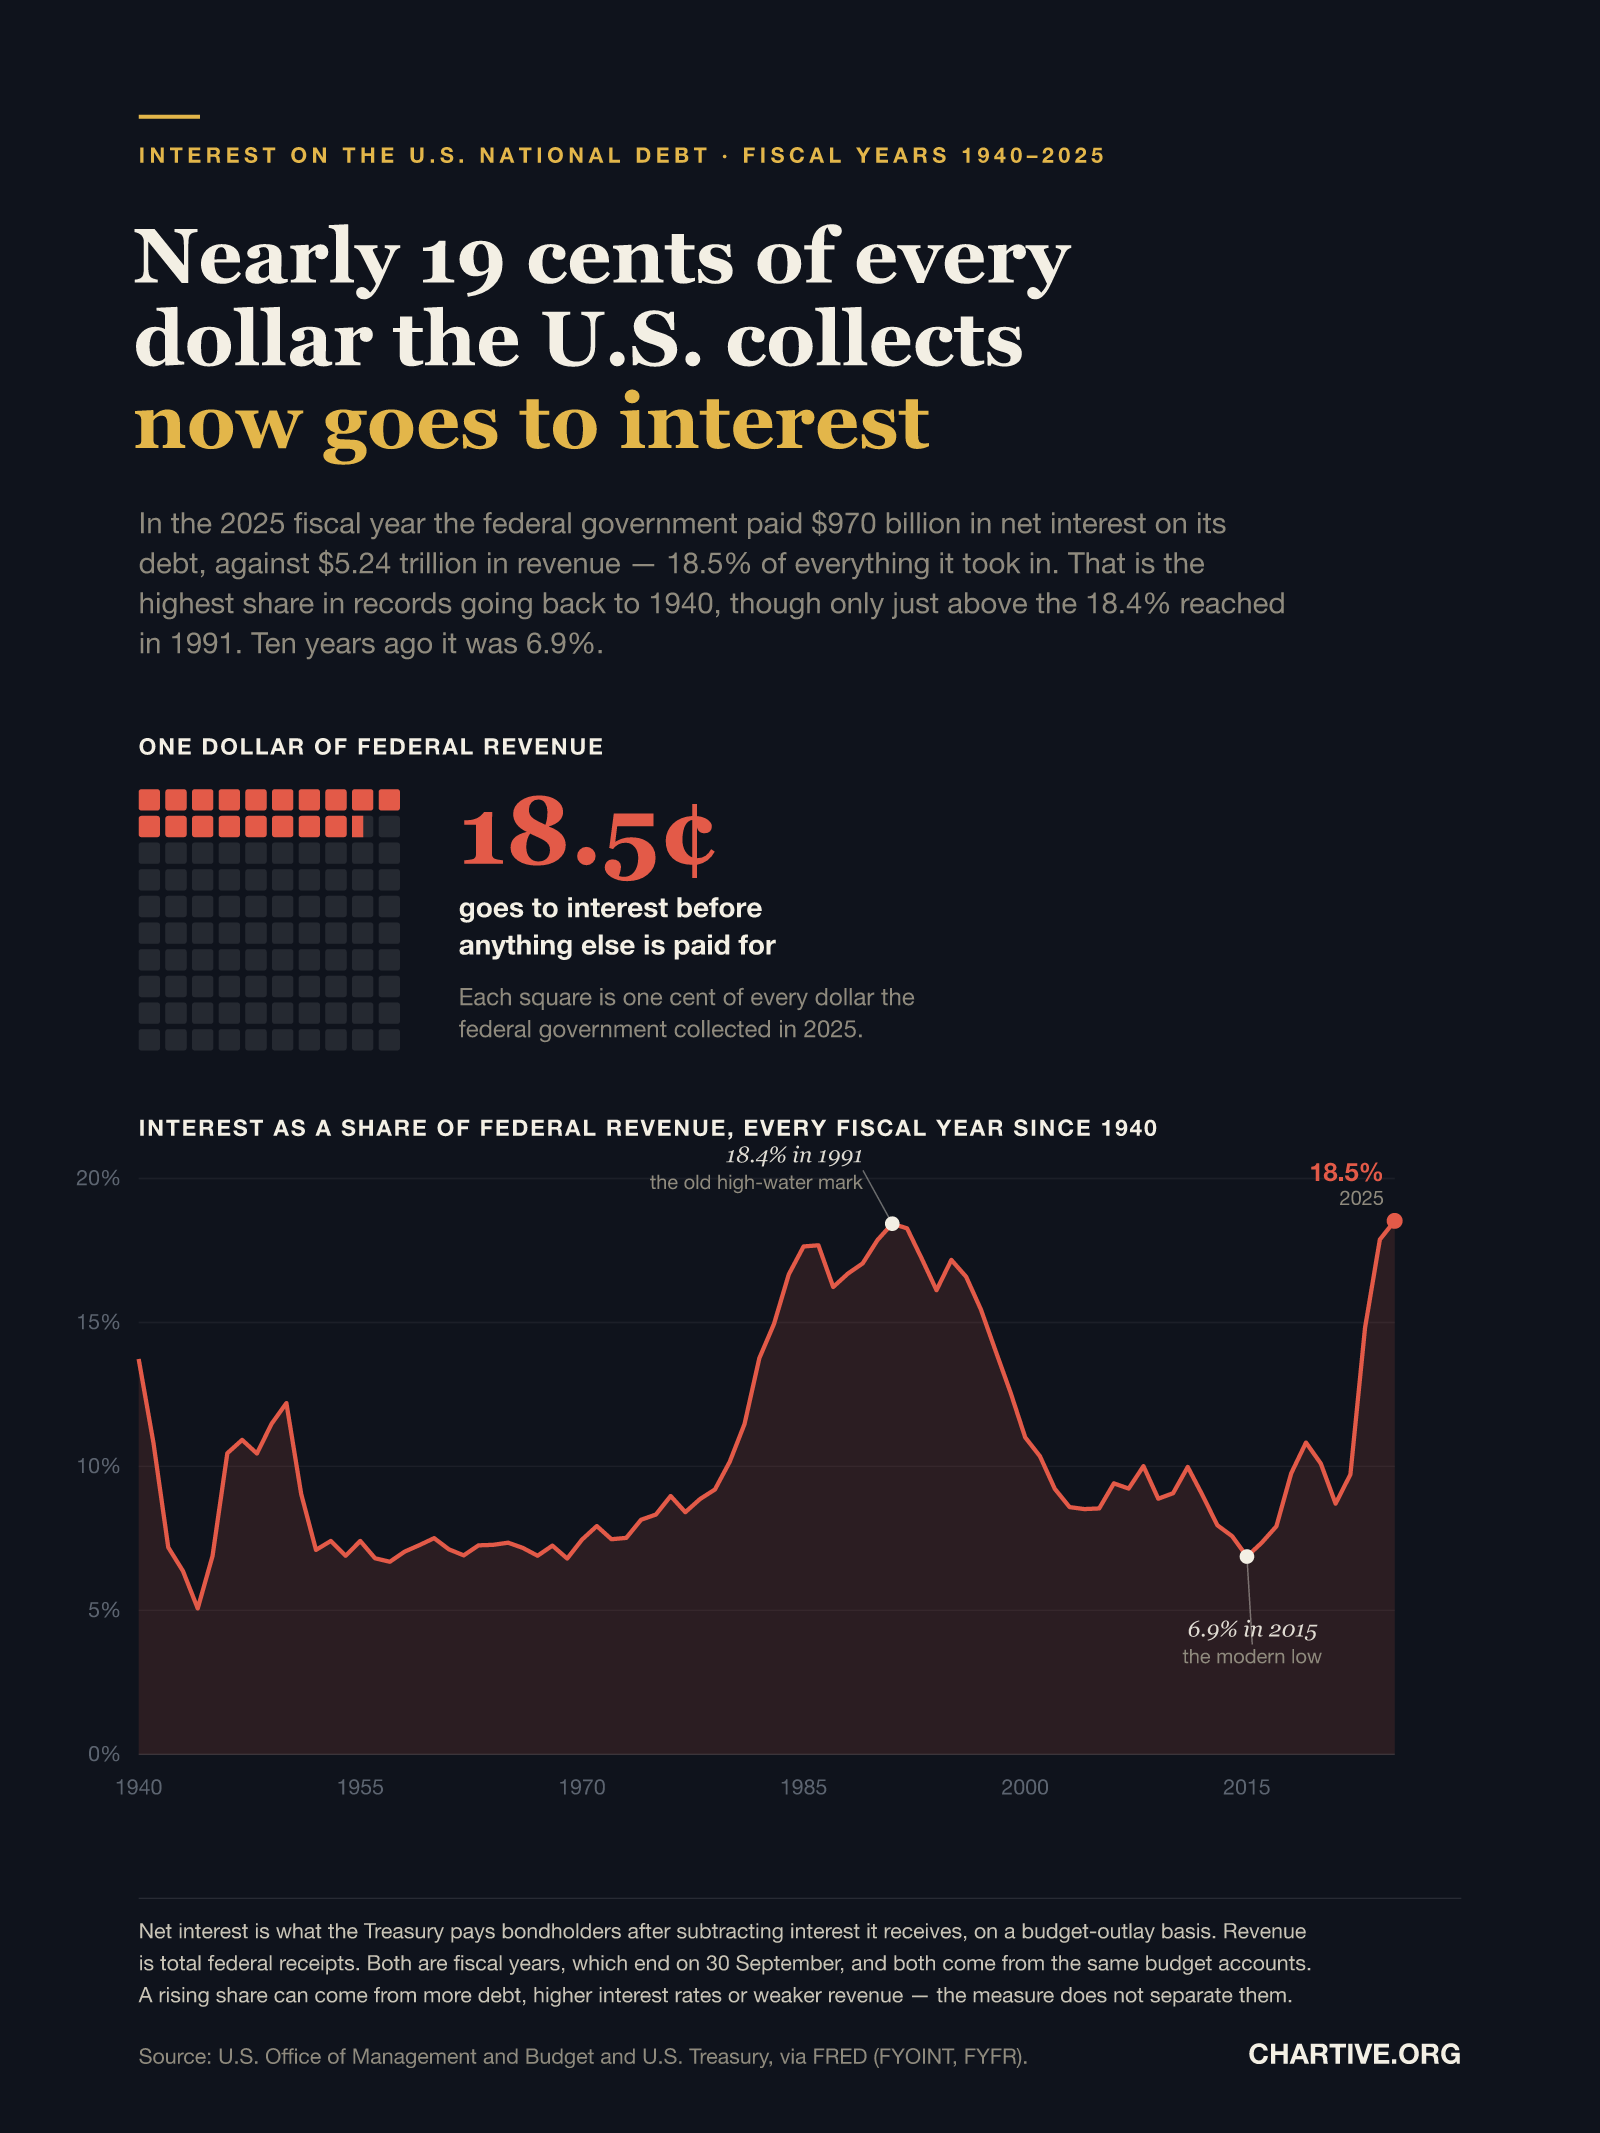
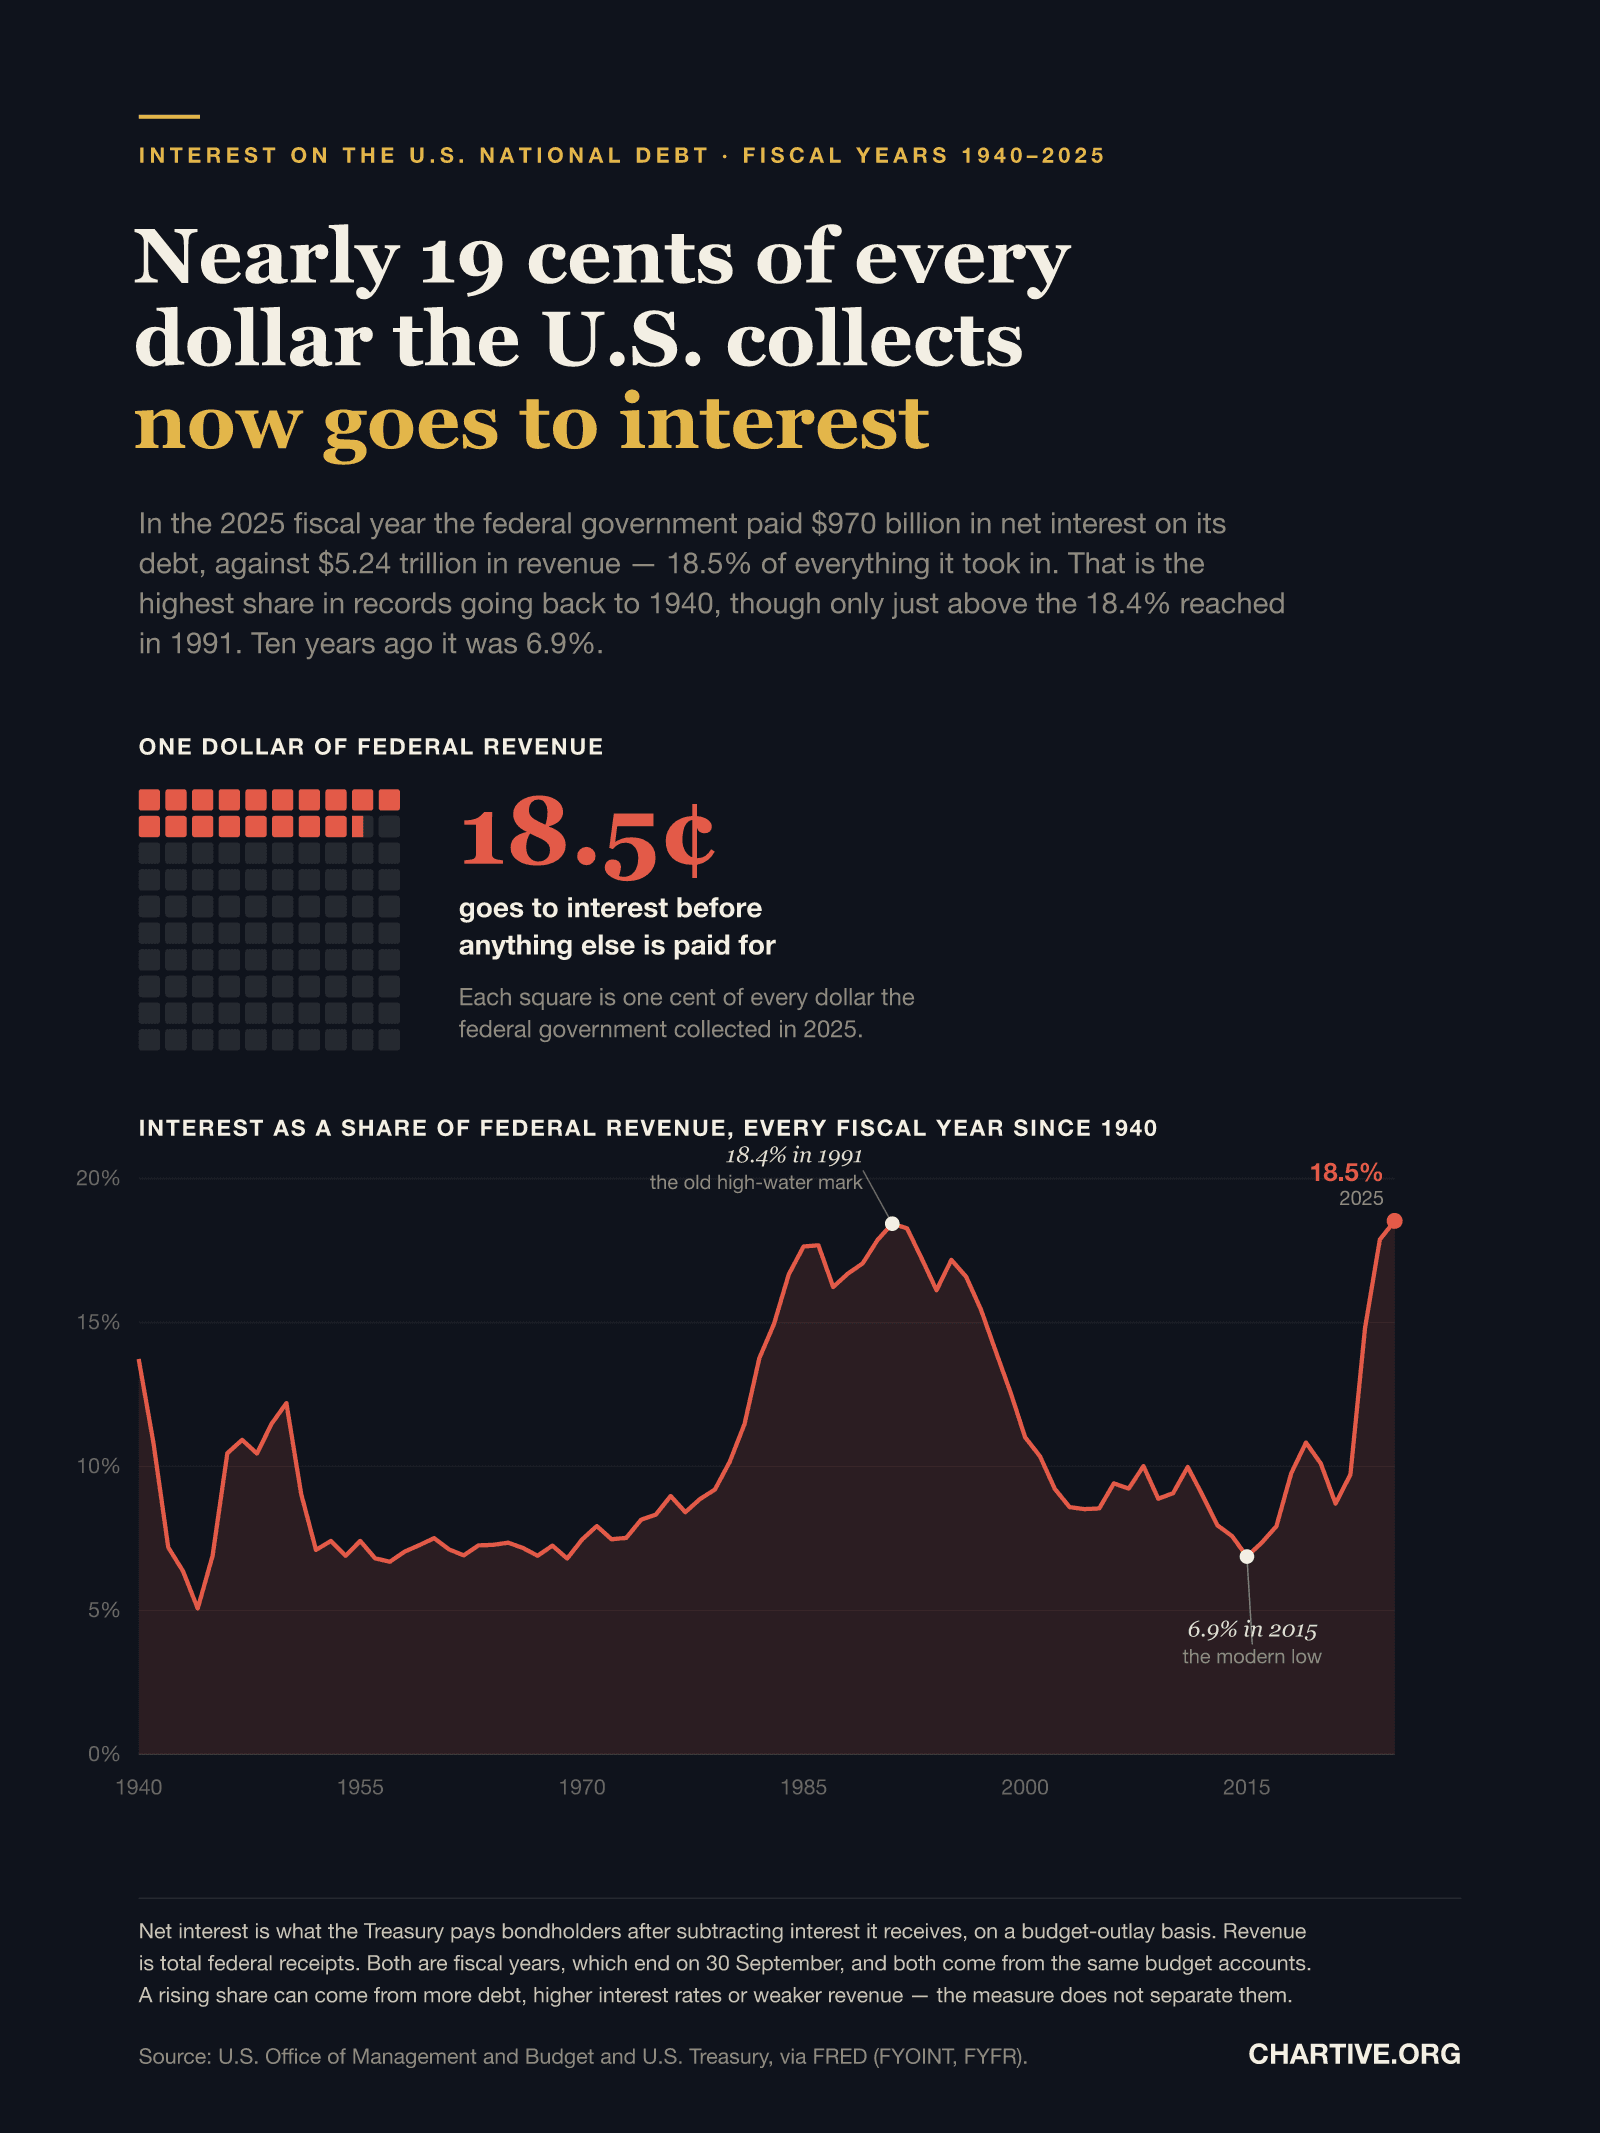
In the 2025 fiscal year the federal government paid $970 billion in net interest on its debt, against $5.24 trillion in revenue — 18.5% of everything it took in, the highest share in records going back to 1940.
CSV · 86 rows · 1940–2025
Net interest on the U.S. national debt reached $970 billion in the 2025 fiscal year, equal to 18.5% of all federal revenue — narrowly the highest share since records begin in 1940, just above the 18.4% reached in 1991. As recently as 2015 the figure was 6.9%. Almost a fifth of every dollar the federal government collects is now committed to interest before anything else is funded.
Key findings
- Net interest on the federal debt reached $970 billion in the 2025 fiscal year.
- That equals 18.5% of the $5.24 trillion the federal government collected in revenue.
- It is the highest share in records going back to 1940 — but only just, edging past the 18.4% of 1991.
- Ten years earlier, in 2015, interest took only 6.9% of revenue; the share has nearly tripled since.
- The 1980s and early 1990s saw a similar burden, driven then by high interest rates rather than by the size of the debt.
- Measured against total federal spending rather than revenue, interest is 13.8% — below the 15.4% peak of 1996.
Explore the data
Coverage: Oct 1, 1940 – Sep 30, 2025 · United States
Free to download and reuse. Get the data behind every new chart →
Sources
Primary source
Federal Outlays: Interest (FYOINT)
U.S. Office of Management and Budget
Federal net interest outlays, fiscal years
Accessed Aug 30, 2026
Net interest on a budget-outlay basis. The FY2024 value of $880bn matches the published Congressional Budget Office figure.
Primary source
Federal Government Current Receipts (FYFR)
U.S. Department of the Treasury
Total federal receipts, fiscal years
Accessed Aug 30, 2026
Total federal receipts on the same fiscal-year budget basis as the interest series.
Methodology
Both figures come from the same federal budget accounts, so they are directly comparable. Net interest is what the Treasury pays bondholders after subtracting interest the government receives, on a budget-outlay basis — series FYOINT. Revenue is total federal receipts — series FYFR. Both are fiscal years ending 30 September, retrieved via FRED from the Office of Management and Budget and the U.S. Treasury. The share is net interest divided by receipts. The pictogram divides one dollar of 2025 revenue into 100 squares and shades 18.5 of them. The 2024 figure of $880 billion matches the widely cited Congressional Budget Office number for that year, which confirms the series is net rather than gross interest.
What this does not show
The 2025 share of 18.5% is only 0.1 percentage points above the 1991 peak of 18.4%, so it is a record by the narrowest of margins rather than a decisive break. A rising share can come from more debt, from higher interest rates, or from weaker revenue, and this measure does not separate those causes — the 1990s peak was driven mainly by high interest rates, not by a larger debt. Net interest excludes interest the government pays to its own trust funds; gross interest is larger. Comparing interest to revenue is one framing among several: measured against the size of the economy or against total spending, the picture is less extreme, and interest stands at 13.8% of total outlays, below the 15.4% reached in 1996.
Creator
Reuse this visualization
Cite this
License: CC BY 4.0
Embed code
<figure style="margin:0;max-width:1600px">
  <a href="https://chartive.org/visualizations/us-interest-share-of-revenue-1940-2025" target="_blank" rel="noopener">
    <img src="https://chartive.org/infographics/us-interest-share-of-revenue-1940-2025.png" alt="A pictogram of one hundred squares representing one dollar of U.S. federal revenue, with 18.5 squares shaded red for interest. Below, a filled line chart shows net interest as a share of federal revenue for every fiscal year from 1940 to 2025. The line falls to about 5% in the 1940s, hovers near 7% through the 1950s and 1960s, climbs through the 1970s and 1980s to a peak of 18.4% in 1991, falls back to a low of 6.9% in 2015, then rises steeply to 18.5% in 2025." width="1600" height="2133" style="max-width:100%;height:auto" />
  </a>
  <figcaption style="font:14px/1.4 system-ui,sans-serif;color:#57534e;margin-top:8px">
    Graphic by Chartive Editorial, using data from Federal Outlays: Interest (FYOINT) — via <a href="https://chartive.org/visualizations/us-interest-share-of-revenue-1940-2025" target="_blank" rel="noopener">Chartive</a>
  </figcaption>
</figure>
Reuse is welcome — the embed keeps a link back to the source.