Economy
Verified dataHome prices soared — incomes didn't
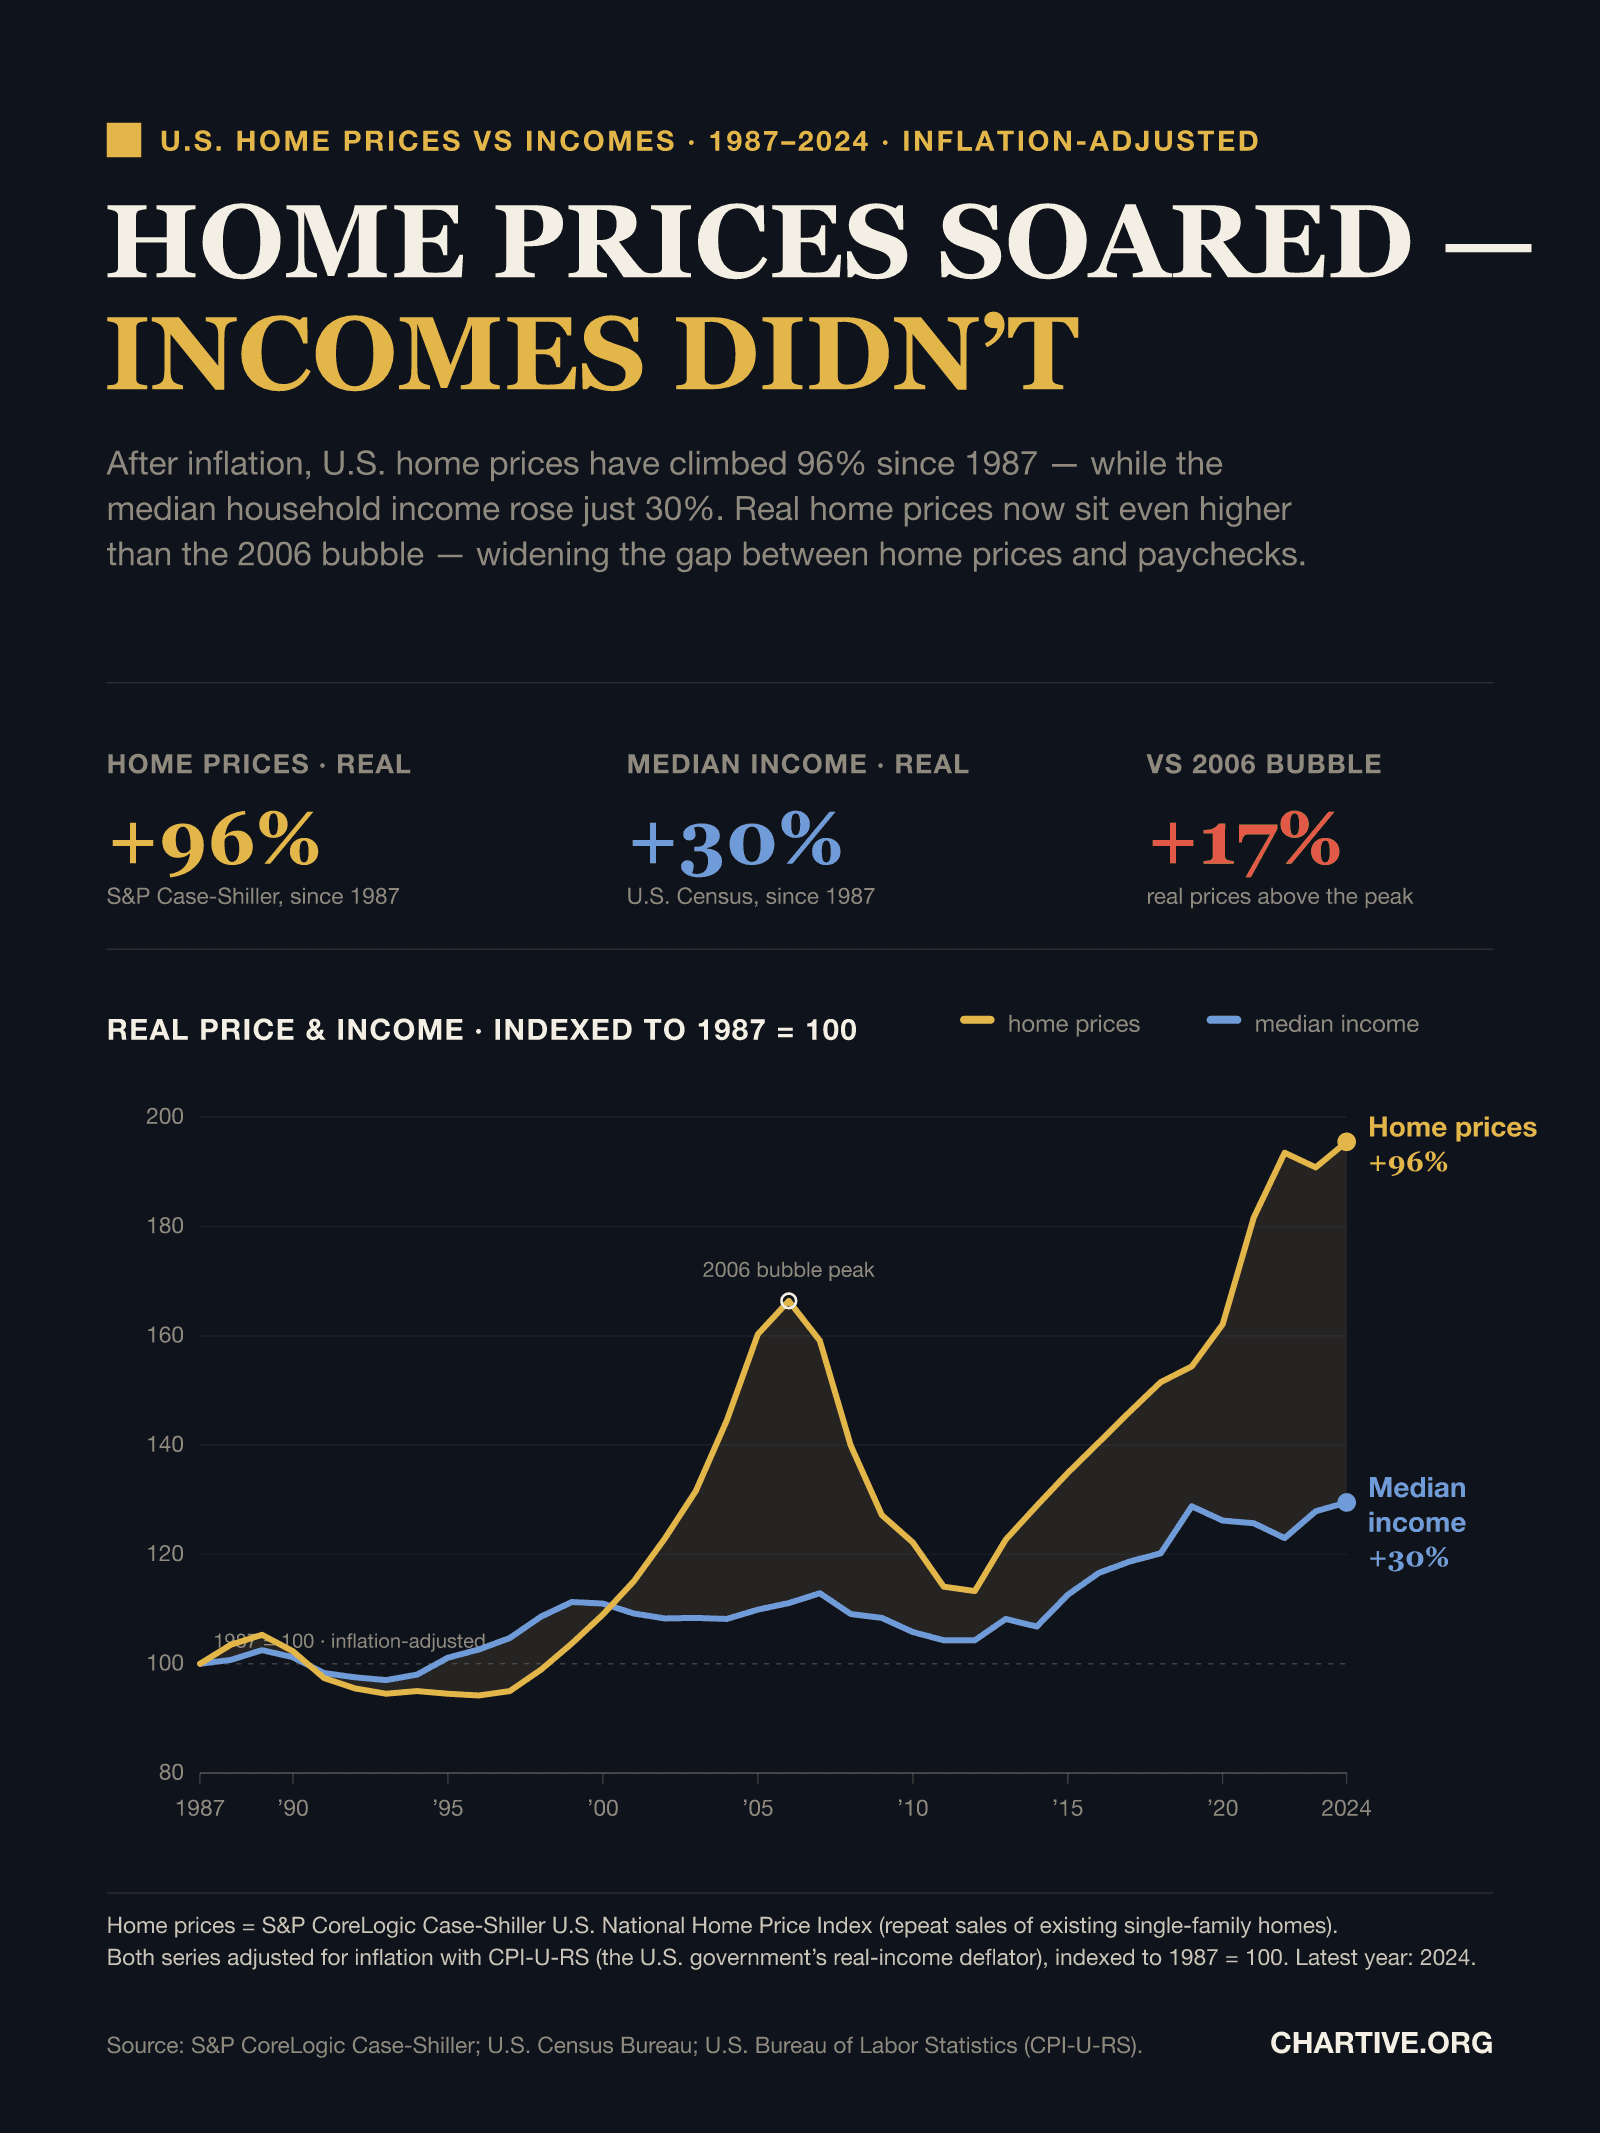
After inflation, U.S. home prices climbed 96% between 1987 and 2024 while the median household income rose just 30% — pushing real prices above even the 2006 bubble.
CSV · 38 rows · 1987–2024
Adjusted for inflation, U.S. home prices rose 96% from 1987 to 2024 while the median household income rose only 30%. Real home prices in 2024 stood about 17% above the 2006 housing-bubble peak — an all-time high — widening the gap between what homes cost and what households earn.
Key findings
- After inflation, U.S. home prices rose 96% between 1987 and 2024 — while the median household income rose just 30%.
- Real home prices in 2024 sat about 17% above the 2006 housing-bubble peak — an all-time high.
- The 2000s bubble and 2008–2012 crash are clearly visible, yet prices have since climbed well past the old peak.
Explore the data
Coverage: Jan 1, 1987 – Dec 31, 2024 · United States
Free to download and reuse. Get the data behind every new chart →
Sources
Primary source
S&P CoreLogic Case-Shiller U.S. National Home Price Index
S&P Dow Jones Indices (via FRED, series CSUSHPINSA)
U.S. National Home Price Index
Accessed Aug 29, 2026
Repeat-sales index of existing single-family home prices; annual average, deflated by CPI-U-RS and indexed to 1987 = 100.
Primary source
Median Household Income in the United States
U.S. Census Bureau (via FRED, series MEHOINUSA646N / MEHOINUSA672N)
Median household income (current and real dollars)
Accessed Aug 29, 2026
Census real median household income (CPI-U-RS adjusted); indexed to 1987 = 100.
Primary source
Consumer Price Index research series (CPI-U-RS)
U.S. Bureau of Labor Statistics
CPI-U-RS deflator
Accessed Aug 29, 2026
Inflation deflator applied to both series; derived from the Census nominal and real median-income series.
Methodology
Home prices are the S&P CoreLogic Case-Shiller U.S. National Home Price Index (repeat sales of existing single-family homes). Income is U.S. Census Bureau median household income. Both series are adjusted for inflation using the CPI-U-RS price index — the measure the U.S. government uses for official real-income statistics — and indexed to 1987 = 100. Values are annual; the latest year with both series is 2024.
What this does not show
Both series are shown in real (inflation-adjusted) terms using CPI-U-RS; the exact percentages shift slightly under other inflation measures, but the large gap between prices and incomes holds in any of them. Home prices are a national repeat-sales index and do not reflect individual local markets, which vary widely. The comparison is descriptive — it shows that prices outpaced incomes, not why.
Creator
Reuse this visualization
Cite this
License: CC BY 4.0
Embed code
<figure style="margin:0;max-width:1600px">
  <a href="https://chartive.org/visualizations/us-home-prices-vs-incomes-1987-2024" target="_blank" rel="noopener">
    <img src="https://chartive.org/infographics/us-home-prices-vs-incomes-1987-2024.png" alt="Line chart of real U.S. home prices and median household income, indexed to 1987 = 100. The home-price line rises to 196 by 2024 (up 96%), spiking to 166 in the 2006 bubble, crashing, then climbing to a new high. The median-income line stays far below, reaching only 130 (up 30%). A shaded gap between the two lines widens over time." width="1600" height="2133" style="max-width:100%;height:auto" />
  </a>
  <figcaption style="font:14px/1.4 system-ui,sans-serif;color:#57534e;margin-top:8px">
    Graphic by Chartive Editorial, using data from S&P CoreLogic Case-Shiller U.S. National Home Price Index — via <a href="https://chartive.org/visualizations/us-home-prices-vs-incomes-1987-2024" target="_blank" rel="noopener">Chartive</a>
  </figcaption>
</figure>
Reuse is welcome — the embed keeps a link back to the source.