Society
Verified dataAlone time is rising — fastest for the young
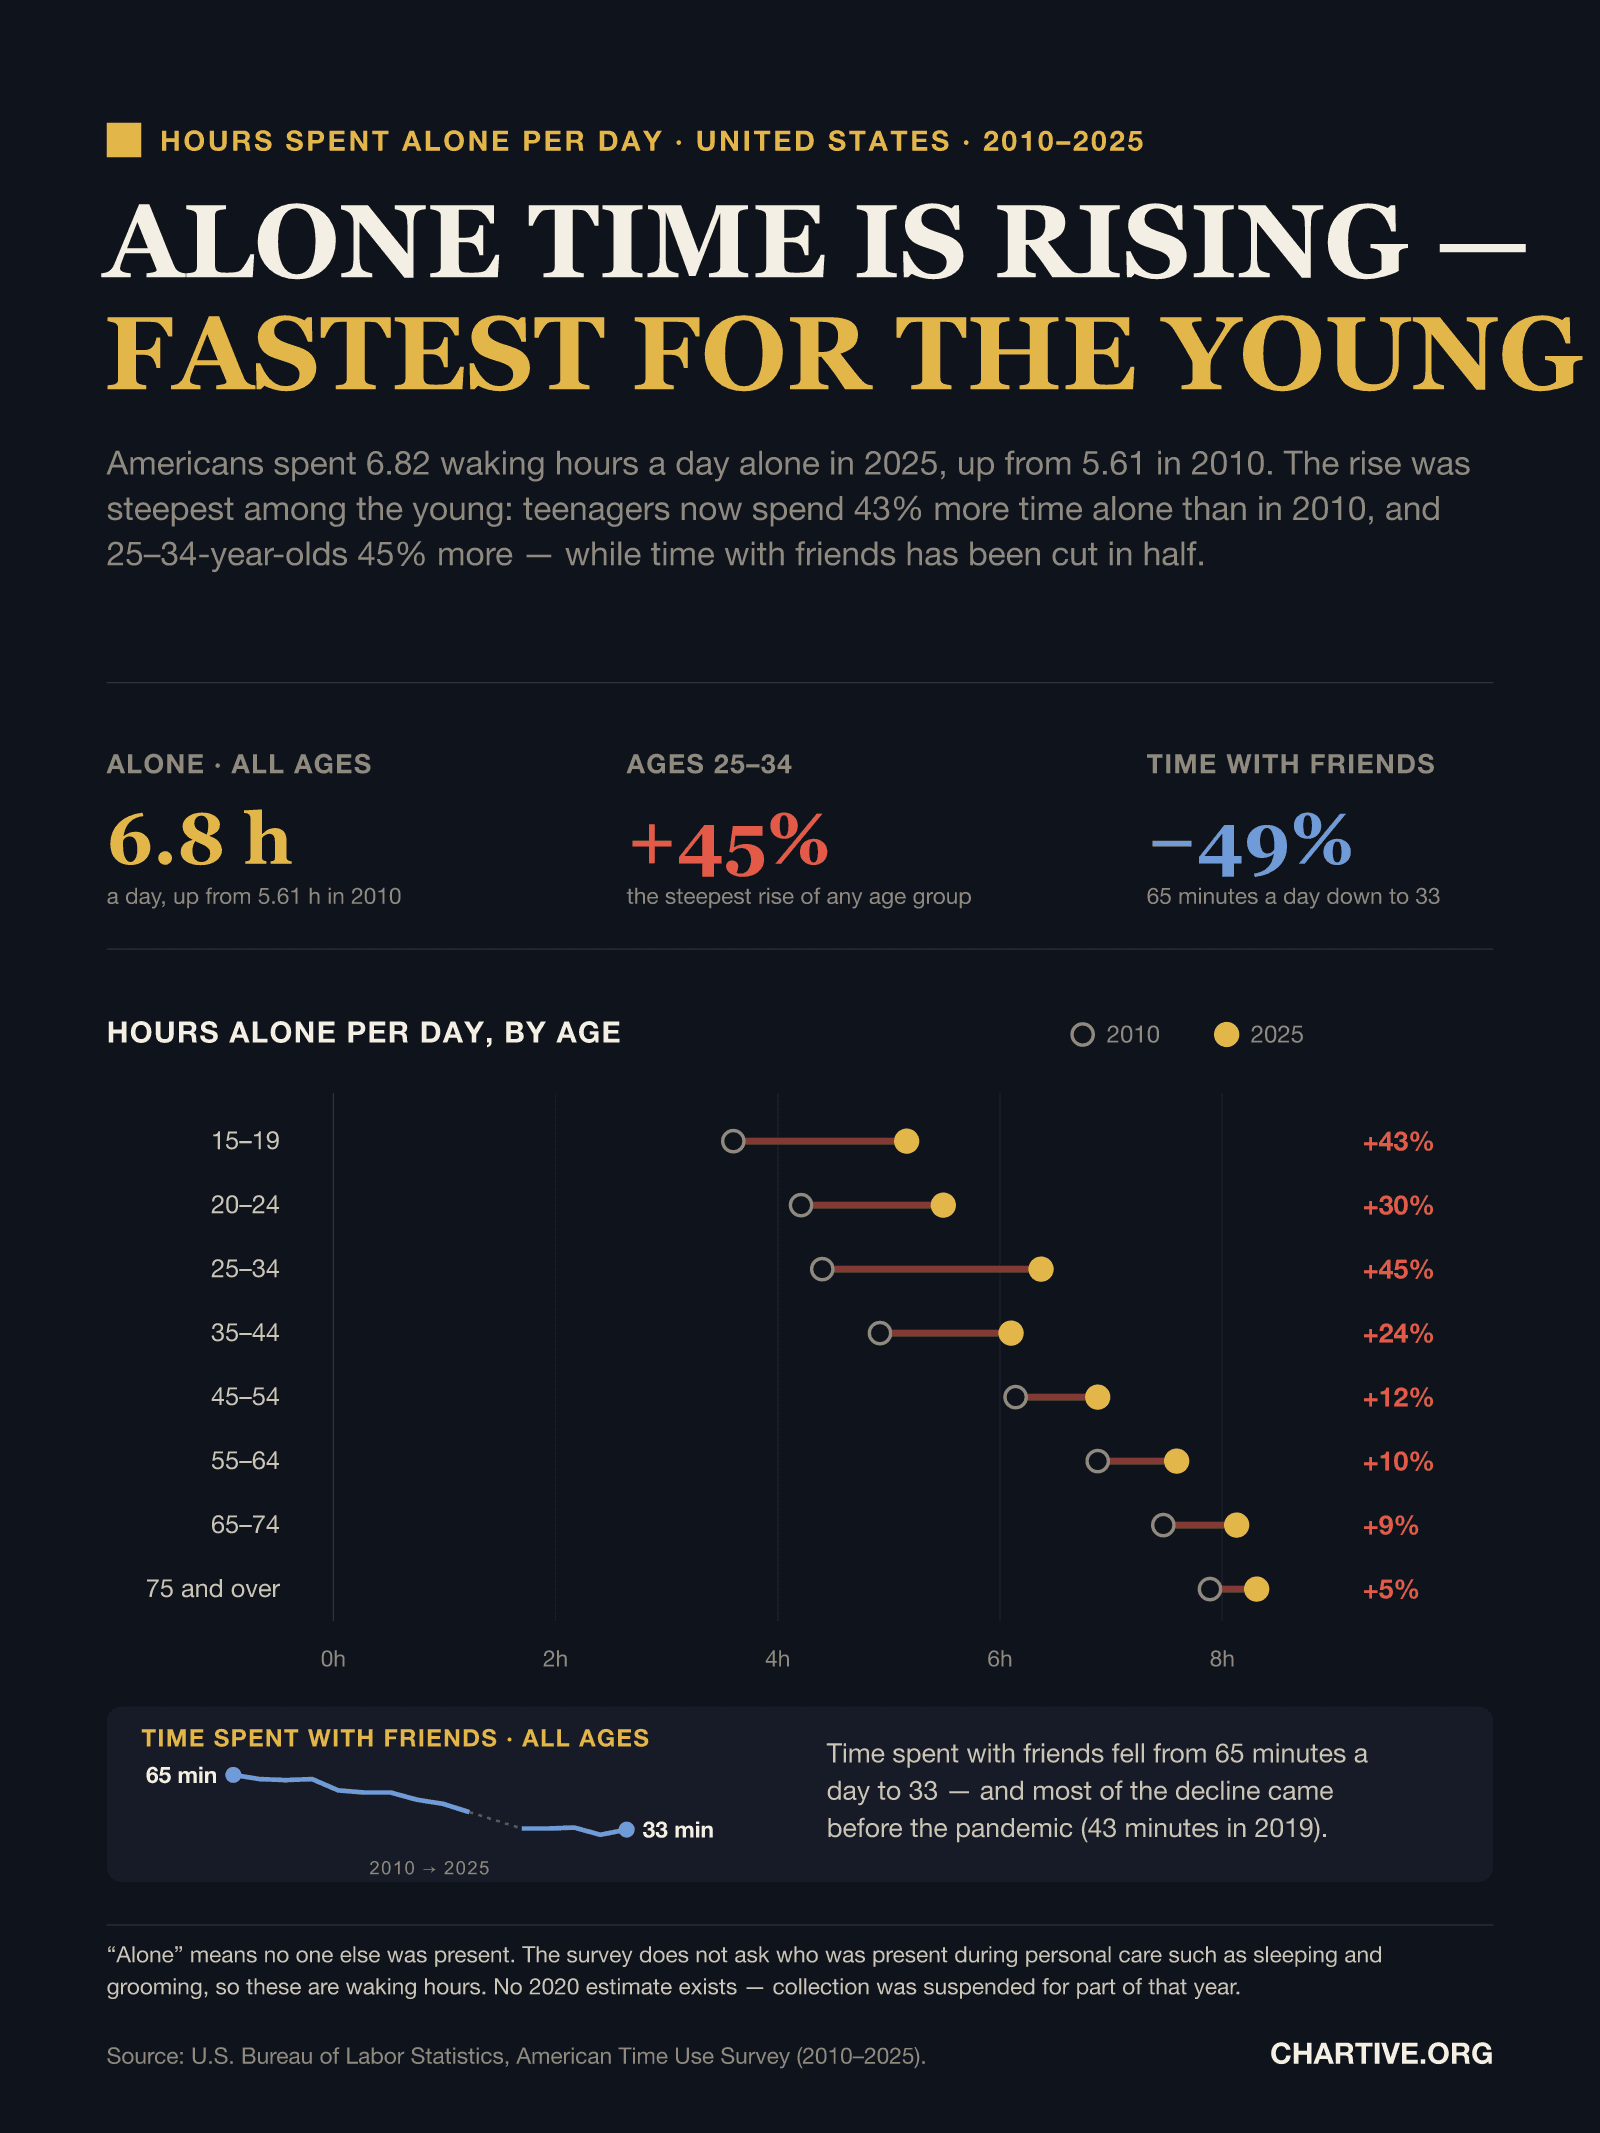
Americans spent 6.82 waking hours a day alone in 2025, up from 5.61 in 2010. Teenagers now spend 43% more time alone than they did in 2010, and 25–34-year-olds 45% more — while time with friends has been cut in half.
CSV · 15 rows · 2010–2025
Between 2010 and 2025 the average American went from 5.61 to 6.82 waking hours a day spent alone — an extra 1.2 hours every day. Solitude still rises with age (8.3 hours a day for those 75 and over), but it grew fastest at the other end of the scale: +45% for 25–34-year-olds and +43% for teenagers, against just +5% for the oldest group. Over the same period, time spent with friends fell from 65 minutes a day to 33 — and roughly two-thirds of that decline happened before the pandemic.
Key findings
- Americans spent 6.82 waking hours a day alone in 2025, up from 5.61 in 2010 — an extra 1.2 hours every day.
- The rise was steepest among the young: +45% for 25–34-year-olds and +43% for teenagers.
- It was gentlest among the oldest: just +5% for those 75 and over, and +9% for 65–74-year-olds.
- Older Americans are still the most alone — 8.3 hours a day at 75 and over — but the gap is closing from below.
- Today's teenagers spend more time alone (5.16 hours) than 35–44-year-olds did in 2010 (4.92 hours).
- Time spent with friends nearly halved, from 65 minutes a day in 2010 to 33 minutes in 2025.
- That decline is not a pandemic story: friend time was already down to 43 minutes by 2019, about two-thirds of the total fall.
Explore the data
Coverage: Jan 1, 2010 – Dec 31, 2025 · United States
Free to download and reuse. Get the data behind every new chart →
Sources
Primary source
American Time Use Survey
U.S. Bureau of Labor Statistics
Average hours per day spent alone and with friends, by age
Accessed Aug 29, 2026
Retrieved from the BLS Public Data API v2. Statistic type 'Average hours per day' (10101), all days, all persons. Series IDs and age groups verified against the official ATUS series catalogue (tu.series); no 2020 estimate is published.
Methodology
Data come from the U.S. Bureau of Labor Statistics American Time Use Survey (ATUS), which asks a nationally representative sample to account for every activity in a 24-hour day. Each figure is the statistic 'Average hours per day' (BLS stattype 10101), averaged across all persons in the age group — not only those who spent any time alone — and across all days of the week. 'Alone' is the ATUS 'who was with you' category meaning no one else was present; 'friends' is the category 'Friends, neighbors, or acquaintances'. Every series used is listed with its BLS series ID in the accompanying dataset, and all series share identical sex, education, employment and day-type dimensions so they are directly comparable.
What this does not show
Time alone is not the same as loneliness: ATUS records who was physically present, not how a person felt, and solitude can be chosen as easily as suffered. The survey does not ask who was present during personal care such as sleeping and grooming, so these figures cover waking, non-personal-care hours only. No 2020 estimate exists because collection was suspended for part of that year — the friends line is drawn with a break there. These are survey estimates and carry sampling error, so small year-to-year moves should not be over-read; the age pattern rests on the 15-year change, not on single years. Time spent with others online — messaging, gaming, video calls — counts as time alone if no one else was physically present.
Creator
Reuse this visualization
Cite this
License: CC BY 4.0
Embed code
<figure style="margin:0;max-width:1600px">
  <a href="https://chartive.org/visualizations/us-time-alone-2010-2025" target="_blank" rel="noopener">
    <img src="https://chartive.org/infographics/us-time-alone-2010-2025.png" alt="Dumbbell chart of average hours per day spent alone by Americans, comparing 2010 and 2025 across eight age groups. Every group moved toward more time alone. Ages 15–19 rose from 3.60 to 5.16 hours (+43%), 20–24 from 4.21 to 5.49 (+30%), 25–34 from 4.40 to 6.37 (+45%), 35–44 from 4.92 to 6.10 (+24%), 45–54 from 6.14 to 6.88 (+12%), 55–64 from 6.88 to 7.59 (+10%), 65–74 from 7.47 to 8.13 (+9%) and 75 and over from 7.89 to 8.31 (+5%). A panel below shows time spent with friends falling from 65 minutes a day in 2010 to 33 in 2025." width="1600" height="2133" style="max-width:100%;height:auto" />
  </a>
  <figcaption style="font:14px/1.4 system-ui,sans-serif;color:#57534e;margin-top:8px">
    Graphic by Chartive Editorial, using data from American Time Use Survey — via <a href="https://chartive.org/visualizations/us-time-alone-2010-2025" target="_blank" rel="noopener">Chartive</a>
  </figcaption>
</figure>
Reuse is welcome — the embed keeps a link back to the source.