Economy
Verified dataWhat got expensive — and what got cheap
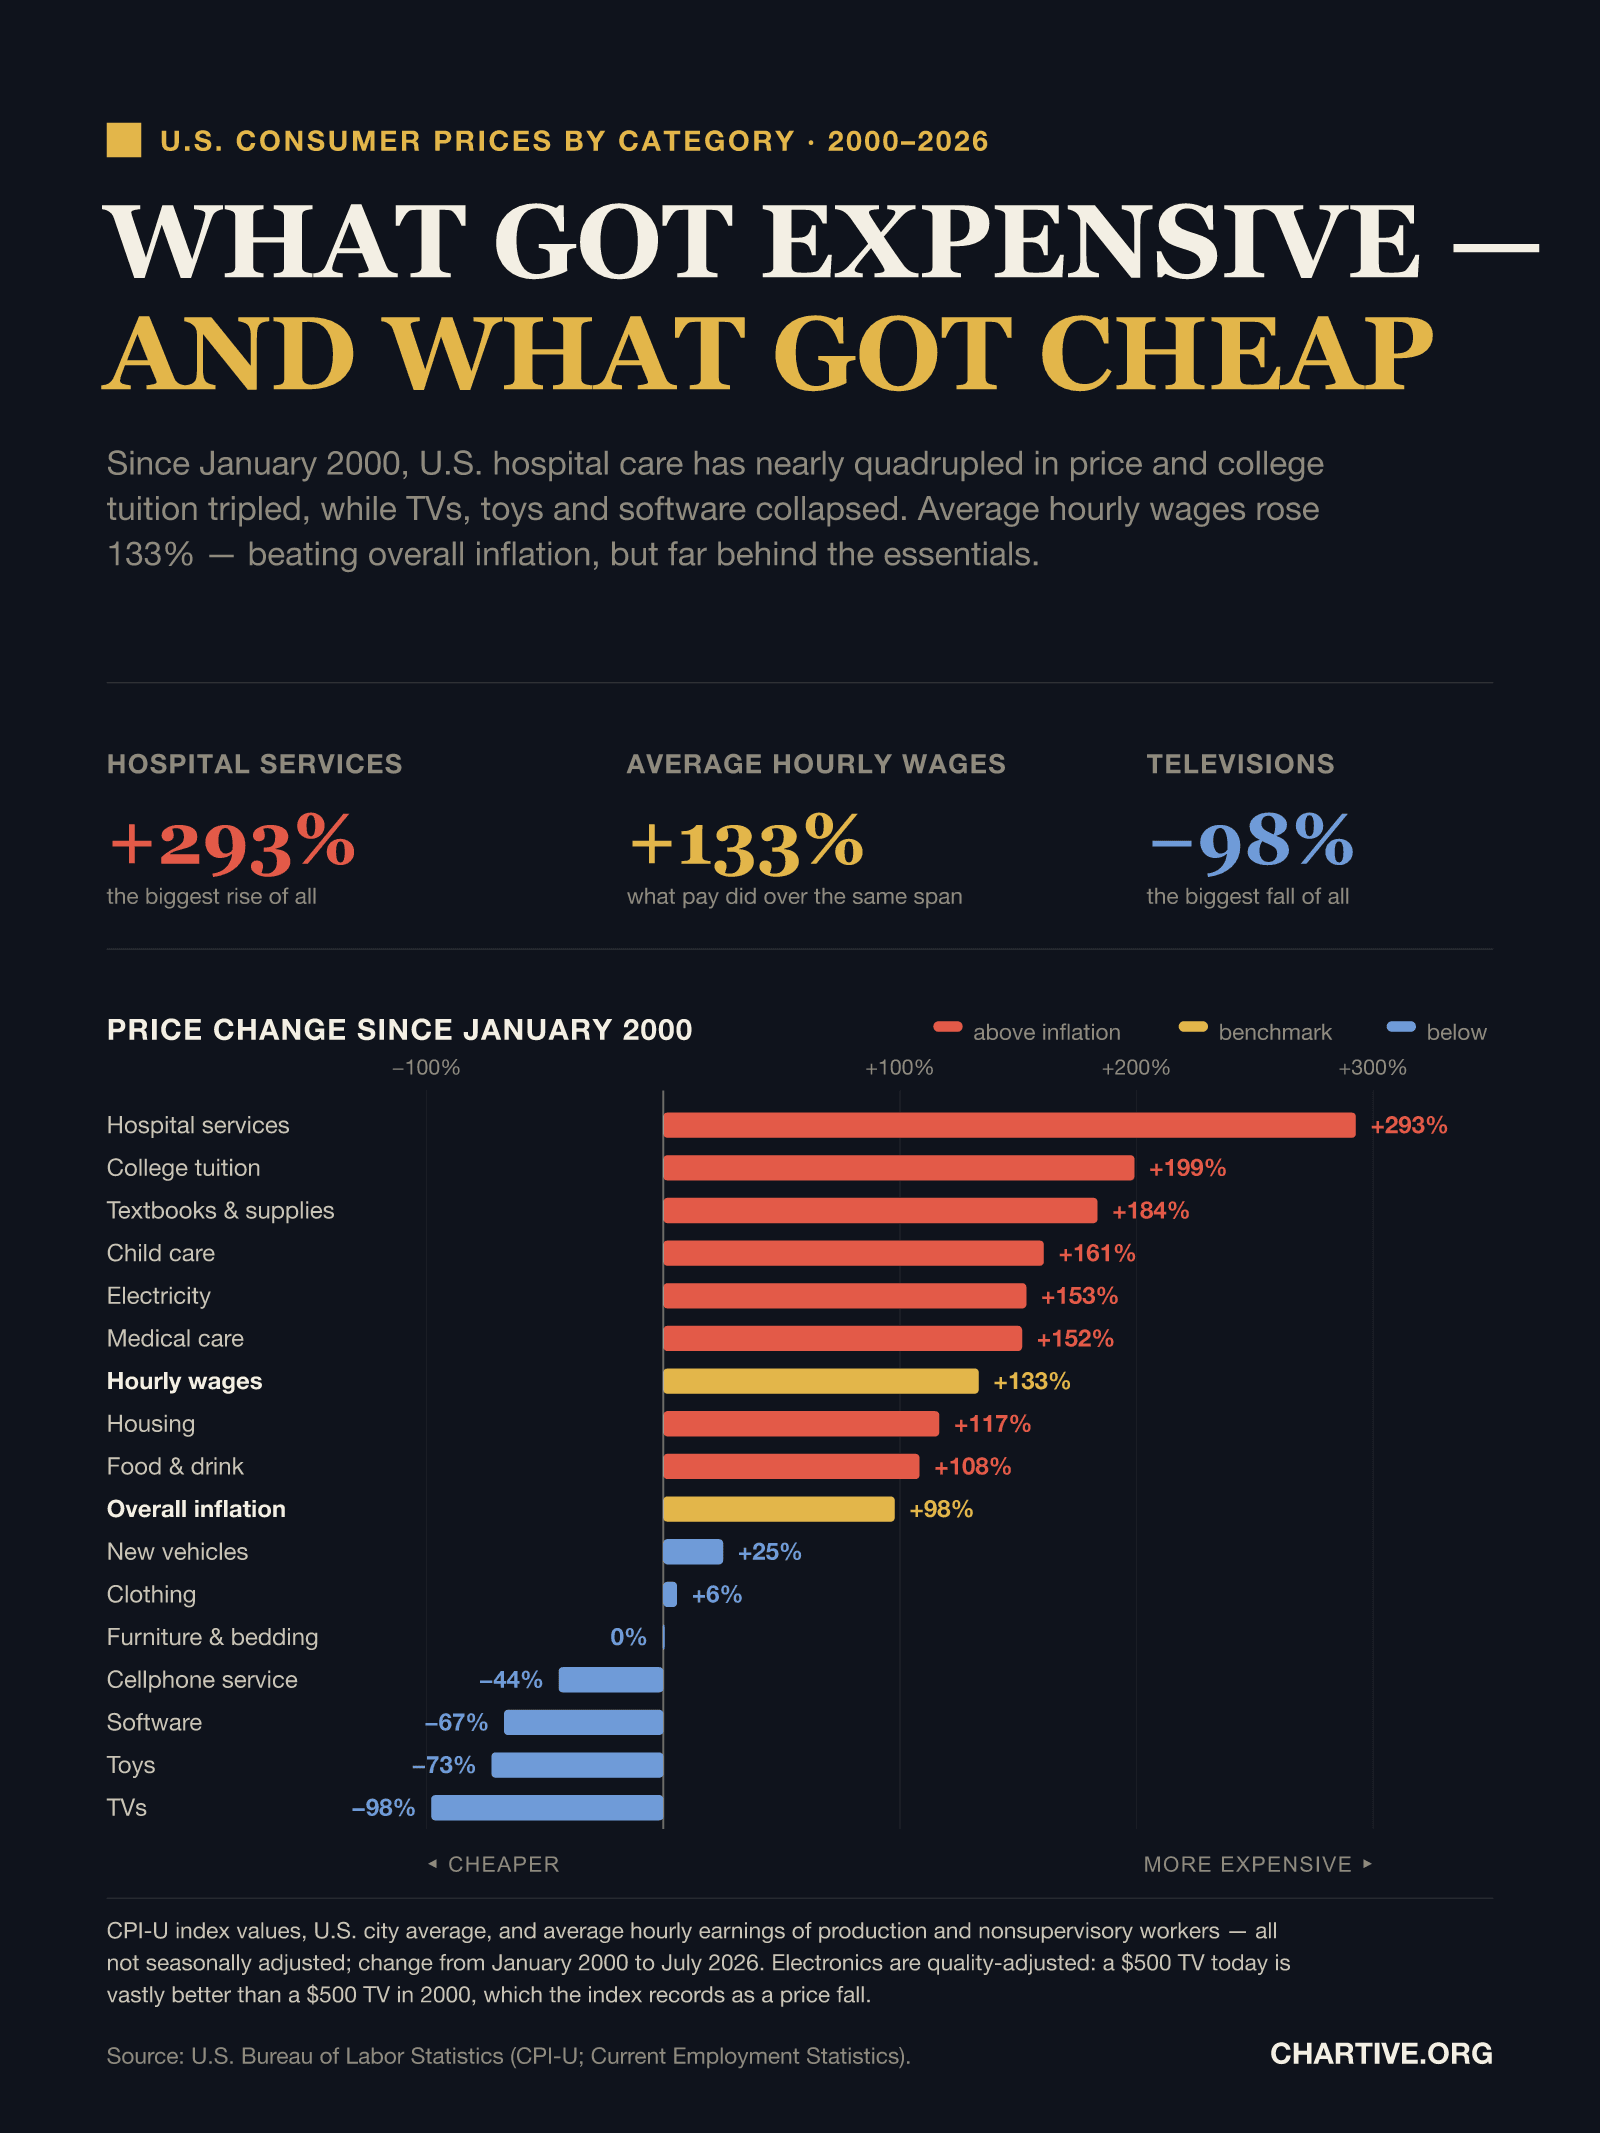
Since January 2000, U.S. hospital care has nearly quadrupled in price and college tuition tripled, while TVs, toys and software collapsed. Average hourly wages rose 133% — beating overall inflation, but far behind the essentials.
CSV · 17 rows · 2000–2026
Between January 2000 and July 2026, the things Americans must buy got dramatically more expensive — hospital care +293%, college tuition +199%, child care +161%, housing +117% — while manufactured goods got radically cheaper: televisions −98%, toys −73%, software −67%. Average hourly wages rose 133%, enough to beat overall inflation (+98%) by about 18% in real terms, but not nearly enough to keep pace with health care, education or child care.
Key findings
- Hospital care rose 293% — nearly quadrupling, the steepest increase of all 17 categories.
- College tuition rose 199% and textbooks & supplies 184%, roughly tripling in a generation.
- Child care (+161%), electricity (+153%) and medical care (+152%) all rose more than half again as fast as overall inflation.
- Average hourly wages rose 133% — ahead of overall inflation (+98%), worth about 18% in real terms over 26 years.
- But pay lagged every essential: health care, education, child care, electricity, housing (+117%) and food (+108%) all outpaced wages.
- Manufactured and traded goods moved the other way: televisions fell 98%, toys 73%, software 67% and cellphone service 44%.
- The pattern splits along one line — services that must be bought locally rose fastest, while globally traded, quality-adjusted goods fell.
Explore the data
Coverage: Jan 1, 2000 – Jul 31, 2026 · United States
Free to download and reuse. Get the data behind every new chart →
Sources
Primary source
Consumer Price Index (CPI-U)
U.S. Bureau of Labor Statistics
CPI for All Urban Consumers, U.S. city average, not seasonally adjusted
Accessed Aug 29, 2026
Retrieved directly from the BLS Public Data API v2; category series IDs and official item names are listed in the dataset. Series names verified against the official BLS item-code list (cu.item).
Primary source
Current Employment Statistics
U.S. Bureau of Labor Statistics
Average hourly earnings of production and nonsupervisory employees, total private
Accessed Aug 29, 2026
Series CEU0500000008, not seasonally adjusted, to match the CPI series basis.
Methodology
Each bar is the percentage change in a U.S. Bureau of Labor Statistics price index between January 2000 and July 2026. Categories are Consumer Price Index for All Urban Consumers (CPI-U) series, U.S. city average, not seasonally adjusted. The wage bar is average hourly earnings of production and nonsupervisory employees, total private (Current Employment Statistics), also not seasonally adjusted, so prices and pay are measured on the same basis. Bars are coloured by whether the category outpaced overall inflation. Every series is identified by its official BLS series ID and name in the accompanying dataset: hospital care is 'Hospital and related services', child care is 'Day care and preschool', textbooks & supplies is 'Educational books and supplies', clothing is 'Apparel', and cellphone service is 'Wireless telephone services'.
What this does not show
Electronics and software prices are quality-adjusted (hedonic): because a $500 television today is far more capable than a $500 television in 2000, the index records much of that improvement as a price decline. The steep falls for TVs, software and toys therefore reflect quality gains as well as cheaper goods, and are not what a shopper sees on a price tag. Figures are national averages and hide large regional differences, particularly for housing and electricity. Wages cover production and nonsupervisory workers — roughly four-fifths of private employment — and are nominal, pre-tax averages, not median take-home pay. Index changes describe prices, not how much of each category households actually buy.
Creator
Reuse this visualization
Cite this
License: CC BY 4.0
Embed code
<figure style="margin:0;max-width:1600px">
  <a href="https://chartive.org/visualizations/us-price-changes-2000-2026" target="_blank" rel="noopener">
    <img src="https://chartive.org/infographics/us-price-changes-2000-2026.png" alt="Diverging bar chart of U.S. price changes since January 2000. Bars extend right for rises: hospital services +293%, college tuition +199%, textbooks and supplies +184%, child care +161%, electricity +153%, medical care +152%, hourly wages +133%, housing +117%, food and drink +108%, overall inflation +98%, new vehicles +25%, clothing +6%. Bars extend left for falls: furniture and bedding 0%, cellphone service −44%, software −67%, toys −73%, televisions −98%." width="1600" height="2133" style="max-width:100%;height:auto" />
  </a>
  <figcaption style="font:14px/1.4 system-ui,sans-serif;color:#57534e;margin-top:8px">
    Graphic by Chartive Editorial, using data from Consumer Price Index (CPI-U) — via <a href="https://chartive.org/visualizations/us-price-changes-2000-2026" target="_blank" rel="noopener">Chartive</a>
  </figcaption>
</figure>
Reuse is welcome — the embed keeps a link back to the source.