Economy
Verified dataThe richest 1% now own almost as much as the bottom 90% combined
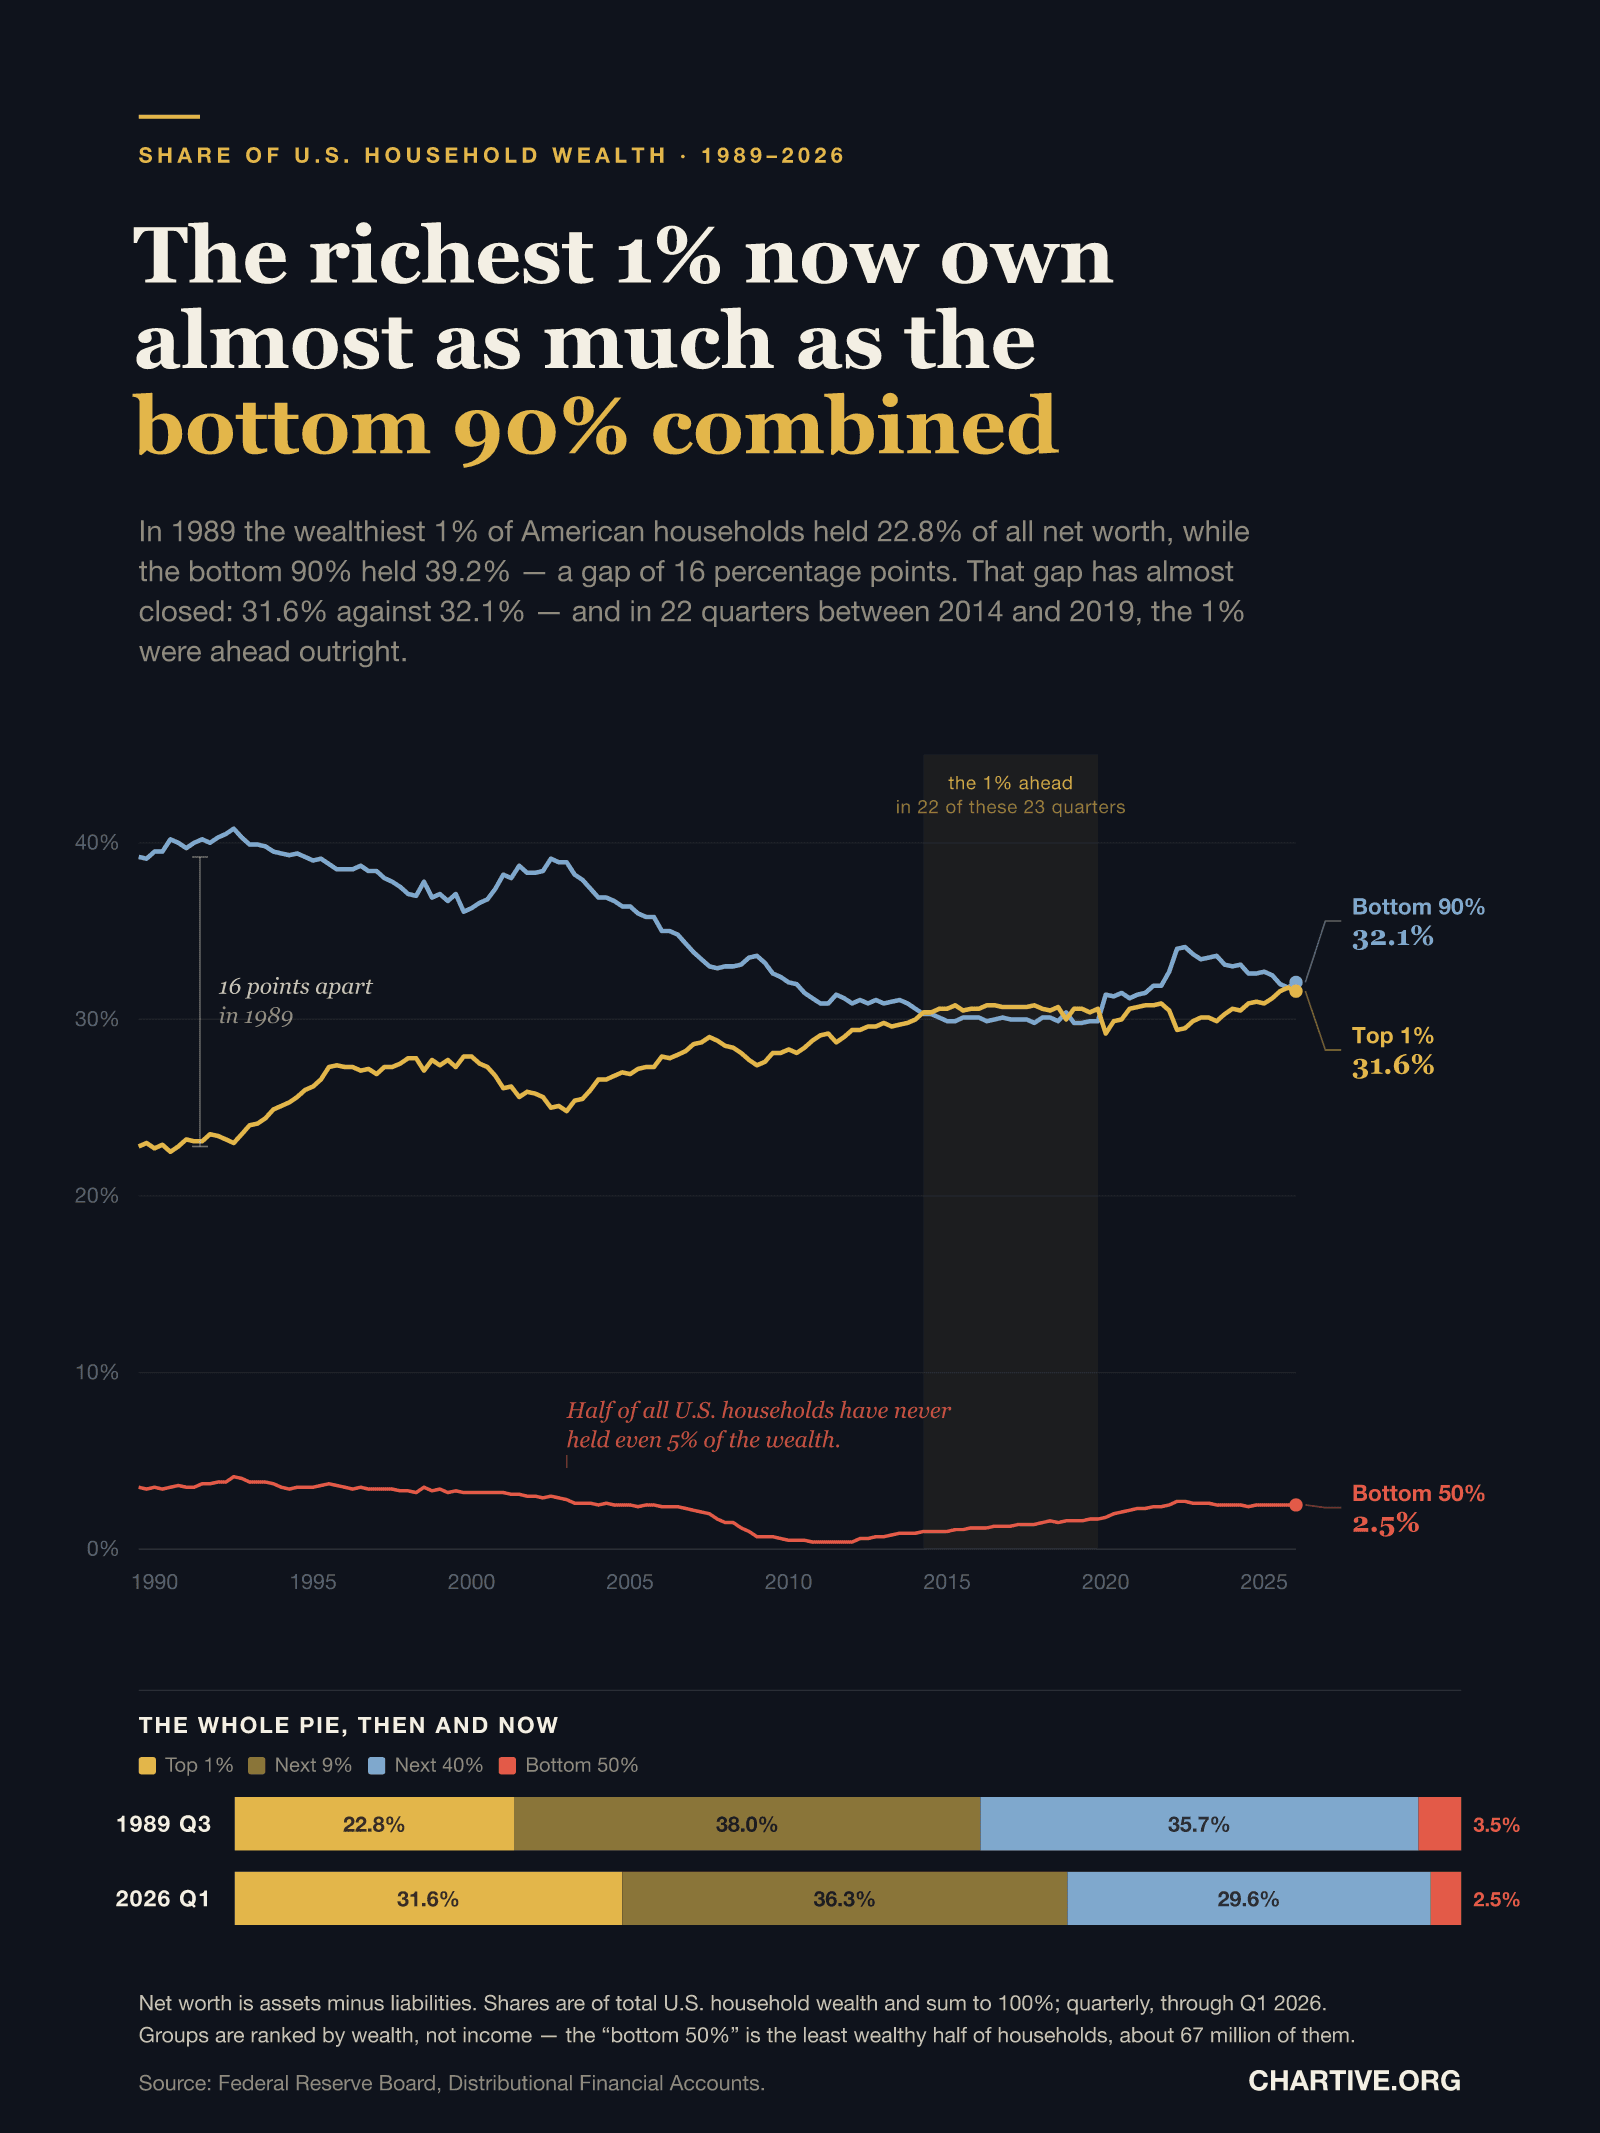
In 1989 the wealthiest 1% of American households held 22.8% of all net worth and the bottom 90% held 39.2% — a gap of 16 percentage points. That gap has almost closed: 31.6% against 32.1%.
CSV · 147 rows · 1989–2026
The share of U.S. household wealth held by the top 1% rose from 22.8% in 1989 to 31.6% in early 2026, while the bottom 90% fell from 39.2% to 32.1% — closing a 16-point gap to half a point. In 22 of the 23 quarters between 2014 and 2019 the top 1% held more wealth than the bottom 90% outright. The least wealthy half of households, about 67 million of them, hold 2.5% of the total and have never held even 5%.
Key findings
- The top 1% of U.S. households held 31.6% of all net worth in early 2026, up from 22.8% in 1989.
- The bottom 90% held 32.1%, down from 39.2% — so the two are now within half a percentage point of each other.
- In 22 of the 23 quarters between 2014 and 2019, the top 1% held more wealth than the bottom 90% combined.
- The bottom 50% — about 67 million households — hold 2.5%, and have never held even 5% in the whole series.
- The squeeze fell on the middle: the 50th–90th percentiles lost 6.1 points of share, more than any other group.
- The next 9% (the 90th–99th percentiles) barely moved, from 38.0% to 36.3%.
- In dollars, the top 1% hold about $55 trillion and the bottom 50% about $4.3 trillion, of roughly $174 trillion in total.
Explore the data
Coverage: Jul 1, 1989 – Mar 31, 2026 · United States
Free to download and reuse. Get the data behind every new chart →
Sources
Primary source
Distributional Financial Accounts
Board of Governors of the Federal Reserve System
Distribution of household wealth in the U.S. since 1989
Accessed Aug 29, 2026
Quarterly share and level series by wealth percentile group, retrieved via FRED (WFRBST01134, WFRBSN09161, WFRBSN40188, WFRBSB50215 and the matching level series). Series identity confirmed by checking that levels divided by their total reproduce the published shares.
Methodology
Data are the Federal Reserve Board's Distributional Financial Accounts, which combine the Survey of Consumer Finances with the quarterly Financial Accounts of the United States to estimate how household net worth is distributed. Net worth is assets minus liabilities. Households are ranked by wealth, not income, into four groups — the top 1%, the next 9% (90th–99th percentiles), the next 40% (50th–90th) and the bottom 50% — whose shares sum to 100%. The 'bottom 90%' line is the sum of the bottom 50% and the next 40%. Series identity was verified structurally: the published dollar levels for each group, divided by their total, reproduce the published share series exactly in the latest quarter and to within 0.09 percentage points across all 147 quarters, the residual being rounding. The series begins in the third quarter of 1989 and runs through the first quarter of 2026.
What this does not show
The DFA are model-based estimates, not a census of wealth: quarterly figures interpolate between triennial Survey of Consumer Finances waves, so short-run movements are less reliable than the long-run trend. Wealth held through the very top of the distribution is hard to measure, and the DFA do not separate the top 0.1%. Shares are published to one decimal place, so the four groups sum to 100% only within about 0.2 percentage points. Shares describe distribution, not living standards — a falling share can coexist with rising absolute wealth, and in dollar terms every group is richer than in 1989. The comparison between the top 1% and the bottom 90% is between very unequal numbers of households: roughly 1.3 million against 121 million.
Creator
Reuse this visualization
Cite this
License: CC BY 4.0
Embed code
<figure style="margin:0;max-width:1600px">
  <a href="https://chartive.org/visualizations/us-wealth-shares-1989-2026" target="_blank" rel="noopener">
    <img src="https://chartive.org/infographics/us-wealth-shares-1989-2026.png" alt="Line chart of the share of U.S. household wealth held by three groups from 1989 to 2026, on a full axis from 0 to 45 percent. The top 1% line rises from 22.8% to 31.6%. The bottom 90% line falls from 39.2% to 32.1%. The two nearly meet at the right edge, and a shaded band marks 2014 to 2019, when the top 1% was ahead in 22 of 23 quarters. A third line near the bottom shows the bottom 50%, flat between 4.1% and 2.5% for the whole period. Below, two stacked bars compare the full composition in 1989 Q3 and 2026 Q1." width="1600" height="2133" style="max-width:100%;height:auto" />
  </a>
  <figcaption style="font:14px/1.4 system-ui,sans-serif;color:#57534e;margin-top:8px">
    Graphic by Chartive Editorial, using data from Distributional Financial Accounts — via <a href="https://chartive.org/visualizations/us-wealth-shares-1989-2026" target="_blank" rel="noopener">Chartive</a>
  </figcaption>
</figure>
Reuse is welcome — the embed keeps a link back to the source.