Economy
Verified dataWhat got more expensive — and what got cheaper since 2000
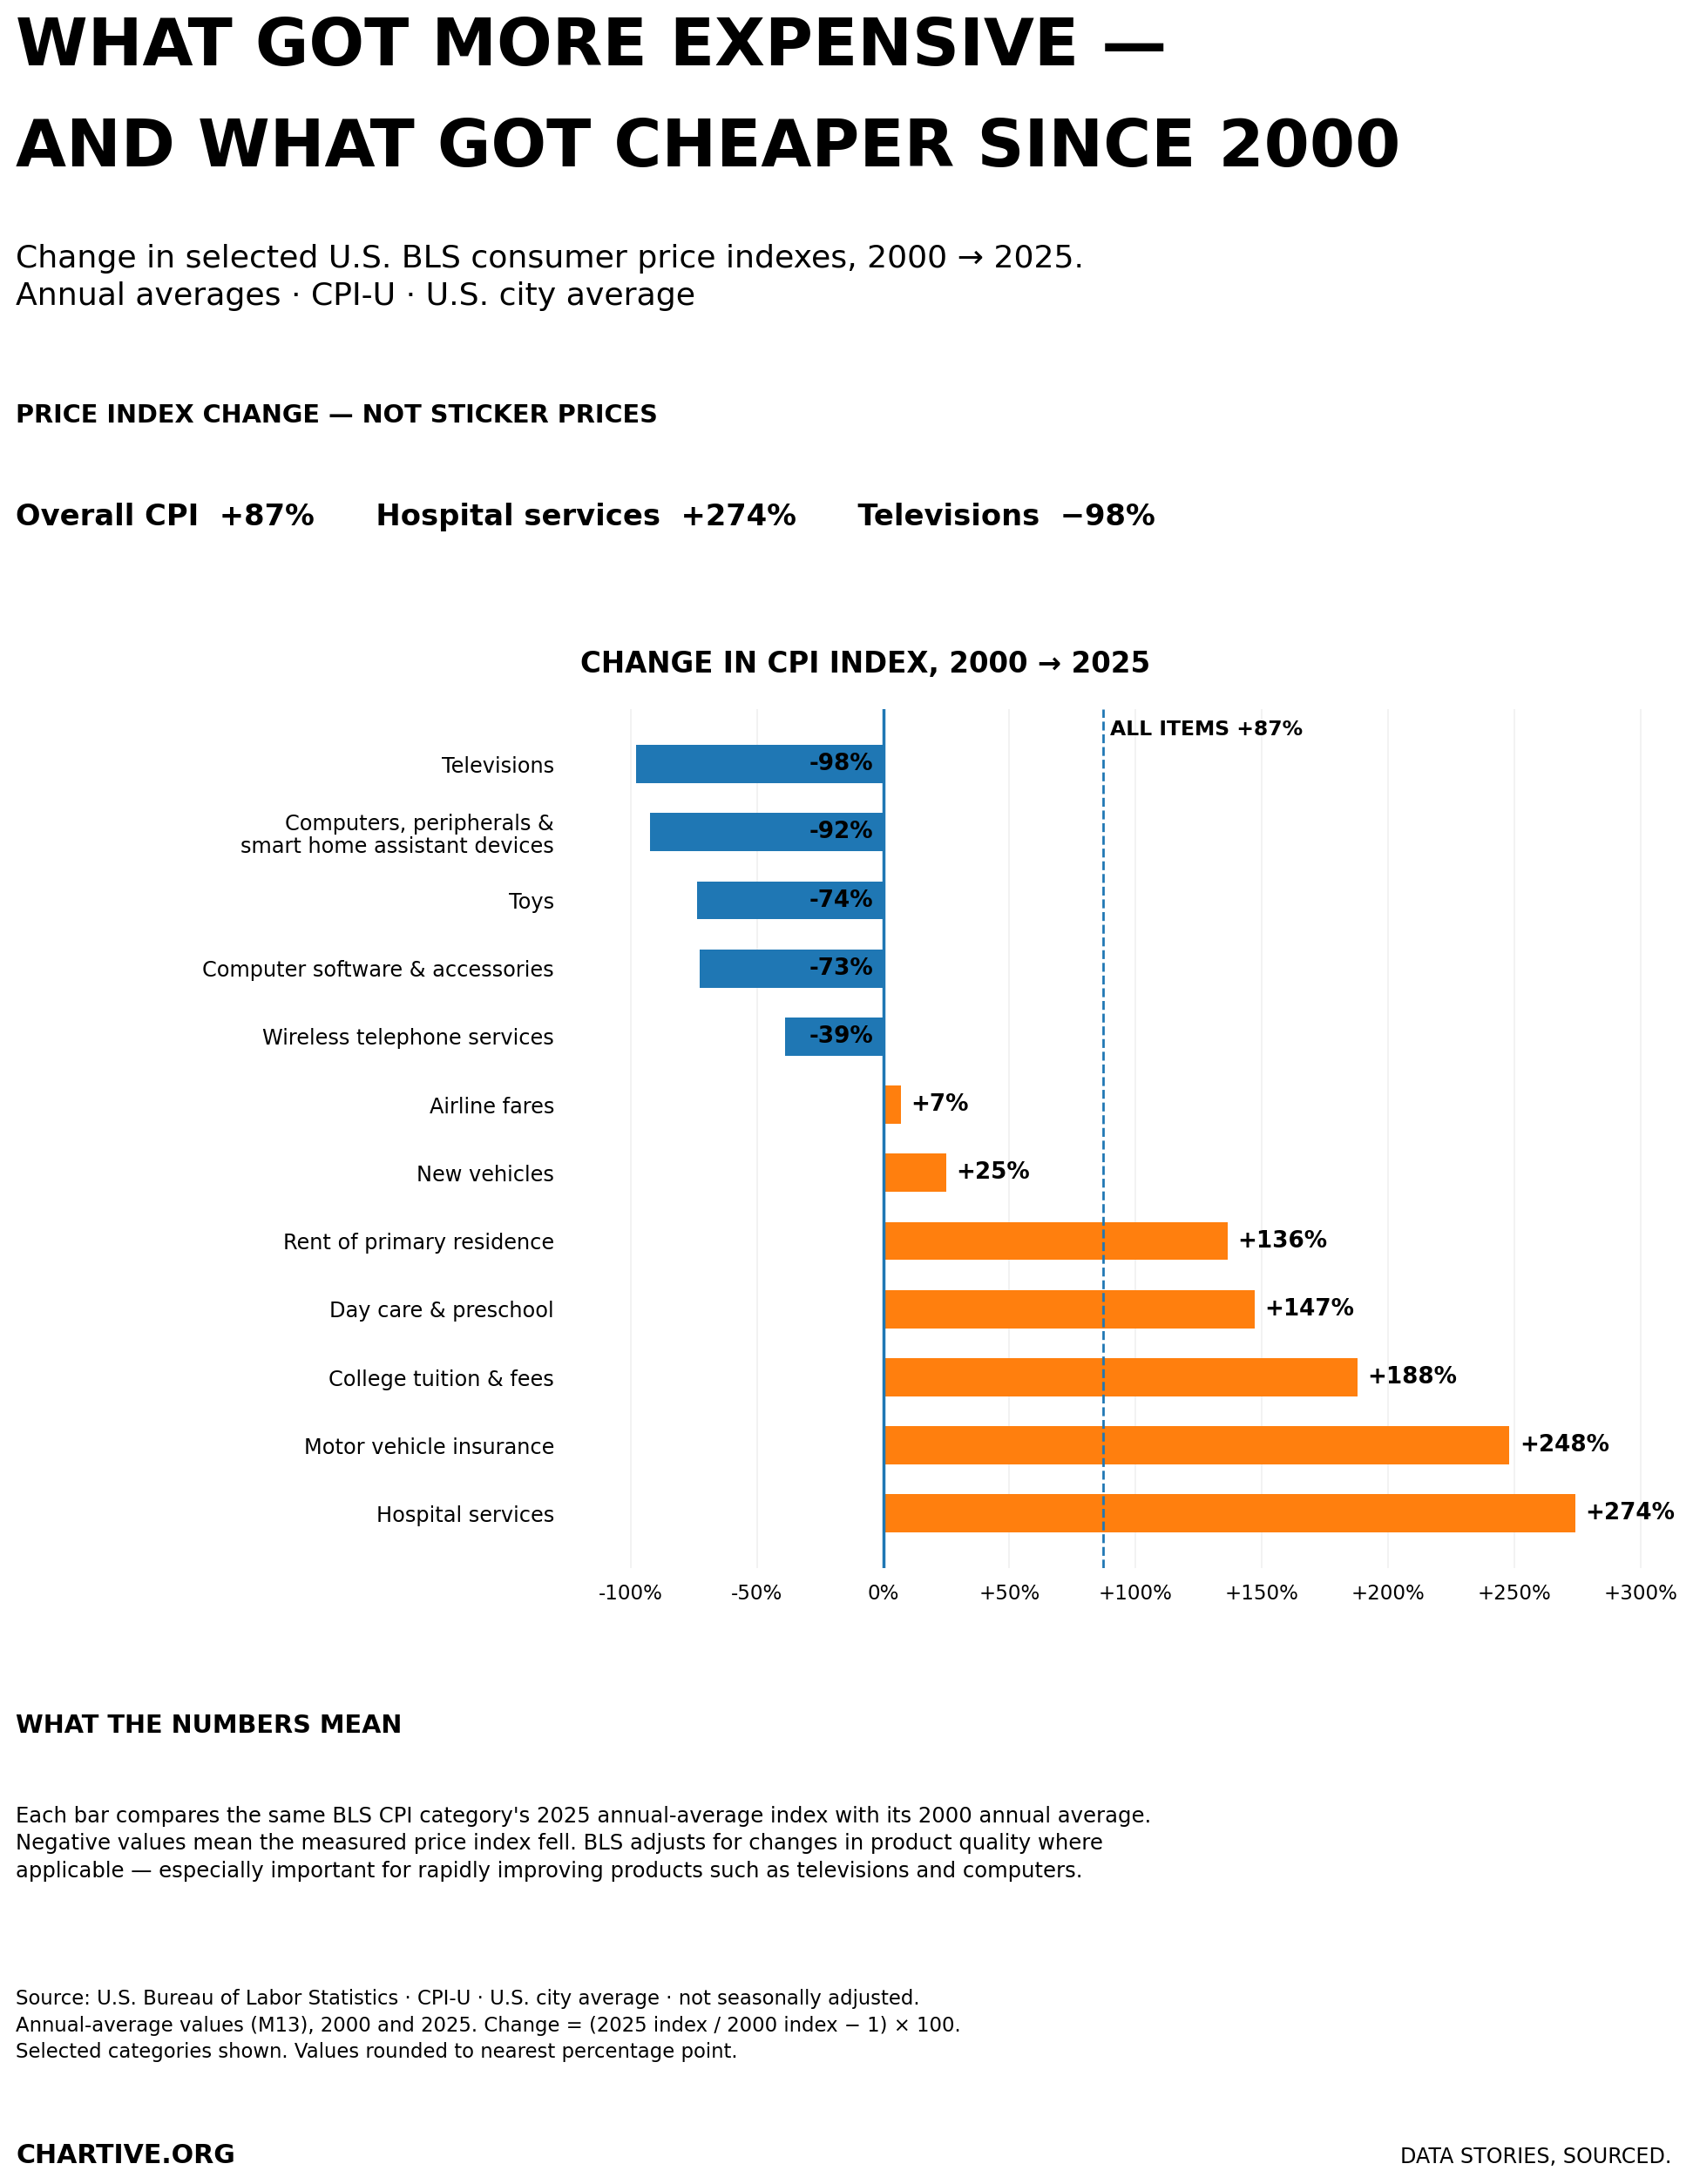
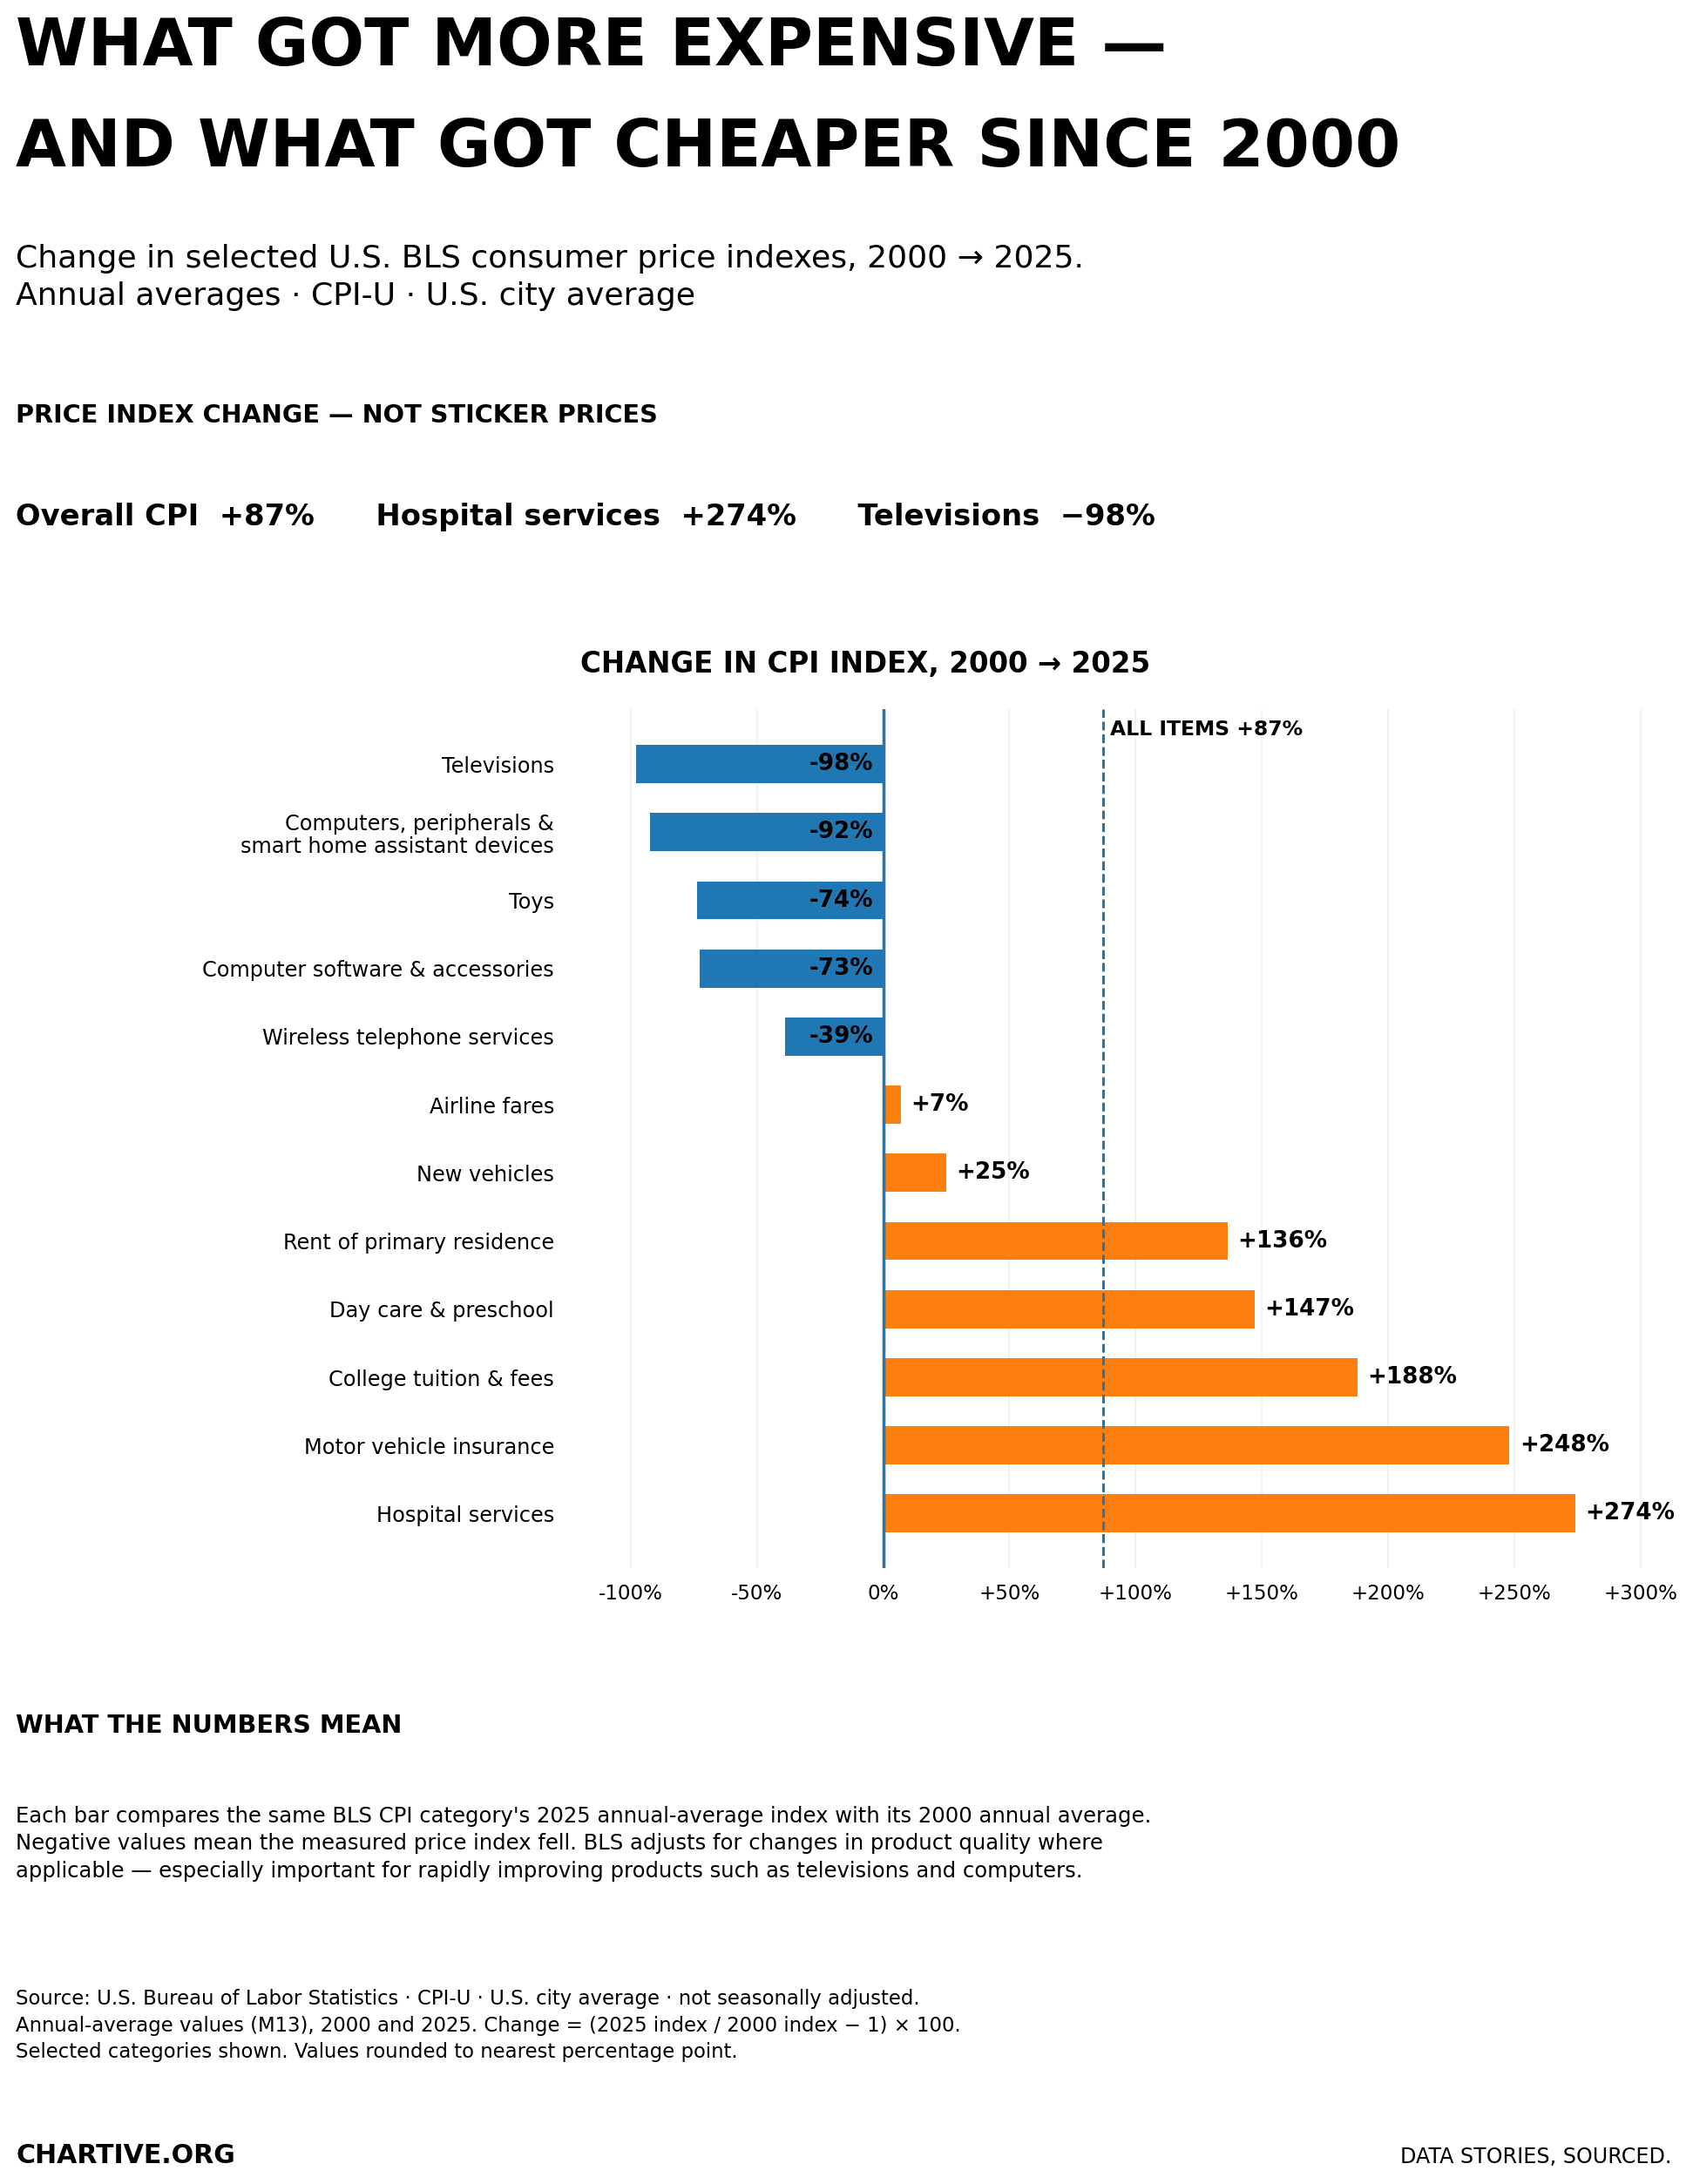
Change in selected U.S. Consumer Price Index categories, using annual averages for 2000 and 2025.
CSV · 13 rows · 2000–2025
The split is huge: the CPI for hospital services rose 274% since 2000 while the CPI for televisions fell 98% — even as overall consumer prices rose 87%.
Key findings
- Hospital services rose the most (+274%), followed by motor vehicle insurance (+248%) and college tuition (+188%).
- Technology fell the most: televisions −98%, computers −92%, toys −74%, software −73%.
- Everyday essentials outpaced the 87% overall CPI — rent +136%, day care +147% — while many manufactured goods got cheaper.
Explore the data
Coverage: Jan 1, 2000 – Dec 31, 2025 · United States
Free to download and reuse. Get the data behind every new chart →
Sources
Primary source
U.S. Bureau of Labor Statistics
U.S. Bureau of Labor Statistics
Consumer Price Index (CPI-U, U.S. city average)
Accessed Aug 14, 2026
Annual-average index values (M13) for 2000 and 2025, not seasonally adjusted; checked against BLS time-series files.
Methodology
Percent change in U.S. Bureau of Labor Statistics Consumer Price Index (CPI-U, U.S. city average) categories, using annual-average index values (M13) for 2000 and 2025, not seasonally adjusted. Change is calculated as (2025 index / 2000 index − 1) × 100. Selected categories are shown, with the overall CPI included as a reference.
What this does not show
These are changes in BLS consumer price indexes, not the price of one identical product. CPI indexes account for changes in product quality and market composition, which matters especially for fast-improving technology such as televisions and computers. A negative value means the measured price index was lower in 2025 than in 2000.
Creator
Reuse this visualization
Cite this
License: CC BY 4.0
Embed code
<figure style="margin:0;max-width:1943px">
  <a href="https://chartive.org/visualizations/what-got-more-expensive-cheaper-since-2000" target="_blank" rel="noopener">
    <img src="https://chartive.org/infographics/cpi-2000-2025.png" alt="Diverging bar chart of U.S. CPI category change from 2000 to 2025: hospital services up 274%, televisions down 98%, with overall CPI up 87%." width="1943" height="2507" style="max-width:100%;height:auto" />
  </a>
  <figcaption style="font:14px/1.4 system-ui,sans-serif;color:#57534e;margin-top:8px">
    Graphic by Chartive Editorial, using data from U.S. Bureau of Labor Statistics — via <a href="https://chartive.org/visualizations/what-got-more-expensive-cheaper-since-2000" target="_blank" rel="noopener">Chartive</a>
  </figcaption>
</figure>
Reuse is welcome — the embed keeps a link back to the source.